. 2020 Apr 1;130(4):1830-1842.
doi: 10.1172/JCI131375.

Inhibiting the coregulator CoREST impairs Foxp3+ Treg function and promotes antitumor immunity

Affiliations

Inhibiting the coregulator CoREST impairs Foxp3+ Treg function and promotes antitumor immunity

Yan Xiong et al. J Clin Invest. .

Abstract

Foxp3+ Tregs are key to immune homeostasis, but the contributions of various large, multiprotein complexes that regulate gene expression remain unexplored. We analyzed the role in Tregs of the evolutionarily conserved CoREST complex, consisting of a scaffolding protein, Rcor1 or Rcor2, plus Hdac1 or Hdac2 and Lsd1 enzymes. Rcor1, Rcor2, and Lsd1 were physically associated with Foxp3, and mice with conditional deletion of Rcor1 in Foxp3+ Tregs had decreased proportions of Tregs in peripheral lymphoid tissues and increased Treg expression of IL-2 and IFN-γ compared with what was found in WT cells. Mice with conditional deletion of the gene encoding Rcor1 in their Tregs had reduced suppression of homeostatic proliferation, inability to maintain long-term allograft survival despite costimulation blockade, and enhanced antitumor immunity in syngeneic models. Comparable findings were seen in WT mice treated with CoREST complex bivalent inhibitors, which also altered the phenotype of human Tregs and impaired their suppressive function. Our data point to the potential for therapeutic modulation of Treg functions by pharmacologic targeting of enzymatic components of the CoREST complex and contribute to an understanding of the biochemical and molecular mechanisms by which Foxp3 represses large gene sets and maintains the unique properties of this key immune cell.

Keywords: Cancer immunotherapy; Cellular immune response; Immunology; Oncology; T cells.


Conflict of interest statement

Conflict of interest: The authors have declared that no conflict of interest exists.

Figures

Figure 1
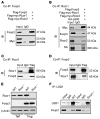
Figure 1. Association of Foxp3 with the CoREST complex.
(A) In HEK-293T cells transfected with tagged constructs encoding Foxp3 (47 kD), Rcor1 (44 kD), and Rcor2 (53 kD), IP of Foxp3 led to co-IP of Rcor1 but not Rcor2 protein. (B) In HEK-293T cells transfected with the same Foxp3, Rcor1, and Rcor2 constructs as shown in A, plus HA-tagged p300, IP of Rcor1 led to co-IP of Foxp3, Rcor2, and p300. (C) Lysates of Tregs isolated from lymph nodes and spleens of WT B6 mice were subjected to IP using anti-Rcor1 Ab or control IgG; Rcor1 and Rcor1-associated Foxp3 were detected by immunoblotting. (D) Tregs isolated from B6 lymph nodes and spleens after expansion in vivo (rIL-2/anti–IL-2, 3 days) were subjected to IP using anti-Foxp3 Ab or control IgG; shown is IB detection of Foxp3 and Foxp3-associated Rcor1. (E) Western blots of Rcor1 and Foxp3 expression in Tregs and Teff cells from WT mice or those with conditional deletion of Rcor1 in their Tregs; β-actin was used as a loading control. (F) IP of Lsd1 from WT Tregs led to co-IP of Foxp3, whereas IP of Lsd1 from Rcor1–/– Tregs led to only trace levels of Foxp3 co-IP.
Figure 2
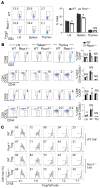
Figure 2. Cellular effects of Rcor1 deletion in Foxp3+ Tregs.
(A) Percentages of CD4+Foxp3+ Tregs in lymph nodes, spleens, and thymi of WT and Rcor1–/– mice, shown as representative plots (left) and with statistical analyses (right). (B) T cell activation markers in CD4+ and CD8+ T cells of WT and Rcor1−/− mice were analyzed as percentages of gated cells; data shown are representative of 4 to 6 experiments (left). Statistical analyses are shown (right). In (A) and (B) data are shown as mean ± SD, 6 to 8 mice/group. Student’s t test for unpaired data. *P < 0.05 vs. WT control. (C) Treg suppression assays were performed using pooled (4 mice/group) Tregs and Teff cells from lymph nodes and spleens of WT and Rcor1–/– mice, as indicated. Assays were run in triplicate and repeated at least 3 times. The results of a representative experiment are shown, along with the percentages of proliferating cells in each panel.
Figure 3
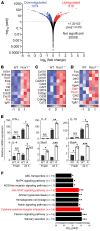
Figure 3. RNA-Seq of Rcor1–/– vs.
WT Tregs. (A) Volcano plot showing statistical significance (Padj) vs. fold change for genes differentially expressed as a result of Rcor1 deletion in Foxp3+ Tregs. (BD) Heatmaps of fragments per kilobase of transcript per million mapped reads of (B) cytokines and cytokine receptors, (C) leukocyte antigens, and (D) transcription factors in WT vs. Rcor1–/– Tregs. Data underwent Z score normalization for display. (E) qPCR results of gene expression in WT vs. Rcor–/– (R) Tregs that were freshly isolated or cultured under activating conditions for 24 hours (1:1 ratio of CD3/CD28 mAb-coated beads); data are shown as mean ± SD, 3 mice/group. Student’s t test for unpaired data. *P < 0.05; **P < 0.01; ***P < 0.001 for the indicated comparisons. (F) Functional annotation clustering showed enrichment of genes associated with inflammatory and immune responses in Rcor1–/– versus WT Tregs.
Figure 4
Figure 4. Rcor1 deletion promotes Treg expression of IL-2, IFN-γ, and T-bet.
ChIP assays of (A) IL2, (B) Ifng, and (C) T-box1 promoters with pull-down Ab of Lsd1, Hdac1, Hdac2, and ac–histone 3 (ac-H3). (D) Representative bands and statistical analyses of Western blots for T-bet and β-catenin expression in fresh and 24 hour–stimulated (1:1 ratio of CD3/CD28 mAb-coated beads) WT or Rcor1–/– Tregs and Teff cells harvested from corresponding mice. Data are shown as mean ± SD, 4–6 samples/group. Student’s t test for unpaired data. *P < 0.05; **P < 0.01; ***P < 0.001; ****P < 0.0001 vs. WT control.
Figure 5
Figure 5. Rcor1 deletion affects the functions of the CoREST complex in Tregs.
(A) Localization of Rcor1 and Foxp3 in Tregs. Representative of 3 independent experiments. Original magnification, ×400. Scale bars: 10 μm. (B) Representative bands (left) and statistical analysis (right) of Western blotting for HDAC1/2/LSD1 in Rcor1–/– versus WT Tregs (β-actin loading control). (C) Western blot of H3K4Me2 and H3K9Ac level in Rcor1–/– versus WT Tregs (total histone 3 as loading control) (left), and statistical analysis of Western blotting (right). (D) Western blot results of H3K4Me2 and H3K9Ac levels in 293T cell line after overexpression of Rcor1 compared with EV (β-actin loading control) (left) and statistical analysis of Western blotting (right). Data are shown as mean ± SD, 4–6 samples/group. Student’s t test for unpaired data. *P < 0.05; **P < 0.01; ***P < 0.001 vs. WT control.
Figure 6
Figure 6. Rcor1 deletion impairs Treg function in vivo.
(A) The ability of Rcor1–/– Tregs (0.5 × 10⁶) to dampen homeostatic proliferation at 7 days after adoptive transfer of Teff cells (1 × 10⁶) into Rag1–/– mice was significantly decreased compared with the effects of corresponding numbers of WT Tregs (P < 0.05). (B) The stability of YFP+ Rcor1–/– Tregs (1 × 10⁶) at 4 weeks after adoptive transfer of Teff cells (0.25 × 10⁶) in Rag1–/– mice was significantly decreased compared with the effects of corresponding WT Tregs, as shown by flow cytometric evaluation of viable cells. *P < 0.05; ***P < 0.001. (C) WT or Rcor1–/– mice (5 mice/group) received BALB/c cardiac allografts plus CD40L mAb/DST; long-term allograft survival was seen in WT but not Rcor1–/– recipients (P < 0.01). (DI) Treg-specific deletion of Rcor1 enhanced antitumor immunity. Tumor volumes and AUC data of AE17 (D) and TC1 (G) lung tumors were smaller in syngeneic Rcor1–/– vs. WT mice (n = 8–10/group) after inoculation and reached statistical significance (P < 0.05). Analysis of CD4+Foxp3+, CD4+, CD8+, and CD8+IFN-γ+ cells in lymphoid tissues from Rcor1–/– or WT mice, bearing AE17 (E) or TC1 (H) tumors. qPCR analysis of gene expression of CD4, CD8, IFN-γ, granzyme B, and Foxp3 in tumor samples of AE17 (F) or TC1 (I) harvested at the end of each experiment. Data are shown as mean ± SD, 4–6 samples/group. Student’s t test for unpaired data. *P < 0.05; **P < 0.01; ***P < 0.005; ****P < 0.001 vs. WT control.
Figure 7
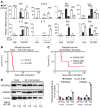
Figure 7. CoREST complex inhibitor affects Treg gene expression and function in vitro and in vivo.
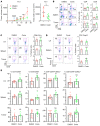
(A) qPCR analyses of indicated gene expression in Teff cells and Tregs. qPCR data were normalized to 18S, and data (mean ± SD) are representative of 2 independent experiments involving 5 mice/group. *P < 0.05; **P < 0.01; ***P < 0.001; ****P < 0.0001 vs. WT control. (B) Immediately after cardiac allografting from BALB/c donors, recipient C57BL/6 Rag1–/– mice (5 mice/group) were adoptively transferred with 1 million B6 Teff cells and 0.5 million B6 Tregs and treated with or without JK-2-68 (10 mg/kg/d, 14 days). P < 0.01 for 2 groups. (C) B6 recipients were transplanted with BALB/c cardiac allografts (5 mice/group) and treated with CD40L mAbs (200 μg)/DST and JK-2-68 (10 mg/kg/d, 14 days). P < 0.01 for 2 groups. (D) Representative bands (left) and statistical analysis (right) of Western blotting for H3K4Me2 and HK9Ac expression in fresh Tregs or Tregs stimulated for 24 hours by CD3/CD28 mAb-coated beads with or without JK-2-68 (10 μM).
Figure 8
Figure 8. Effects of CoREST complex inhibitor on human Tregs.
(A) Human healthy donor Tregs were incubated with corin (1 μM) for 2.5 hours, washed twice, and incubated with CFSE-labeled, anti-CD3ε microbead-stimulated healthy donor PBMCs for 5–6 days. Representative data show impaired Treg suppressive function for CD4+ responder cells (CD8+ responder cells are shown in Supplemental Figure 8). (B) After suppression assays, cells were stained with fixable live/dead marker Zombie Yellow and Foxp3, cells were gated into CD4+CFSEZombie+ (= dead Treg), CD4+CFSEZombieFoxp3 (= live exTreg), and CD4+CFSEZombieFoxp3+ (= live Treg), to evaluate Treg stability (loss of Foxp3) and survival (% of Zombie cells). (C) Statistical analysis of data shown in A; Tregs from 5 healthy donors and Tregs and responder PBMCs from 3 healthy donors were tested in 5 independent experiments (total of 12 suppression assays). Treg abilities to suppress divisions of CD4+ and CD8+ responders were analyzed separately; 1 sample t test with theoretical mean = 1. (D) Statistical analysis of data from B; data from 6 assays were pooled, Wilcoxon’s signed ranked test. (E) Cells were stained for Zombie Yellow, Foxp3, and CTLA-4. Viable CD4+CFSEZombieFoxp3+ Tregs were gated and evaluated for CTLA-4 expression (MOF, percentage of positive cells) and Foxp3 MOF. Data were pooled from 6 assays. Wilcoxon’s signed ranked test. (FJ) Healthy donor PBMCs (from 5 different donors in 3 experiments) were incubated with corin (1 μM) and stimulated overnight with CD3ε/CD28 mAb-coated beads (1.3 beads/cell). (F) TIGIT and GITR expression tended to be decreased in viable CD4+Foxp3+ Tregs, but without significance, whereas CD127 expression significantly increased in the presence of corin. (G) Representative example of Foxp3 expression in PBMCs and (H) Foxp3 MOF in viable CD4+Foxp3+ Tregs. (I and J) Statistics showing (I) decreased Treg numbers and (J) decreased MOF of Foxp3 in human Tregs treated with corin. All tests in F through I are 1-sample t tests with Bonferroni’s correction for multiple comparisons, whereas data shown in J were evaluated by unpaired t test. *P < 0.05; **P < 0.01; ***P < 0.001; ****P < 0.0001. Data are shown as mean ± SD.
Figure 9
Figure 9. CoREST complex inhibitor enhances antitumor immunity.
(A) TC1 tumor volumes and AUC data were smaller in C57BL/6 mice treated with corin (10 mg/kg/d) vs. DMSO (n = 8–10/group). Analysis of the percentages of (B) CD4+ and CD8+ cells, (C) CD8+IFN-γ+ cells, (D) CD4+Foxp3+ cells, and (E) T cell activation markers (CD8+CD69+, CD4+CD69+, CD4+CD44hiCD62Llo, CD8+CD44hiCD62Llo) in lymph nodes, spleens, and tumors from corin- and DMSO-treated groups. Data are shown as mean ± SD, 8–10 samples/group. Student’s t test for unpaired data. *P < 0.05; **P < 0.01 vs. control.
Figure 10
Figure 10. Schematic of the actions of the CoREST complex in Foxp3+ Tregs.
In WT cells, Foxp3 recruits the CoREST complex, consisting of Rcor1, Hdac1 or Hdac2, and Lsd1, to repress expression of multiple genes, including IL-2 and IFN-γ. In the absence of Rcor1, recruitment of the CoREST complex by Foxp3 is markedly impaired, leading to derepression of multiple genes, including those encoding IL-2 and IFN-γ, and downstream signaling molecules, such as T-bet and STAT1.

Comment in

  • CoRESTed development of regulatory T cells.
    Morales-Nebreda L, Helmin KA, Singer BD. Morales-Nebreda L, et al. J Clin Invest. 2020 Apr 1;130(4):1618-1621. doi: 10.1172/JCI135713. J Clin Invest. 2020. PMID: 32125289 Free PMC article.

References

    1. Sakaguchi S, Yamaguchi T, Nomura T, Ono M. Regulatory T cells and immune tolerance. Cell. 2008;133(5):775–787. doi: 10.1016/j.cell.2008.05.009. - DOI - PubMed
    1. Josefowicz SZ, Lu LF, Rudensky AY. Regulatory T cells: mechanisms of differentiation and function. Annu Rev Immunol. 2012;30:531–564. doi: 10.1146/annurev.immunol.25.022106.141623. - DOI - PMC - PubMed
    1. Bauer CA, Kim EY, Marangoni F, Carrizosa E, Claudio NM, Mempel TR. Dynamic Treg interactions with intratumoral APCs promote local CTL dysfunction. J Clin Invest. 2014;124(6):2425–2440. doi: 10.1172/JCI66375. - DOI - PMC - PubMed
    1. Fontenot JD, Gavin MA, Rudensky AY. Foxp3 programs the development and function of CD4+CD25+ regulatory T cells. Nat Immunol. 2003;4(4):330–336. doi: 10.1038/ni904. - DOI - PubMed
    1. Hori S, Nomura T, Sakaguchi S. Control of regulatory T cell development by the transcription factor Foxp3. Science. 2003;299(5609):1057–1061. doi: 10.1126/science.1079490. - DOI - PubMed

Publication types

MeSH terms