. 2020 Jan 9;15(1):e0227505.
doi: 10.1371/journal.pone.0227505. eCollection 2020.

Transgenic interleukin 11 expression causes cross-tissue fibro-inflammation and an inflammatory bowel phenotype in mice

Affiliations

Transgenic interleukin 11 expression causes cross-tissue fibro-inflammation and an inflammatory bowel phenotype in mice

Wei-Wen Lim et al. PLoS One. .

Abstract

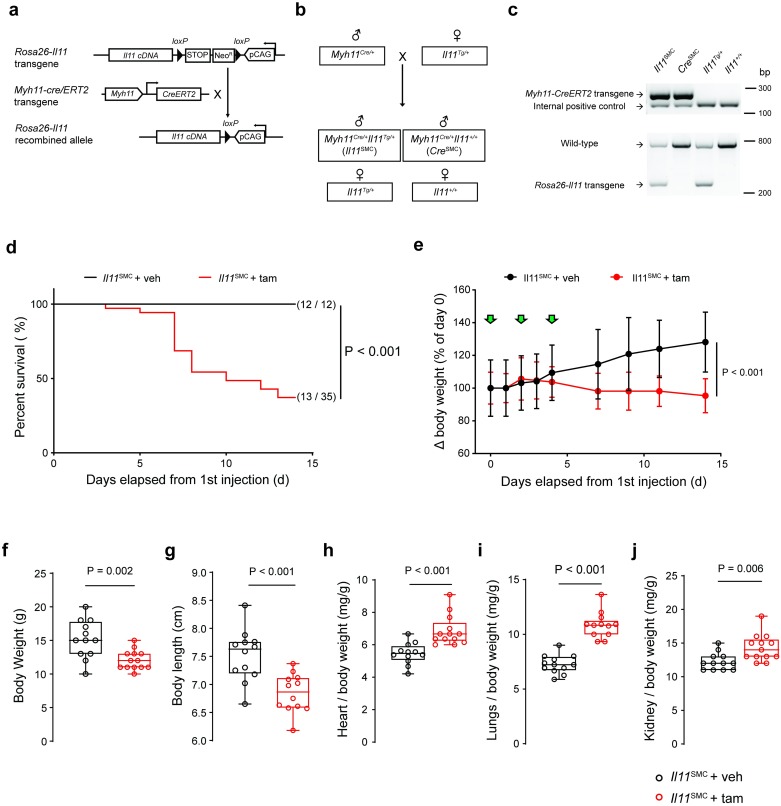
Interleukin 11 (IL11) is a profibrotic cytokine, secreted by myofibroblasts and damaged epithelial cells. Smooth muscle cells (SMCs) also secrete IL11 under pathological conditions and express the IL11 receptor. Here we examined the effects of SMC-specific, conditional expression of murine IL11 in a transgenic mouse (Il11SMC). Within days of transgene activation, Il11SMC mice developed loose stools and progressive bleeding and rectal prolapse, which was associated with a 65% mortality by two weeks. The bowel of Il11SMC mice was inflamed, fibrotic and had a thickened wall, which was accompanied by activation of ERK and STAT3. In other organs, including the heart, lung, liver, kidney and skin there was a phenotypic spectrum of fibro-inflammation, together with consistent ERK activation. To investigate further the importance of stromal-derived IL11 in the inflammatory bowel phenotype we used a second model with fibroblast-specific expression of IL11, the Il11Fib mouse. This additional model largely phenocopied the Il11SMC bowel phenotype. These data show that IL11 secretion from the stromal niche is sufficient to drive inflammatory bowel disease in mice. Given that IL11 expression in colonic stromal cells predicts anti-TNF therapy failure in patients with ulcerative colitis or Crohn's disease, we suggest IL11 as a therapeutic target for inflammatory bowel disease.


Conflict of interest statement

S.A.C. and S.S. are co-inventors of the patent applications ‘Treatment of fibrosis’ (WO/2017/103108). S.A.C., S.S., W.W.L. and B.N. are co-inventors of the patent application ‘Treatment of SMC mediated disease’ (WO/2019/073057). S.A.C. and S.S. are co-founders and shareholders of Enleofen Bio PTE LTD, a company (which S.A.C. is a director of) that develops anti-IL11 therapeutics. All other authors declare no competing interests.

Figures

Fig 1
Fig 1. Expression of Il11 in smooth muscle cells is associated with body weight loss, elevated organ weights and spontaneous death.
(a) Schematic diagram of the targeted expression of Il11 in Myh11+ve SMC. In Rosa26-Il11 mice, a floxed cassette containing both the neomycin (neo) resistance and stop elements is positioned before the murine Il11 transgene cassette, which undergoes tamoxifen (tam) initiated Cre-mediated recombination when crossed to the Myh11-Cre/ERT2 mouse. (b) Breeding scheme to generate Myh11Cre/+Rosa26Il11/+ (Il11SMC) and Myh11Cre/+Rosa26+/+ (CreSMC) offspring mice. Note that the Myh11-Cre gene is expressed on the Y chromosome and therefore only male offspring carry the transgene. (c) Genotyping of tail biopsy DNA. A 287 bp band indicates the presence of the Cre transgene whereas the 180 bp band determines the presence of the internal positive control (top gel). Polymerase chain reaction with the Rosa26-Il11 primer set detects a 270 bp band indicative of the Rosa26-Il11 transgene whereas the 727 bp band indicates the presence of the wild-type transgene (bottom gel). Uncropped blots are presented in S2 Fig. (d) Survival curve of Il11SMC mice treated with tam (n = 35) and corn oil vehicle (veh; n = 12) mice following tamoxifen initiation at day 0 and followed until day 14. Survival curves were compared using the log-rank Mantel-Cox test. (e) Body weight changes (expressed as percentage of day 0 body weight) in Il11SMC mice treated with tam or veh (n = 8 per group). Green arrows denote individual injections. Statistical analyses by two-way ANOVA with Sidak multiple comparisons; data expressed as mean ± standard deviation. (f) Collated body weights (left) and (g) body lengths (right) of Il11SMC mice treated with tam or veh measured at d14 post initial tamoxifen dose (n = 12–13 per group). (h) Organ weights of the heart, (i) lung and (j) kidney normalized to body weight in Il11SMC mice treated with tam or veh (n = 12–13 per group). All comparisons were conducted in mice 14 days post-veh and tam treatment. Statistical analyses by two-tailed unpaired t-test; data expressed as median ± IQR, whiskers represent the minimum and maximum values.
Fig 2
Fig 2. Il11 expression results in fibro-inflammatory disease of the colon.
(a) Representative images of the Il11SMC mice before (d0) and up to 7 days (d7) treatment with either corn oil vehicle (veh) or tamoxifen (tam). Presence of rectal prolapse are indicated with white arrows. Images represent the same animal across time points not taken to the same scale. (b) Excised gastrointestinal tract of representative Il11SMC mice at day 14 post-treatment with veh or tam. Scale bar represents 5 cm. (c) Fecal calprotectin in representative Il11SMC mice treated with veh or tam assessed by ELISA (n = 6–8 per group). (d) Representative cross-section and longitudinal section of the colon stained with Masson’s trichrome (left) and at 200X magnification (right). Scale bar of cross and longitudinal sections represents 500 μm and at 200X magnification represents 200 μm. (e) Colon fibrosis determined as a percentage of collagen positive area (blue) from histological images taken at 200X magnification (n = 6 per group). (f) Tunica muscularis (smooth muscle) thickness of the colon (n = 6 per group). (g) Total collagen content assessed by hydroxyproline assay and expressed as fold change (FC) of veh-treated Il11SMC mice (n = 10–11 per group). (h) Representative images of the colonic smooth muscle and crypts taken at 400X magnification for Masson’s trichrome and immunohistochemistry staining for IL11, cluster of differentiation 45 (CD45), lysosome-associated membrane protein 2 (LAMP2), and galectin-3 (LGALS3) (n = 3 per group). Black arrows denote focal staining of positive cells, white arrows denote myenteric plexus which are positive for IL11 and CD45 expression, and white arrowheads denotes leukocyte aggregation. Scale bars represent 100 μm. All comparisons were conducted in organs harvested from mice 14 days post-veh and tam treatment. Statistical analyses by two-tailed unpaired t-test; data expressed as median ± IQR, whiskers represent the minimum and maximum values.
Fig 3
Fig 3. Il11 expression in smooth muscle cells leads to lymphoid cell aggregates, villi distortion and ganglionic hyperplasia.
(a) Peyer’s patch of tam-treated Il11SMC mice showed increased expression of IL11, CD45, LAMP2 and LGALS3 compared to veh-treated controls. (b) Cross- and longitudinal sections of the mucosa region of the colon in tam-treated Il11SMC mice have inflammatory cell infiltrates that extend from the submucosa to the mucosa region resulting in distortion of villi architecture. (c) Ganglionic hyperplasia and fibrosis in the myenteric plexus of tam-treated Il11SMC mice compared to vehicle controls. White arrowheads denote ganglionic cells. Black boxes were imaged at 400X magnification. All scale bars represent 200 μm.
Fig 4
Fig 4. Il11SMC mice exhibit activated ERK1/2 signaling across organs.
Immunoblots of IL11 expression, phospho- (p) and total ERK1/2 and STAT3 protein in (a) colon, (b) heart, (c) liver, (d) lung, (e) kidney, (f) skin tissue of Il11SMC mice treated with vehicle (veh) or tamoxifen (tam) (n = 3 per group). Dotted boxes in the immunoblots represent the veh-treated (black) and tam-treated (red) groups for all organs. All comparisons were conducted in organs harvested from mice 14 days post-veh or tam treatment.
Fig 5
Fig 5. Il11 expression in smooth muscle cells causes fibrosis across organs.
(a) Representative Masson’s trichrome stained mid-ventricle sections of the heart harvested at 14 days post-vehicle (veh) or tamoxifen (tam) initiation (left) and 200X magnification images demonstrating perivascular fibrosis (right). Scale bars for mid-ventricle sections and 200X magnification denote 500 μm and 200 μm respectively. (b) Perivascular fibrosis quantification of histological images from veh- and tam-treated Il11SMC mice at 200X magnification (n = 6 per group). (c) Vascular hypertrophy quantification of veh- and tam-treated Il11SMC mice (n = 6 per group). (d) Total collagen content in the heart assessed by hydroxyproline assay and shown as fold change (FC) of veh- and tam-treated Il11SMC mice (n = 7–8 per group). (e) Representative Masson’s trichrome stained whole lung sections (left) and 200X magnification images (right). Scale bars for whole lung sections and 200X magnification denote 500 μm and 200 μm respectively. (f) Pulmonary fibrosis quantification as assessed by the Ashcroft score (n = 6–8 per group). (g) Total collagen content in the lung assessed by hydroxyproline assay as above (n = 7–8 per group). (h) Representative Masson’s trichrome stained liver sections taken at 400X magnification demonstrating perisinusoidal fibrosis. Scale bar at 400X magnification indicates 100 μm. (i) Fibrosis quantification of liver sections (400X magnification) from veh- and tam-treated Il11SMC mice (n = 6 per group). (j) Total collagen content in the liver assessed by hydroxyproline assay as above (n = 10–11 per group). (k) Representative Masson’s trichrome stained cross-section of the kidney (left) and 200X magnification images (right). Scale bars for the cross-section of the kidney and 200X magnification denote 500 μm and 200 μm respectively. (l) Fibrosis quantification of kidney sections (200X magnification) from veh- and tam-treated Il11SMC mice (n = 6 per group). (m) Total collagen content in the kidney assessed by hydroxyproline assay as above (n = 10–11 per group). (n) Representative Masson’s trichrome stained section of the dorsal skin at 100X magnification (left) and at 400X magnification (right). Scale bar at 100X and 400X magnification represents 200 μm and 100 μm respectively. (o) Dermal and (p) epidermal thickness of the dorsal skin. (q) Total collagen content in the skin assessed by hydroxyproline assay as above (n = 10–11 per group). All comparisons were conducted in organs harvested from mice 14 days post-veh and tam treatment. Statistical analyses by two-tailed unpaired t-test; data shown as median ± IQR, whiskers represent the minimum and maximum values.
Fig 6
Fig 6. Relative gene expression of fibrogenic genes in organs from tam-treated Il11SMC mice.
Relative mRNA expression of collagen type 1a1 (Col1a1), type 1a2 (Col1a2), type 3a1 (Col3a1), fibronectin-1 (Fn1), tissue inhibitor of metalloproteinase 1 (Timp1) and matrix metalloproteinase 2 (Mmp2) normalized to Glyceraldehyde 3-phosphate dehydrogenase (Gapdh) expression in the (a) colon, (b) heart, (c) lung, (d) liver, (e) kidney and (f) skin. All comparisons were conducted 14 days post-veh (black) and tam (red) initiated mice. Statistical analyses by two-tailed unpaired t-test; data expressed as median ± IQR, whiskers represent the minimum and maximum values.
Fig 7
Fig 7. Relative gene expression of inflammatory genes in organs from tam-treated Il11SMC mice.
Relative mRNA expression of interleukin 6 (Il6), C-C motif chemokine ligand 2 (Ccl2), C-C motif chemokine ligand 5 (Ccl5) normalized to Glyceraldehyde 3-phosphate dehydrogenase (Gapdh) expression in the (a) colon, (b) heart, (c) lung, (d) liver, (e) kidney and (f) skin respectively. All comparisons were conducted in 14 days post-veh (black) and tam (red) initiated mice. Statistical analyses by two-tailed unpaired t-test; data expressed as median ± IQR, whiskers represent the minimum and maximum values.
Fig 8
Fig 8. Mice with fibroblast-specific Il11 expression develop inflammatory bowel disease.
(a) Schematic diagram demonstrating tamoxifen (tam) injection procedure in 6-week-old Il11Fib and wildtype (control) littermates. (b) Excised gastrointestinal tract of representative Il11Fib mice at day 21 compared to controls. Scale bar represents 5 cm. (c) Indexed GIT length in reference to body length (BL) was unchanged in Il11Fib mice but (d) indexed colon length was markedly reduced as compared to controls (n = 4 per group). (e) Expression of inflammatory genes (Il6, Ccl2 and Ccl5) in the colon tissue of Il11Fib mice as compared to controls (n = 4–5 per group). (f) Fecal calprotectin in stool samples collected from Il11Fib and control mice (n = 4–5 per group) as assessed by ELISA. (g) Representative cross-sections of the colon of Il11Fib and control mice stained with Masson’s Trichrome (left) and at 200X magnification (right) (n = 6 biological replicates). Scale bars indicate 500 μm and 200 μm respectively. (h) Thickness of the smooth muscle layer (muscularis propria) in tam-treated Il11Fib mice compared to controls (n = 6 per group). All comparisons were conducted in 21 days post-tam initiation in control (black) and Il11Fib (green) mice. Statistical analyses by two-tailed unpaired t-test; data expressed as median ± IQR, whiskers represent the minimum and maximum values.

References

    1. Owens GK, Kumar MS, Wamhoff BR. Molecular Regulation of Vascular Smooth Muscle Cell Differentiation in Development and Disease. Physiological Reviews. 2004. pp. 767–801. 10.1152/physrev.00041.2003 - DOI - PubMed
    1. Johnson PR, Roth M, Tamm M, Hughes M, Ge Q, King G, et al. Airway smooth muscle cell proliferation is increased in asthma. Am J Respir Crit Care Med. 2001;164: 474–477. 10.1164/ajrccm.164.3.2010109 - DOI - PubMed
    1. Shea-Donohue T, Notari L, Sun R, Zhao A. Mechanisms of smooth muscle responses to inflammation. Neurogastroenterology & Motility. 2012. pp. 802–811. 10.1111/j.1365-2982.2012.01986.x - DOI - PMC - PubMed
    1. Herrick AL. Vascular function in systemic sclerosis. Current Opinion in Rheumatology. 2000. pp. 527–533. 10.1097/00002281-200011000-00009 - DOI - PubMed
    1. Shin JY, Beckett JD, Bagirzadeh R, Creamer TJ, Shah AA, McMahan Z, et al. Epigenetic activation and memory at a TGFB2 enhancer in systemic sclerosis. Science Translational Medicine. 2019. p. eaaw0790. 10.1126/scitranslmed.aaw0790 - DOI - PMC - PubMed

Publication types