. 2020 Feb;25(2):124-138.
doi: 10.1111/gtc.12746. Epub 2020 Feb 5.

Involvement of Rev1 in alkylating agent-induced loss of heterozygosity in Oryzias latipes

Affiliations

Involvement of Rev1 in alkylating agent-induced loss of heterozygosity in Oryzias latipes

Yoshihiro Fujikawa et al. Genes Cells. 2020 Feb.

Abstract

Translesion synthesis (TLS) polymerases mediate DNA damage bypass during replication. The TLS polymerase Rev1 has two important functions in the TLS pathway, including dCMP transferase activity and acting as a scaffolding protein for other TLS polymerases at the C-terminus. Because of the former activity, Rev1 bypasses apurinic/apyrimidinic sites by incorporating dCMP, whereas the latter activity mediates assembly of multipolymerase complexes at the DNA lesions. We generated rev1 mutants lacking each of these two activities in Oryzias latipes (medaka) fish and analyzed cytotoxicity and mutagenicity in response to the alkylating agent diethylnitrosamine (DENA). Mutant lacking the C-terminus was highly sensitive to DENA cytotoxicity, whereas mutant with reduced dCMP transferase activity was slightly sensitive to DENA cytotoxicity, but exhibited a higher tumorigenic rate than wild-type fish. There was no significant difference in the frequency of DENA-induced mutations between mutant with reduced dCMP transferase activity and wild-type cultured cell. However, loss of heterozygosity (LOH) occurred frequently in cells with reduced dCMP transferase activity. LOH is a common genetic event in many cancer types and plays an important role on carcinogenesis. To our knowledge, this is the first report to identify the involvement of the catalytic activity of Rev1 in suppression of LOH.

Keywords: DNA damage; DNA polymerase; alkylating agent; chemical mutagenesis; loss of heterozygosity; mutagenesis; translesion synthesis.


Conflict of interest statement

The authors declare no competing financial interests.

Figures

Figure 1
Figure 1
Mutations identified in the rev1 gene. (a) Protein structure of Rev1 and mutations changing the coding region of the rev1 gene. Amino acid changes are indicated by arrows above the structure. (b) Alignment of the amino acid sequence of the N‐digit domain from several organisms. Corresponding sequences for Saccharomyces cerevisiae (Sc), Drosophila melanogaster (Dm), Danio rerio (Dr), Galus galus (Gg), Mus musculus (Mm), Homo sapiens (Hs) and Oryzias latipes (Ol) Rev1 are shown. The SRLH motif is highlighted with a black box, and the identified amino acid substitutions in medaka mutants are indicated by red characters. (c) dCMP transferase activity of mutant Rev1. Nucleotides were inserted opposite of template AP sites by purified wild‐type and mutant Rev1. The upper panel represents the schematic illustration of wild‐type and mutant Rev1. The lower panel represents the sequences of the primers and the damage‐containing template. X indicates the position of AP site analogue. A weak one base insertion band was detected in the R530X lane, which might be contamination of Escherichia coli‐derived polymerase activity in the cell extract
Figure 2
Figure 2
Survival curve of wild‐type and mutant cells after UV irradiation or DENA exposure. Survival of cultured cells in response to (a) UV radiation or (b) DENA exposure was determined by a colony formation assay. For the L980X mutant, to avoid the effect of RNA degradation by non‐sense‐mediated mRNA decay (Baker & Parker, 2004), cultured cells derived from transgenic medaka, in which the BAC carrying the L980X mutation in the rev1 gene was introduced into the R530X mutant, were used. The mean and standard deviation (SD) of three independent experiments are shown. For UV irradiation, wild versus L980X‐Tg or R530X were significant (p < .01), and wild versus H489N is significant at the dose of 7 J/m2 (p < .01), but not significant at 10 J/m2. For DENA treatment, wild versus L980X‐Tg or R530X were significant (p < .01), but wild versus H489N were not significant. Dunnett's test was used
Figure 3
Figure 3
DENA sensitivity of medaka fish. (a) Life spans of wild‐type and mutant fish, as represented by a Kaplan–Meier survival curve. Wild type (n = 50), R530X (n = 51), L980X (n = 59) and H489N (n = 51). Time is shown as days after fertilization. Wild versus R530X or L980X were significant (p < .01), but wild versus H489N is not significant. Generalized Wilcoxon test was used. (b) Kaplan–Meier survival curves of wild‐type (n = 29), R530X (n = 35), L980X (n = 29), H489N (n = 29), Wild‐Tg (n = 18), H489N‐Tg (n = 30) and L980X‐Tg (n = 30) fish after 60 ppm DENA exposure for 2 weeks. Time is shown as days post‐DENA treatment. Wild versus R530X, L980X, L980X‐Tg or H489N‐Tg, and R530X versus H489N‐Tg were significant (p < .001), but wild versus H489N or Wild‐Tg were not significant. Generalized Wilcoxon test was used. (c) Representative images of livers stained with hematoxylin and eosin. Left images are from control untreated fish, and right images are from DENA‐treated fish (H489N, 60 ppm for two weeks). Magnified images of the boundary region between normal tissue and tumor tissue in livers from DENA‐treated fish (lower right) and the similar region in livers from control fish (lower left) are shown. (d) Incidence of liver tumors in wild and mutant fish 4 months post‐DENA treatment. The bar for each genotype consists of three categories: “tumor‐bearing” (filled with black, green or halftone green), “tumor free” (blank) and “unknown” (gray). As individual fish died before the fourth month of post‐DENA treatment have not been checked for liver tumor, these individuals were categorized as “unknown.” Untreated control fish: wild (n = 19), R530X (n = 24), L980X (n = 25), H489N (n = 29), wild‐Tg (n = 16), L980X‐Tg (n = 23) and H489N‐Tg (n = 30). DENA‐treated fish: wild (n = 29), R530X (n = 36), L980X (n = 36), H489N (n = 30), wild‐Tg (n = 17), L980X‐Tg (n = 30) and H489N‐Tg (n = 30). For H489N fish untreated control (0 ppm) versus DENA‐treated (60 ppm; *p < .001), and for DENA‐treated fish wild versus H489N (**p = .0021) and H489N versus H489N‐Tg (***p = .01) were significant, but for wild fish 0 ppm versus 60 ppm and for DENA‐treated fish wild versus wild‐Tg or H489N‐Tg were not significant. These statistical processes were carried out excluding “unknown.” Chi‐squared test was used. The numbers of male and female fish used or survived at the end of observation are summarized in Table S2
Figure 4
Figure 4
Frequency, spectrum and chromosomal localization of DENA‐induced mutations. (a) Distribution of the identified mutations, lined up along the left arm of chromosome 19. Cells of each genotype were treated with DENA at a dose yielding 2%–5% survival (for the wild type 6,000 ppm for 12 hr and for H489N 3,000 ppm for 12 hr), and genomic DNA was extracted from single colonies. The left arm of chromosome 19 was enriched with synthesized RNA bait and subjected to NGS. Sequencing was conducted for six colonies. The top panel indicates chromosomal location of the RNA bait (green). The lower two panels indicate the chromosomal locations of the identified mutations in wild‐type and H489N cells. In each panel, the lower six lines indicate the positions of identified mutations. The top line indicates the sum of identified mutations. Mutation frequencies are indicated to the right of each line. (b) Mutational signatures of DENA‐induced mutations. Frequencies of substitution mutations in each genotype are shown. The profiles are displayed using the 96‐substitution classification, which is defined by reporting the specific base substitution combined with the immediate neighboring 5′ and 3′ nucleotides
Figure 5
Figure 5
Chromosomal distribution of mutations and LOH. (a) Proportion of mutant alleles lined up along the left arm of chromosome 19. For each mutation identified by NGS, the value obtained by dividing the number of mutant allele reads by that of the total reads was mapped on the left arm of chromosome 19. Values obtained from each individual colony are distinguished by a different color. The vertical axis represents the value of mutant allele reads/total reads, and the horizontal axis represents the number of bases from the top of chromosome 19. Pale yellow bars indicate the regions including the location where the peak calling value of mutant alleles was lower than that of normal alleles. (b) Distribution of LOH on the left arm of chromosome 19. A colony with a most drastic “mutant allele proportion” fluctuation pattern was selected from 6 clones in each genotype (wild type: Clone2 and H489N: Clone1), and 21 or 24 independent subcolonies were recovered by reseeding cryopreserved cells. Mutations present in each subclone were identified for 33 or 34 chromosomal positions by capillary sequencing (Figure S5). Several positions in each subclone were homozygous for mutant or normal allele, and the positions were defined as LOH. Each subclone could be divided into several LOH patterns, and these LOH patterns are shown. The patterns included homozygous for mutant allele (black square) and normal alleles (white circle). The rate of clones having the distribution pattern of the corresponding LOH is indicated at the left of each bar
Figure 6
Figure 6
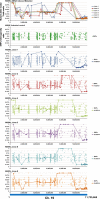
Variation of SNPs in each H489N clone. Fluctuations of the heterogeneity ratio of SNPs in each clone are shown. SNPs were defined as the positions in which the base calling by NGS was heterogeneous in untreated control cells. For each SNP, the heterogeneity ratio was calculated in each clone and mapped on chromosome 19. Top panel: chromosomal distribution of the proportion of mutant alleles in each H489N clone (as shown in Figure 5a). Each dot represents the value of number of mutant allele reads/number of total reads. They are mapped on chromosome 19 and connected by a line. Second panel: chromosomal distribution of SNPs detected in untreated control cells. The vertical axis indicates the heterogeneity ratio of each SNP. Lower six panels: chromosomal distribution of heterogeneity ratio of each SNP in each clone. The darker color symbols connected by a line indicate the identified mutations, and the lighter color symbols indicate the SNPs. The vertical axis indicates both the value of number of mutant allele reads/number of total reads for induced mutations and the heterogeneity ratio of SNP
Figure 7
Figure 7
mgmt expression in cultured cells and somatic tissues. Reverse transcription and quantitative PCR were conducted using RNA isolated from cultured cells (wild, R530X or H489N) or wild‐type tissues (liver, intestine, eye, tail or brain). The mean and standard deviation (SD) of three assays using three different samples are shown
Figure 8
Figure 8
LOH induction model. Proposed LOH induction model is shown. Step1: DENA generate alkylated base in genome DNA, Step2: mutations are induced at the opposite of O6etG, Step3: induced mutations are fixed subsequent replication, Step4: AP site are generated at the remaining 7etG by spontaneous depurination during subsequent several rounds of cell division and Step5: LOH are induced at some AP site

Similar articles

Cited by

References

    1. Alexandrov, L. B. , Nik‐Zainal, S. , Wedge, D. C. , Aparicio, S. A. J. R. , Behjati, S. , Biankin, A. V. , … Stratton, M. R. (2013). Signatures of mutational processes in human cancer. Nature, 500, 415–421. 10.1038/nature12477 - DOI - PMC - PubMed
    1. Auerbach, P. , Bennett, R. A. , Bailey, E. A. , Krokan, H. E. , & Demple, B. (2005). Mutagenic specificity of endogenously generated abasic sites in Saccharomyces cerevisiae chromosomal DNA. Proceedings of the National Academy of Sciences of the United States of America, 102, 17711–17716. 10.1073/pnas.0504643102 - DOI - PMC - PubMed
    1. Baker, K. E. , & Parker, R. (2004). Nonsense‐mediated mRNA decay: Terminating erroneous gene expression. Current Opinion in Cell Biology, 16, 293–299. 10.1016/j.ceb.2004.03.003 - DOI - PubMed
    1. Brown‐Peterson, N. J. , Krol, R. M. , Zhu, Y. L. , & Hawkins, W. E. (1999). N‐nitrosodiethylamine initiation of carcinogenesis in Japanese medaka (Oryzias latipes): Hepatocellular proliferation, toxicity, and neoplastic lesions resulting from short term, low level exposure. Toxicological Sciences, 50, 186–194. 10.1093/toxsci/50.2.186 - DOI - PubMed
    1. Bubenshchikova, E. , Ju, B. , Pristyazhnyuk, I. , Niwa, K. , Kaftanovskaya, E. , Kinoshita, M. , … Wakamatsu, Y. (2005). Generation of fertile and diploid fish, medaka (Oryzias latipes), from nuclear transplantation of blastula and four‐somite‐stage embryonic cells into nonenucleated unfertilized eggs. Cloning and Stem Cells, 7, 255–264. - PubMed

Substances