. 2020 Feb 11;16(2):1249-1262.
doi: 10.1021/acs.jctc.9b01071. Epub 2020 Jan 24.

Properties of Aqueous Trehalose Mixtures: Glass Transition and Hydrogen Bonding

Affiliations

Properties of Aqueous Trehalose Mixtures: Glass Transition and Hydrogen Bonding

Gil I Olgenblum et al. J Chem Theory Comput. .

Abstract

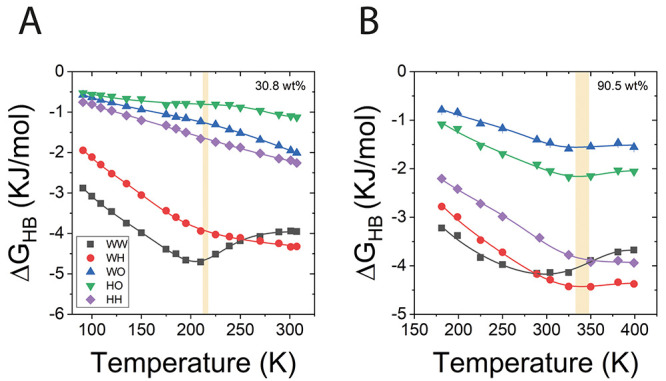
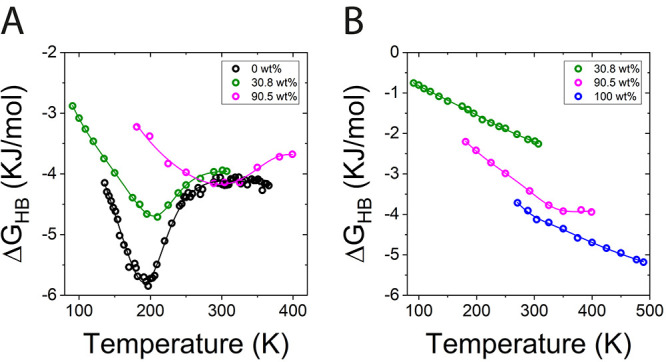
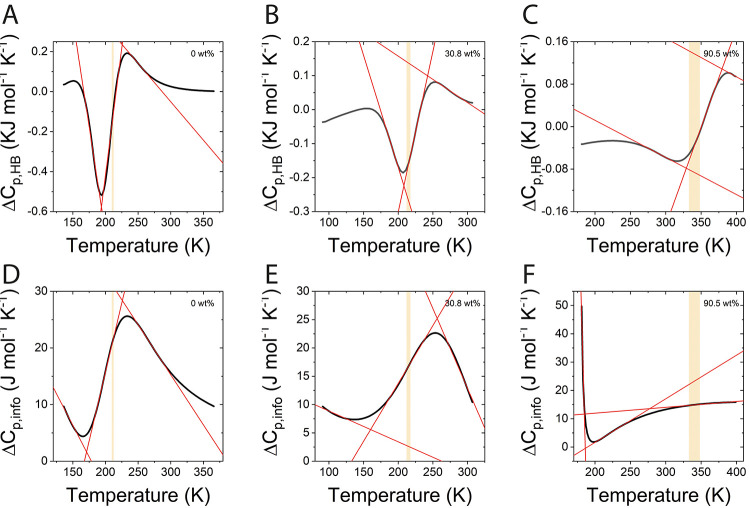
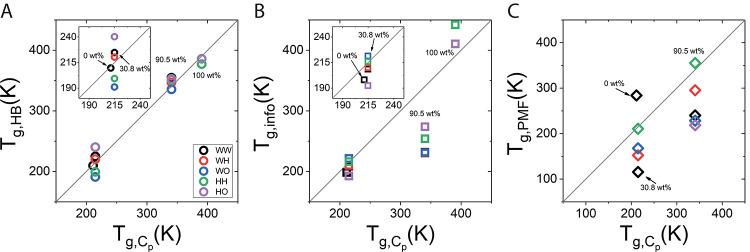
Trehalose is a naturally occurring disaccharide known to remarkably stabilize biomacromolecules in the biologically active state. The stabilizing effect is typically observed over a large concentration range and affects many macromolecules including proteins, lipids, and DNA. Of special interest is the transition from aqueous solution to the dense and highly concentrated glassy state of trehalose that has been implicated in bioadaptation of different organisms toward desiccation stress. Although several mechanisms have been suggested to link the structure of the low water content glass with its action as an exceptional stabilizer, studies are ongoing to resolve which are most pertinent. Specifically, the role that hydrogen bonding plays in the formation of the glass is not well resolved. Here we model aqueous trehalose mixtures over a wide concentration range, using molecular dynamics simulations with two available force fields. Both force fields indicate glass transition temperatures and osmotic pressures that are close to experimental values, particularly at high trehalose contents. We develop and employ a methodology that allows us to analyze the thermodynamics of hydrogen bonds in simulations at different water contents and temperatures. Remarkably, this analysis is able to link the liquid to glass transition with changes in hydrogen bond characteristics. Most notably, the onset of the glassy state can be quantitatively related to the transition from weakly to strongly correlated hydrogen bonds. Our findings should help resolve the properties of the glass and the mechanisms of its formation in the presence of added macromolecules.


Conflict of interest statement

The authors declare no competing financial interest.

Figures

Figure 1
Figure 1
Structure of binary trehalose–water mixtures, in solution and in the glassy state. (A) Schematic structure of α,α-trehalose, denoting the eight hydroxyl groups and three etheric oxygens. (B) Comparison of radial distribution functions (RDF) g(r) derived from C36 and LME force fields, shown for trehalose–trehalose (TT), trehalose–water (TW), and water–water (WW) correlations, at high trehalose content (94.7 wt %) and at 298 K. (C) Same plots as part B shown for lower trehalose content (30.8 wt %, 1.3 molal). (D) Pair distribution function (r) for pure trehalose in the crystalline and glassy states of 100 wt % trehalose, derived from simulations and from experimentally reported data. Data sets are shifted for clarity. (E and F) Simulated radial distribution function g(r) compared to X-ray guided EPSR simulation-derived function, as reported in ref (62), shown for TW correlations at two concentrations.
Figure 2
Figure 2
Spatial distribution function (SDF) of the same mixtures as in Figure 1B,C. (A) C36, 30.8 wt % showing the water iso-surface (blue), i.e., particle number density iso-surface of water molecules around trehalose reference atom. (B) Same as in part A but in addition also showing the trehalose iso-surface (orange). (C) C36 for 94.7 wt % and water iso-surface. (D) Same as in part C but in addition also showing the trehalose surface. (E–H) The same as in parts A–D for LME. For 30.8 wt % water surfaces (A, B, E, F) the iso-value is 3.5 nm–3, while trehalose surface iso-value is 0.78 nm–3 for C36 (B) and 0.7 nm–3 for LME (F). For 94.7 wt % water surfaces (C, D, G, H), the iso-value is 4.52 nm–3 and for trehalose (D and H) 2.70 nm–3. See Figure S3 for comparison of parts B and F with the same iso-value.
Figure 3
Figure 3
Osmotic pressure in simulations and experiments. (left) Kirkwood–Buff integrals for the pairwise interactions in aqueous trehalose solution as a function of concentration. Light circles represent C36, dark circles represent LME, the orange line is data calculated from van ’t Hoff’s law (ideal solution), the black line indicates the experimental result, derived by Kirkwood−Buff inversion (see section S3 in the Supporting Information). (right) Osmotic pressure calculated for both LME (blue) and C36 (black) force fields from 0 wt % to the most concentrated mixture with experimental data available, 97.1 wt %. The experimental values are from Poplinger et al. (green circles) and Simperler et al. (red circles). The orange bar presents the range in which a glass transition occurs at room temperature, estimated from our heat capacity data (see text for details). The inset zooms in on the solution regime up to the saturation limit (∼1.6 molal).
Figure 4
Figure 4
Methods for determining of the glass transition temperature in simulations and experiments. Top row: (A) Heat capacity derived at different temperatures during the heating cycle (details in Figure S1), calculated for 100 wt % (left panel), and derived experimentally using DSC by Ding et al. (right panel, in green). (B) Thermal expansion coefficient at different temperatures for 90.5 wt %, during the heating cycle. (C) The natural logarithm of the diffusion coefficient for 94.7 wt %, during the cooling cycle. Full circles are for water diffusion and empty circles are for trehalose diffusion. Bottom row: Temperature of glass transition, Tg, derived by (D) heat capacity, (E) thermal expansion coefficient, and (F) diffusion coefficient. In all panels, blue is for LME and black is for C36. Experimental data reproduced from refs (, ,, , and 75).
Figure 5
Figure 5
Free energy of hydrogen bonds versus temperature for all interaction pairs: water–water (WW), water–trehalose hydroxide (WH), water–trehalose etheric oxygen (WO), trehalose hydroxide–trehalose hydroxide (HH), and trehalose hydroxide–trehalose etheric oxygen (HO). For two representative concentrations: (A) trehalose content of 30.8 wt % and (B) trehalose content of 90.5 wt %. The lines are fitted as described in section S5 and eq S13 in the Supporting Information, and the shaded bar represents the range of Tg, Cp from Figure 4D.
Figure 6
Figure 6
Trehalose concentration effect on hydrogen bonding interactions: (A) water–water (WW) Hbond free energy versus temperature and (B) sugar hydroxyl–sugar hydroxyl (HH) Hbond free energy versus temperature.
Figure 7
Figure 7
Heat capacity from hydrogen bonding free energies (top) and information entropies (bottom) for different concentrations, calculated from WW ΔGHB: (A and D) 0 wt %, (B and E) 30.8 wt %, and (C and F) 90.5 wt %. The shaded bars are as described in the caption of Figure 5.
Figure 8
Figure 8
Correlation plot of glass transition temperature, Tg, based on Hbonds, information entropy, and PMFHB analysis to those calculated from the heat capacity method (see Figure 4D). (A) Glass transition temperature calculated from the Hbond free energy Tg, HB. (B) Glass transition temperature calculated from information entropy, Tg, info. (C) Same as parts A and B calculated from PMFHB, Tg, PMF. All Tg values (HB, info, and PMFHB) are extracted from the appropriate heat capacity. Data corresponds to 0, 30.8, 90.5, and 100 wt % trehalose. Concentrations are indicated in each panel and insets zoom in on 0 and 30.8 wt %.

References

    1. Hochachka P. W.; Somero G. N.. Biochemical Adaptation: Mechanisms and Process in Physiology Evolution; Oxford: New York, 2002; pp 217–289.
    1. Elbein A. D. The Metabolism of α,α-Trehalose. Adv. Carbohydr. Chem. Biochem. 1974, 30, 227–256. 10.1016/S0065-2318(08)60266-8. - DOI - PubMed
    1. Politi R.; Harries D. Enthalpically Driven Peptide Stabilization by Protective Osmolytes. Chem. Commun. 2010, 46 (35), 6449–6451. 10.1039/c0cc01763a. - DOI - PubMed
    1. Kaushik J. K.; Bhat R. Why Is Trehalose an Exceptional Protein Stabilizer?. J. Biol. Chem. 2003, 278 (29), 26458–26465. 10.1074/jbc.M300815200. - DOI - PubMed
    1. Jain N. K.; Roy I. Effect of Trehalose on Protein Structure. Protein Sci. 2008, 18, 24–36. 10.1002/pro.3. - DOI - PMC - PubMed

LinkOut - more resources