. 2020 Feb:30:101425.
doi: 10.1016/j.redox.2019.101425. Epub 2020 Jan 2.

Transcription factor NRF2 uses the Hippo pathway effector TAZ to induce tumorigenesis in glioblastomas

Affiliations

Transcription factor NRF2 uses the Hippo pathway effector TAZ to induce tumorigenesis in glioblastomas

Maribel Escoll et al. Redox Biol. 2020 Feb.

Abstract

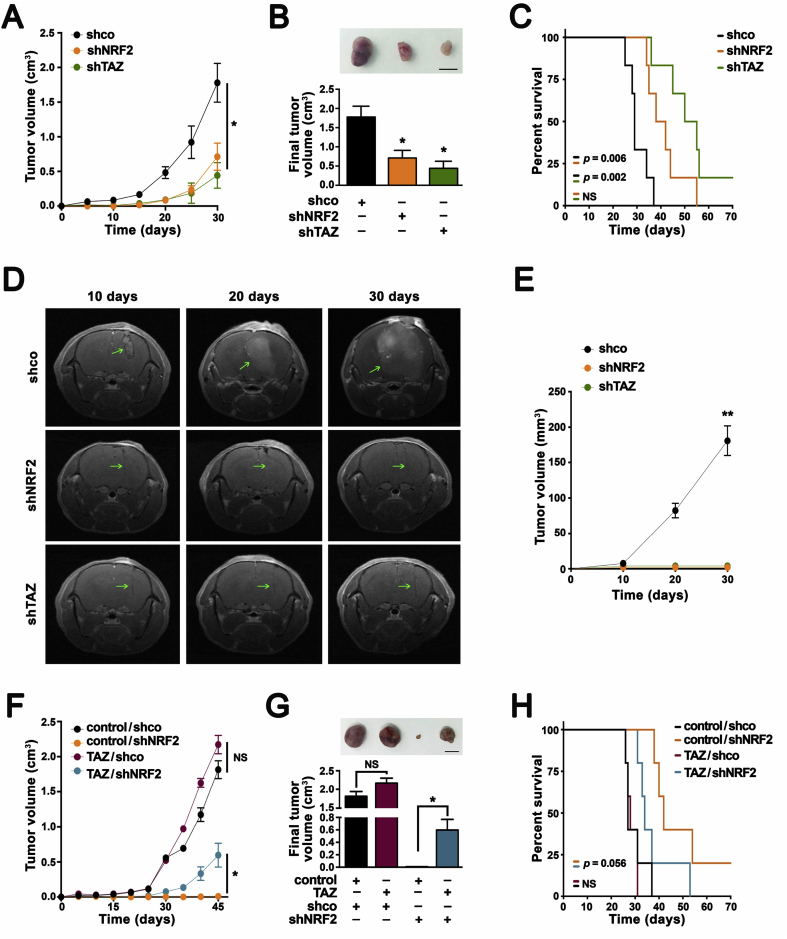
Transcription factor NRF2 orchestrates a cellular defense against oxidative stress and, so far, has been involved in tumor progression by providing a metabolic adaptation to tumorigenic demands and resistance to chemotherapeutics. In this study, we discover that NRF2 also propels tumorigenesis in gliomas and glioblastomas by inducing the expression of the transcriptional co-activator TAZ, a protein of the Hippo signaling pathway that promotes tumor growth. The expression of the genes encoding NRF2 (NFE2L2) and TAZ (WWTR1) showed a positive correlation in 721 gliomas from The Cancer Genome Atlas database. Moreover, NRF2 and TAZ protein levels also correlated in immunohistochemical tissue arrays of glioblastomas. Genetic knock-down of NRF2 decreased, while NRF2 overexpression or chemical activation with sulforaphane, increased TAZ transcript and protein levels. Mechanistically, we identified several NRF2-regulated functional enhancers in the regulatory region of WWTR1. The relevance of the new NRF2/TAZ axis in tumorigenesis was demonstrated in subcutaneous and intracranial grafts. Thus, intracranial inoculation of NRF2-depleted glioma stem cells did not develop tumors as determined by magnetic resonance imaging. Forced TAZ overexpression partly rescued both stem cell growth in neurospheres and tumorigenicity. Hence, NRF2 not only enables tumor cells to be competent to proliferate but it also propels tumorigenesis by activating the TAZ-mediated Hippo transcriptional program.

Keywords: Cancer stem cells; Chemotherapy; Glioblastoma; Oxidative stress.


Conflict of interest statement

Declaration of competing interest The authors declare no competing interests.

Figures

Image 1
Graphical abstract
Fig. 1
Fig. 1
Analysis of NFE2L2 and WWTR1 expression in GBs. (AE) Analysis of NFE2L2 and WWTR1 expression in 721 gliomas from the TCGA database. (A) Analysis of somatic mutations in genes of the Hippo pathway, KEAP1 and NFE2L2. (B) Analysis of the most frequent somatic mutations in gliomas (LGGs and GBs) grouped into high or low levels of NFE2L2 compared to high or low levels of WWTR1. Statistical analysis was performed with Chi-square test for trend and p-value associated as indicated. (C)NFE2L2 and WWTR1 mRNAs are increased in GBs compared to LGGs. p-values for differences between groups are indicated in each graph and calculated using Student's t-test. (D) Scatter plot showing positive correlation between NFE2L2 and WWTR1 expression. The Pearson correlation coefficient (R) and the p-value associated with this coefficient are indicated. (E) Kaplan-Meier survival curves of patients with gliomas. Patients were stratified in two groups using NFE2L2 or WWTR1 Z-score values. Statistically significant differences in survival between groups were calculated using the log-rank test. (F– H) NRF2 and TAZ protein levels are positively correlated in GBs. A tissue array of 26 glioblastomas was analyzed. (F) Sections of three representative tumors with antibodies against NRF2, TAZ and NQO1 (scale bar, 50 μm). (G, H) Scatter plot showing positive correlation between densitometric quantification of DAB-staining (as percentage of area) of NRF2 and TAZ (G) or NRF2 and NQO1 (H). The Pearson correlation coefficient (R) and the p-value associated with this coefficient are indicated. See also Supplementary Fig. S1.
Fig. 2
Fig. 2
NRF2 knocked-down cells exhibit decreased TAZ levels. (A, B) Four human glioblastoma explants (GB1, GB2, GB3 and GB4) were transduced with a lentivirus encoding control shRNA (shco) or human shNRF2. (A) mRNA levels of NFE2L2 and WWTR1 were determined by qRT-PCR and normalized by GAPDH. Data are mean ± S.D. (n = 3). Statistical analysis was performed with the Student's t-test. **p ≤ 0.01. (B) Representative immunoblots of NRF2, TAZ, NQO1, p-MST, MST, pLATS, LATS and GAPDH and LaminB as loading controls (n = 3). (C, D), U-373 MG and (E, F) U-87 MG glioblastomas cell lines were transduced with lentiviral vectors containing shcontrol (shco), human shNRF2 or human shTAZ. (C, E) mRNA levels of NFE2L2, NQO1, WWTR1, BIRC5, CTGF and CD44 were determined by qRT-PCR and normalized by GAPDH. Data are mean ± S.D. (n = 3). Statistical analysis was performed with the Student's t-test. **p ≤ 0.01; (NS, indicated not statistically significant). (D, F) Representative immunoblot analysis of NRF2, TAZ, NQO1 and GAPDH and LaminB as loading controls (n = 4). Similar results were obtained with a different shNRF2 (Supplementary Fig. S2).
Fig. 3
Fig. 3
Genetic and pharmacological up-regulation of NRF2 increases TAZ levels. (A, B) GB1 and GB3 glioblastoma cells were transduced with empty vector or lentiviral vector for overexpression of NRF2. (A) Representative immunoblot analysis of NRF2, TAZ, NQO1 and GAPDH as a loading control (n = 3). (B) Messenger RNA (mRNA) levels of WWTR1 were determined by qRT-PCR and normalized by GAPDH. Data are presented as mean ± S.D. (n = 3) **p ≤ 0.01 according to a Student's t-test. (C) Representative immunoblots of NRF2, TAZ, GAPDH and LaminB as loading controls in ReNcell, GB1 and GB3. (D, E) ReNcell were transduced with empty vector or lentiviral vector for overexpression of NRF2. (D) Representative immunoblots of NRF2, TAZ, NQO1, CTGF, p-MST, MST, pLATS, LATS and GAPDH as a loading control (n = 3). (E) Messenger RNA (mRNA) levels of NQO1, WWTR1 and CTGF were determined by qRT-PCR and normalized by GAPDH. Data are presented as mean ± S.D. (n = 3) **p ≤ 0.01 according to a Student's t-test. (F– H) ReNcell cells were treated with sulforaphane (SFN) (15 μM) for the indicated times. (F) Representative immunoblots of NRF2, TAZ, NQO1, CTGF, GAPDH and LaminB as loading controls (n = 3). (G) Densitometric quantification of TAZ levels representative blots from (F) relative to GAPDH and LaminB levels. Data are mean ± S.D. (n = 3) *p ≤ 0.05 according to a Student's t-test. (H) Messenger RNA (mRNA) levels of NQO1, WWTR1 and CTGF were determined by qRT-PCR and normalized by GAPDH. Data are presented as mean ± S.D. (n = 3) **p ≤ 0.01 according to a Student's t-test. The blue area represents the wave of NRF2 dependent transcription and the green area depicts a second wave that involves NRF2 and also TAZ-dependent transcription. The time for transition from one wave to the other is was chosen as a possible suggestion. See also Supplementary Fig. S3. (For interpretation of the references to colour in this figure legend, the reader is referred to the Web version of this article.)
Fig. 4
Fig. 4
The regulation of WWTR1 by NRF2 is not dependent of the redox state. (A) U-87 MG and U-373 MG glioblastoma cells and four human glioblastoma explants (GB1, GB2, GB3 and GB4) were transduced with lentiviral vectors containing shcontrol (shco) or human shNRF2 and changes in intracellular ROS were determined by HE staining (n = 3). (BD) U-87 MG glioblastoma cells were transduced with lentiviral vectors containing shco or human shNRF2 and treated with GSH-MEE (10 mM, 16 h). (B, C) Flow cytometry analysis of shNRF2-induced intracellular ROS production in HE stained cells. A representative sample of 10,000 cells is shown for each condition. (D) Representative immunoblots of NRF2, TAZ and GAPDH as a loading control (n = 3).
Fig. 5
Fig. 5
The WWTR1 promoter has functional NRF2-binding sites. (A) Representative scheme of the gene WWTR1 encoding TAZ. Regions enriched in acetylated histone H3 lysine 27 (H3K27ac) are shown in blue and regions sensitive to DNase are represented as dark boxes. Experimental sequences reported to bind MAFK, MAFF and BACH1 factors were analyzed for the presence of AREs (ARE 1–9). (B, C) ChIP analysis of putative AREs found in (A) using the anti-NRF2 antibody vs. a control IgG in glioblastoma explant cells GB1 (B) and GB3 (C). (D) Luciferase reporter constructs used for assessment of ARE2, ARE2 mutated, ARE5, ARE6, ARE8 or ARE9 functionality in pGL3basic vector. (E) U-87 MG glioblastomas cell lines were transduced with lentiviral vectors containing shco and human shNRF2 and transfected with ARE2, ARE2 mutated, ARE5, ARE6, ARE8 or ARE9. Luciferase activity was measured 24 h after transfection. Luciferase activities were normalized to renilla activity. Results are shown relative to control and are mean ± S.D. (n = 3). **p ≤ 0.01 according to a Student's t-test. See also Supplementary Table S1, Table S3, Table S4, Supplementary Fig. S4 and Fig. S5. (For interpretation of the references to colour in this figure legend, the reader is referred to the Web version of this article.)
Fig. 6
Fig. 6
Ectopic expression of TAZ rescues neurosphere growth of NRF2-knocked-down glioma stem cells GB1 (AC) and GB3 (DF) cells were transduced with lentivirus encoding shco, human shNRF2 or human shTAZ. (A, D) Representative immunoblot analysis of NRF2, TAZ and GAPDH as a loading control (n = 3). (B, E) Representative images of tumor neurosphere formation. Scale bar, 100 μm. (C, F) Quantification of the number of secondary neurospheres or the number of cells represented as percentage relative to shco. Data presented mean ± S.D. (n = 3) **p ≤ 0.01 according to a Student's t-test. GB1 (GI) and GB3 (J–L) cells were transduced with empty retrovirus as control or a retrovirus expressing TAZ, and then with a lentivirus expressing shco or shNRF2. (G, J) Representative immunoblot analysis of NRF2, TAZ and GAPDH as a loading control (n = 3). (H, K) Representative images of tumor neurosphere formation. Scale bar, 100 μm. (I, L) Quantification of the number of secondary neurospheres and the number of cells represented as a percentage relative to control-shco. Data are presented as mean ± S.D. (n = 3) **p ≤ 0.01 according to a Student's t-test. See also Supplementary Fig. S6 and Supplementary Table S5.
Fig. 7
Fig. 7
The NRF2/TAZ axis is essential for tumorigenesis of GBs. (A, B) U-87 MG glioblastoma cells were transduced with a lentivirus encoding shco, human shNRF2 or human shTAZ and implanted subcutaneously in athymic mice. (A) Growth curves of xenograft tumors. Data are presented as mean ± S.E.M. (n = 4). *p ≤ 0.05 according to a Student's t-test. (B) Upper panel, representative tumors of each experimental condition at the end point (scale bar, 1 cm); lower graph, quantification of the final tumor volume. Data are presented as mean ± S.E.M. (n = 4). *p ≤ 0.05 according to a Student's t-test. (C) Kaplan-Meier survival curves of mice orthotopically implanted in the brain. Log-rank test between shco and shNRF2 is indicated (n = 6). (D, E) GB3 glioblastoma explant cells were transduced with a lentivirus encoding shco, human shNRF2 or human shTAZ and orthotopically implanted in the brain in athymic mice. (D) Representative image of T1 MRI of each experimental condition after 10, 20 and 30 days post-surgery. Green arrows indicate the tumor in shco or the injection scar in shNRF2 or shTAZ. (E) Growth curves of brain tumors. Data are presented as mean ± S.E.M. (n = 6) **p ≤ 0.01 according to a Student's t-test. (F, G) U-87 MG cells were transduced with empty retrovirus or a retrovirus expressing TAZ and then with lentivirus encoding shco or shNRF2 and implanted subcutaneously in athymic mice. (F) Growth curves of xenograft tumors. Data are presented as mean ± S.E.M. (n = 4). *p ≤ 0.05 according to a Student's t-test. (G) Upper panel, representative tumors of each experimental condition at the end point (scale bar, 1 cm); lower graph, quantification of the final tumor volume. Data are presented as mean ± S.E.M. (n = 4). *p ≤ 0.05 according to a Student's t-test. (H) Kaplan-Meier survival curves of mice orthotopically implanted in the brain. Log-rank test between control/shNRF2 and TAZ/shNRF2: p = 0.056 (n = 5). See also Supplementary Fig. S7. (For interpretation of the references to colour in this figure legend, the reader is referred to the Web version of this article.)

References

    1. Hanif F., Muzaffar K., Perveen K., Malhi S.M., Simjee Sh U. Glioblastoma multiforme: a review of its epidemiology and pathogenesis through clinical presentation and treatment. Asian Pac. J. Cancer Prev. APJCP. 2017;18:3–9. - PMC - PubMed
    1. Cuadrado A., Manda G., Hassan A., Alcaraz M.J., Barbas C., Daiber A., Ghezzi P., Leon R., Lopez M.G., Oliva B., Pajares M., Rojo A.I., Robledinos-Anton N., Valverde A.M., Guney E., Schmidt H. Transcription factor NRF2 as a therapeutic target for chronic diseases: a systems medicine approach. Pharmacol. Rev. 2018;70:348–383. - PubMed
    1. Hayes J.D., Dinkova-Kostova A.T. The Nrf2 regulatory network provides an interface between redox and intermediary metabolism. Trends Biochem. Sci. 2014;39:199–218. - PubMed
    1. Lee S.B., Sellers B.N., DeNicola G.M. The regulation of NRF2 by nutrient-responsive signaling and its role in anabolic cancer metabolism. Antioxidants Redox Signal. 2018;29:1774–1791. - PubMed
    1. DeNicola G.M., Karreth F.A., Humpton T.J., Gopinathan A., Wei C., Frese K., Mangal D., Yu K.H., Yeo C.J., Calhoun E.S., Scrimieri F., Winter J.M., Hruban R.H., Iacobuzio-Donahue C., Kern S.E., Blair I.A., Tuveson D.A. Oncogene-induced Nrf2 transcription promotes ROS detoxification and tumorigenesis. Nature. 2011;475:106–109. - PMC - PubMed

Publication types

MeSH terms

Substances