. 2020 Jan:51:102615.
doi: 10.1016/j.ebiom.2019.102615. Epub 2020 Jan 6.

Mesenchymal stem cells ameliorate β cell dysfunction of human type 2 diabetic islets by reversing β cell dedifferentiation

Affiliations

Mesenchymal stem cells ameliorate β cell dysfunction of human type 2 diabetic islets by reversing β cell dedifferentiation

Le Wang et al. EBioMedicine. 2020 Jan.

Abstract

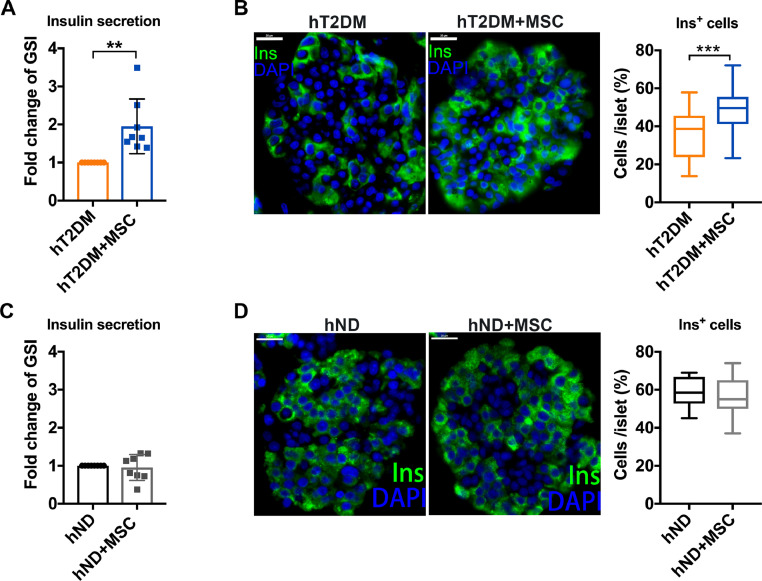
Background: A physiological hallmark of patients with type 2 diabetes mellitus (T2DM) is β cell dysfunction. Despite adequate treatment, it is an irreversible process that follows disease progression. Therefore, the development of novel therapies that restore β cell function is of utmost importance.

Methods: This study aims to unveil the mechanistic action of mesenchymal stem cells (MSCs) by investigating its impact on isolated human T2DM islets ex vivo and in vivo.

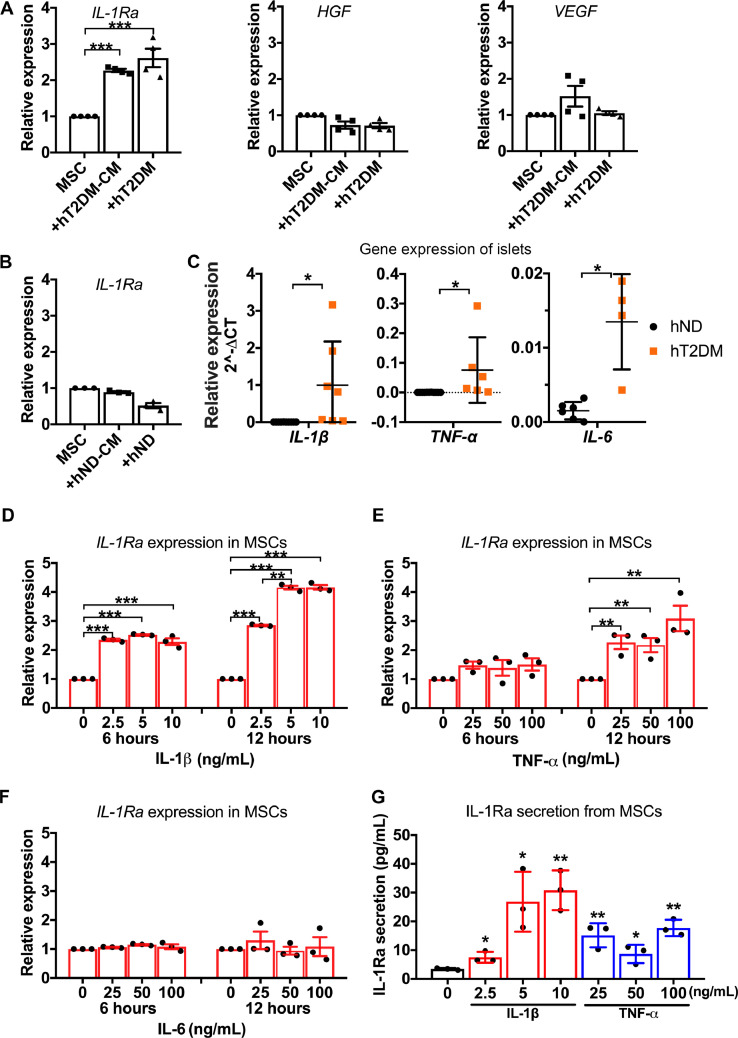
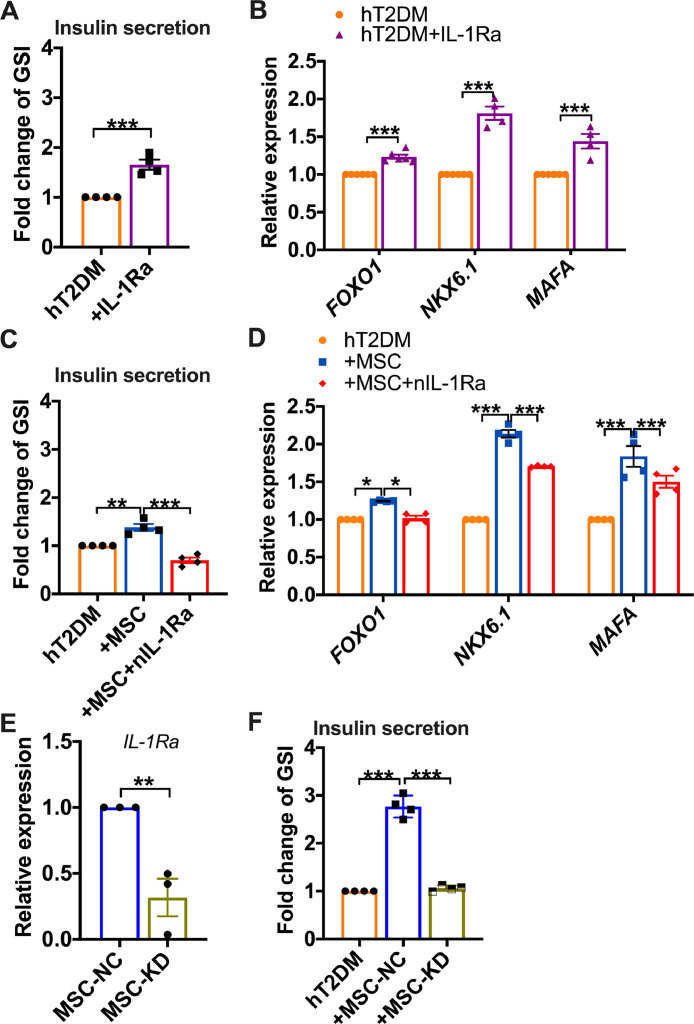
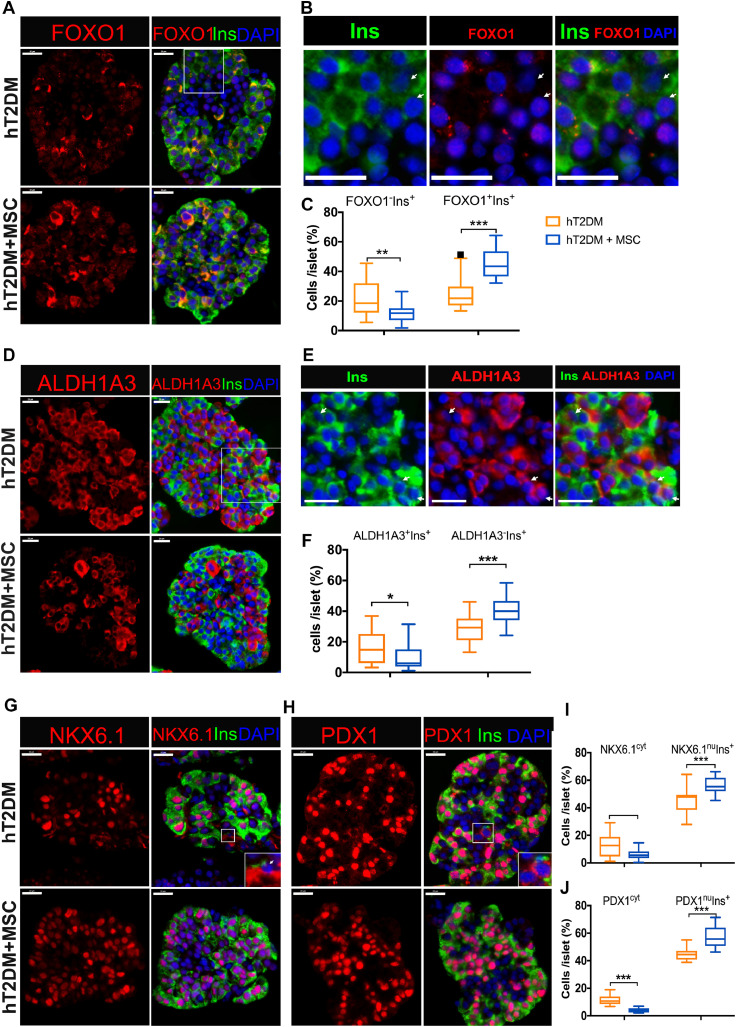
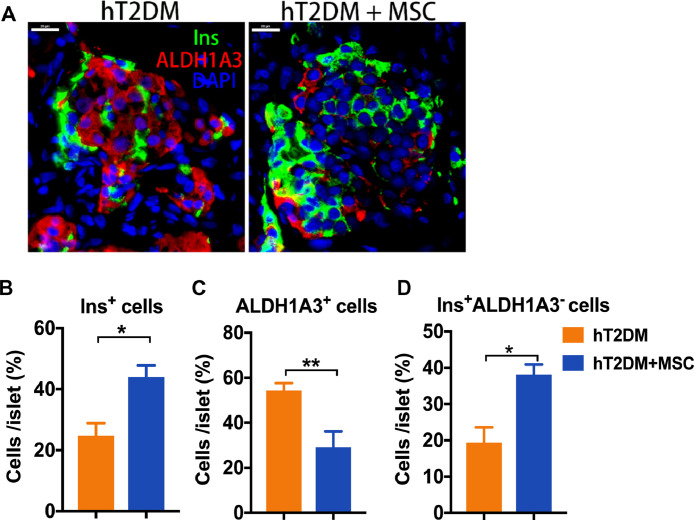
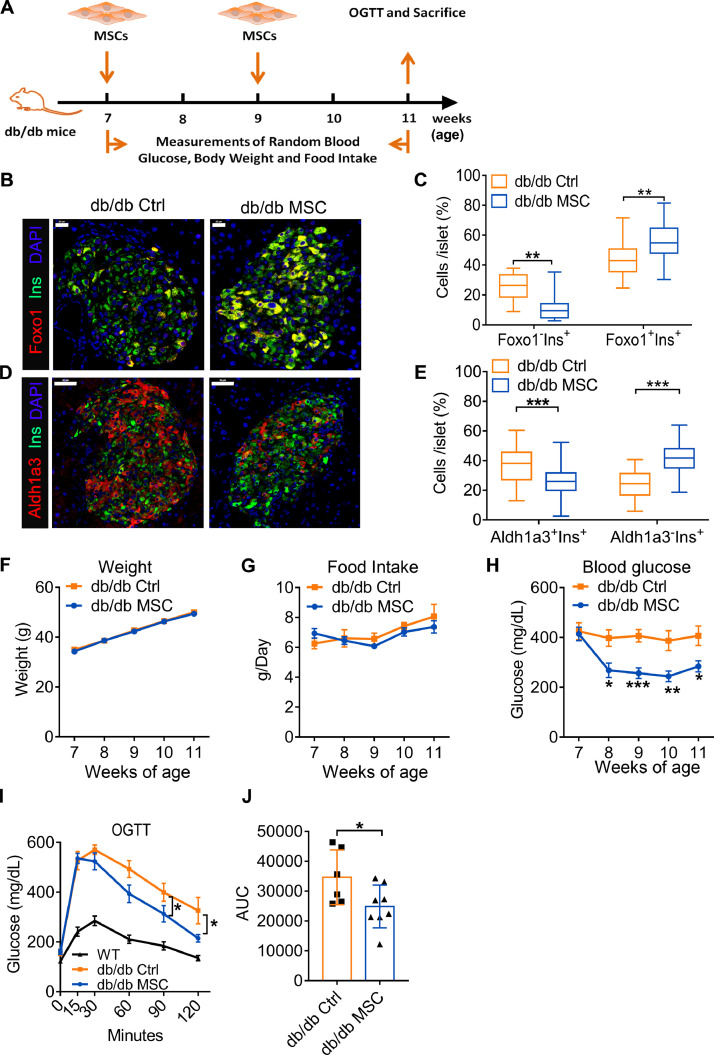
Findings: We propose that MSCs can attenuate β cell dysfunction by reversing β cell dedifferentiation in an IL-1Ra-mediated manner. In response to the elevated expression of proinflammatory cytokines in human T2DM islet cells, we observed that MSCs was activated to secret IL-1R antagonist (IL-1Ra) which acted on the inflammed islets and reversed β cell dedifferentiation, suggesting a crosstalk between MSCs and human T2DM islets. The co-transplantation of MSCs with human T2DM islets in diabetic SCID mice and intravenous infusion of MSCs in db/db mice revealed the reversal of β cell dedifferentiation and improved glycaemic control in the latter.

Interpretation: This evidence highlights the potential of MSCs in future cell-based therapies regarding the amelioration of β cell dysfunction.

Keywords: Inflammation; Mesenchymal stem cells; Type 2 diabetes mellitus; β cell dedifferentiation; β cell dysfunction.


Conflict of interest statement

Declaration of Competing Interest No conflict of interest to disclose.

Figures

Fig. 1
Fig. 1
MSCs coculture improves β cell function of hT2DM islets. (A)Glucose stimulated index (GSI) of hT2DM islets cocultured with or without MSCs coculture. GSI of control group was arbitrarily set to 1, and that of treatment group was expressed as fold change compared with that of control group. Data were shown as mean±SEM of GSI fold change. n = 8. (B) Immunofluorescence with Insulin (Ins, green) and DAPI (blue) of hT2DM islets with or without MSCs coculture. Scale bars = 20 μm. Quantification of Ins+cells per islet is shown as mean±SEM in at least 45 islets from 3 donors (at least 15 islets per donor). (C)GSI of hND islets cocultured with or without MSCs coculture. Data were shown as mean±SEM of GSI fold change. n = 8. (D) Immunofluorescence with Insulin (Ins, green) and DAPI (blue) of hT2DM islets with or without MSCs coculture. Scale bars = 20 μm. Quantification of Ins+cells per islet is shown as mean±SEM of at least 45 islets from 3 donors (at least 15 islets per donor). **p < 0.01, ***p < 0.001.
Fig. 2
Fig. 2
Human T2DM islets, but not ND islets, stimulate MSCs to secrete IL-1Ra. (A) Relative mRNA expression of IL-1Ra, VEGF, HGF in MSCs with the treatment of hT2DM islets conditioned medium (+hT2DM-CM), coculture with hT2DM islets (+hT2DM). Data were shown as mean±SEM of 4 independent experiments with islets from 2 donors. (B) Relative mRNA expression of IL-1Ra in MSCs with treatment of hND islets conditioned medium (+hND-CM), or coculture with hND islets (+hND). Data were shown as mean±SEM of 4 independent experiments with islets from 2 donors. (C)IL-1β, TNF-α,andIL-6 expression in hT2DM islets in comparison to hND islets (n = 6 for hND, n = 4–7 for hT2DM). (D-F)IL-1Ra expression in MSCs treated with IL-1β (D), TNF-α (E), or IL-6 (F) for 6 h or 12 h. (G) IL-1Ra secretion from MSCs treated with IL-1β or TNF-α for 12 h. n = 3. *p<0.05, **p<0.01, ***p<0.001.
Fig. 3
Fig. 3
IL-1Ra mediates the functional improvement of human T2DM islets by MSCs. (A) GSI fold change of hT2DM islets with or without IL-1Ra treatment (1000 ng/mL) for 24 h. (B) Relative mRNA expression of FOXO1, NKX6.1, and MAFA in hT2DM islets with or without IL-1Ra treatment. (C) GSI fold change of hT2DM islets treated with MSCs coculture, MSCs coculture in the presence of neutralizing anti-IL-1Ra (nIL-1Ra, 500 ng/mL). (D) Relative mRNA expression of FOXO1, NKX6.1, MAFA in hT2DM islets treated with MSCs coculture, or MSCs coculture in the presence of neutralizing anti-IL-1Ra (nIL-1Ra, 500 ng /mL). (E) Relative mRNA expression of IL-1Ra in MSCs with IL-1Ra knockdown (MSC-KD) or control cells (MSC—NC). (F) GSI fold change of hT2DM islets cocultured with MSCs with negative control (+MSC—NC) or with IL-1Ra knockdown (+MSC-KD),or cultured alone. GSI of control group (hT2DM) was arbitrarily set to 1, and that of treatment groups were expressed as fold change compared with that of the control group. Data were shown as mean±SEM of 4 independent experiments with islets from 2 donors. *p<0.05, **p<0.01, ***p<0.001.
Fig. 4
Fig. 4
MSCs reverse β cell dedifferentiation of hT2DM islets. (A) Immunofluorescence of FOXO1 (red), Insulin (Ins, green) and DAPI (blue) in hT2DM islets treated with MSCs coculture. (B) The amplified images of the white rectangle in (A), with white arrows showing the FOXO1Ins+ cells. (C) FOXO1+Ins+ and FOXO1Ins cells percentage per islet. (D) Immunofluorescence with ALDH1A3 (red), Insulin (Ins, green) and DAPI (blue) hT2DM islets treated with MSCs coculture. (E) The amplified images of the white rectangle in (A), with white arrows showing the ALDH1A3+Ins+ cells. (F) ALDH1A3+Ins+ and ALDH1AIns+ cells percentage per islet. (G&H) Immunofluorescence with NKX6.1 (red) (G) or PDX1 (red) (H), Insulin (Ins, green) and DAPI (blue) of hT2DM islets with or without MSCs coculture. (I) Quantification of NKX6.1cyt and NKX6.1nuIns+ cells percentage per islet. (J) Quantification of PDX1cyt and PDX1nuIns+ cells percentage per islet. Scale bars=20 μm. Data were shown as mean±SEM of 45–60 islets from 3–4 donors (at least 15 islets per donor). cyt: cytoplasmic expression, nu: nucleic expression, *p<0.05, **p<0.01, ***p<0.001.
Fig. 5
Fig. 5
Cotransplantation with MSCs to SCID mice reversed β cell dedifferentiation of human T2DM islets. hT2DM islets were transplanted to STZ-induced diabetic SCID mice with or without MSCs cotransplantation. Immunofluorescence of ALDH1A3 (red), Insulin (Ins, green) and DAPI (blue) in hT2DM islet grafts of the two groups (A). Ins+, ALDH1A3+ and ALDH1A3Ins+ cells percentage per islet were shown as mean±SEM(B-D). *p<0.05, **p<0.01, ***p<0.001.
Fig. 6
Fig. 6
MSCs transplantation reversed β cell dedifferentiation and improved β cell function of db/db mice. (A) Study design of the MSCs transplantation in db/db mice. (B) Immunofluorescence with Insulin (Ins, green), Foxo1 (red) and DAPI (blue) in db/db mice islets of the MSCs treatment group and the control group 4 weeks after treatment. Scale bars=20 μm. (C) Quantification of the percentage of Foxo1Ins+ and Foxo1+Ins+ cells per islet (n = 5 per group). (D) Immunofluorescence with Insulin (Ins, green), Aldh1a3 (red) and DAPI (blue) of db/db mouse islets with MSCs treatment group and control group 4 weeks after treatment. Scale bars=20 μm. (E) Quantification of the percentage of Aldh1a3+Ins+ and Aldh1a3Ins+cells per islet (n = 5 per group). (F) Weight of the db/db mice of the MSCs treatment group and control group (n = 8 per group). (G) Daily food intake of the db/db mice of the MSCs treatment group and control group (n = 8 per group). (H) Non-fasting glucose measurement of db/db mice in the MSCs treatment group and control group (n = 8 per group). (I) OGTT of the db/db mice of the MSCs treatment group and control group 4 weeks after the treatment. (J) AUC of the OGTT curve of the db/db mice of the MSCs treatment group and control group 4 weeks after the treatment (n = 6–8 per group). Data were shown as mean±SEM. *p<0.05, **p<0.01, ***p<0.001.

Similar articles

Cited by

  • Regeneration of β cells from cell phenotype conversion among the pancreatic endocrine cells.
    Wei T, Wei R, Hong T. Wei T, et al. Chronic Dis Transl Med. 2022 Mar 2;8(1):1-4. doi: 10.1002/cdt3.15. eCollection 2022 Mar. Chronic Dis Transl Med. 2022. PMID: 35620156 Free PMC article. No abstract available.
  • Adipose Tissue-Derived Stem Cells from Type 2 Diabetics Reveal Conservative Alterations in Multidimensional Characteristics.
    Wang L, Zhang L, Liang X, Zou J, Liu N, Liu T, Wang G, Ding X, Liu Y, Zhang B, Liang R, Wang S. Wang L, et al. Int J Stem Cells. 2020 Jul 30;13(2):268-278. doi: 10.15283/ijsc20028. Int J Stem Cells. 2020. PMID: 32587133 Free PMC article.
  • Type 2 Diabetes Mellitus Facilitates Shift of Adipose-Derived Stem Cells Ex Vivo Differentiation toward Osteogenesis among Patients with Obesity.
    Agareva M, Stafeev I, Michurina S, Sklyanik I, Shestakova E, Ratner E, Hu X, Menshikov M, Shestakova M, Parfyonova Y. Agareva M, et al. Life (Basel). 2022 May 6;12(5):688. doi: 10.3390/life12050688. Life (Basel). 2022. PMID: 35629356 Free PMC article.
  • Mesenchymal stem cells: ideal seeds for treating diseases.
    Gao G, Fan C, Li W, Liang R, Wei C, Chen X, Yang Y, Zhong Y, Shao Y, Kong Y, Li Z, Zhu X. Gao G, et al. Hum Cell. 2021 Nov;34(6):1585-1600. doi: 10.1007/s13577-021-00578-0. Epub 2021 Jul 16. Hum Cell. 2021. PMID: 34272720 Free PMC article. Review.
  • Biomarkers of aging.
    Aging Biomarker Consortium; Bao H, Cao J, Chen M, Chen M, Chen W, Chen X, Chen Y, Chen Y, Chen Y, Chen Z, Chhetri JK, Ding Y, Feng J, Guo J, Guo M, He C, Jia Y, Jiang H, Jing Y, Li D, Li J, Li J, Liang Q, Liang R, Liu F, Liu X, Liu Z, Luo OJ, Lv J, Ma J, Mao K, Nie J, Qiao X, Sun X, Tang X, Wang J, Wang Q, Wang S, Wang X, Wang Y, Wang Y, Wu R, Xia K, Xiao FH, Xu L, Xu Y, Yan H, Yang L, Yang R, Yang Y, Ying Y, Zhang L, Zhang W, Zhang W, Zhang X, Zhang Z, Zhou M, Zhou R, Zhu Q, Zhu Z, Cao F, Cao Z, Chan P, Chen C, Chen G, Chen HZ, Chen J, Ci W, Ding BS, Ding Q, Gao F, Han JJ, Huang K, Ju Z, Kong QP, Li J, Li J, Li X, Liu B, Liu F, Liu L, Liu Q, Liu Q, Liu X, Liu Y, Luo X, Ma S, Ma X, Mao Z, Nie J, Peng Y, Qu J, Ren J, Ren R, Song M, Songyang Z, Sun YE, Sun Y, Tian M, Wang S, Wang S, Wang X, Wang X, Wang YJ, Wang Y, Wong CCL, Xiang AP, Xiao Y, Xie Z, Xu D, Ye J, Yue R, Zhang C, Zhang H, Zhang L, Zhang W, Zhang Y, Zhang YW, Zhang Z, Zhao T, Zhao Y, Zhu D, Zou W, Pei G, Liu GH. Aging Biomarker Consortium, et al. Sci China Life Sci. 2023 May;66(5):893-1066. doi: 10.1007/s11427-023-2305-0. Epub 2023 Apr 11. Sci China Life Sci. 2023. PMID: 37076725 Free PMC article. Review.

References

    1. IDF . 8th edn. International Diabetes Federation; Brussels, Belgium: 2017. IDF Diabetes Atlas.http://www.diabetesatlas.org2017
    1. Taniguchi A., Fukushima M., Sakai M., Nagata I., Doi K., Nagasaka S. Insulin secretion, insulin sensitivity, and glucose effectiveness in nonobese individuals with varying degrees of glucose tolerance. Diabetes care. 2000;23(1):127–128. - PubMed
    1. Ma R.C., Chan J.C. Type 2 diabetes in East Asians: similarities and differences with populations in Europe and the United States. Ann N Y Acad Sci. 2013;1281:64–91. - PMC - PubMed
    1. Castiglione F., Tieri P., De Graaf A., Franceschi C., Lio P., Van Ommen B. The onset of type 2 diabetes: proposal for a multi-scale model. JMIR Res Protoc. 2013;2(2):e44. - PMC - PubMed
    1. Donath M.Y., Shoelson S.E. Type 2 diabetes as an inflammatory disease. Nat Rev Immunol. 2011;11(2):98–107. - PubMed

Substances