

Multiset sparse partial least squares path modeling for high dimensional omics data analysis
- PMID: 31918677
- PMCID: PMC6953292
- DOI: 10.1186/s12859-019-3286-3
Multiset sparse partial least squares path modeling for high dimensional omics data analysis
Abstract
Background: Recent technological developments have enabled the measurement of a plethora of biomolecular data from various omics domains, and research is ongoing on statistical methods to leverage these omics data to better model and understand biological pathways and genetic architectures of complex phenotypes. Current reviews report that the simultaneous analysis of multiple (i.e. three or more) high dimensional omics data sources is still challenging and suitable statistical methods are unavailable. Often mentioned challenges are the lack of accounting for the hierarchical structure between omics domains and the difficulty of interpretation of genomewide results. This study is motivated to address these challenges. We propose multiset sparse Partial Least Squares path modeling (msPLS), a generalized penalized form of Partial Least Squares path modeling, for the simultaneous modeling of biological pathways across multiple omics domains. msPLS simultaneously models the effect of multiple molecular markers, from multiple omics domains, on the variation of multiple phenotypic variables, while accounting for the relationships between data sources, and provides sparse results. The sparsity in the model helps to provide interpretable results from analyses of hundreds of thousands of biomolecular variables.
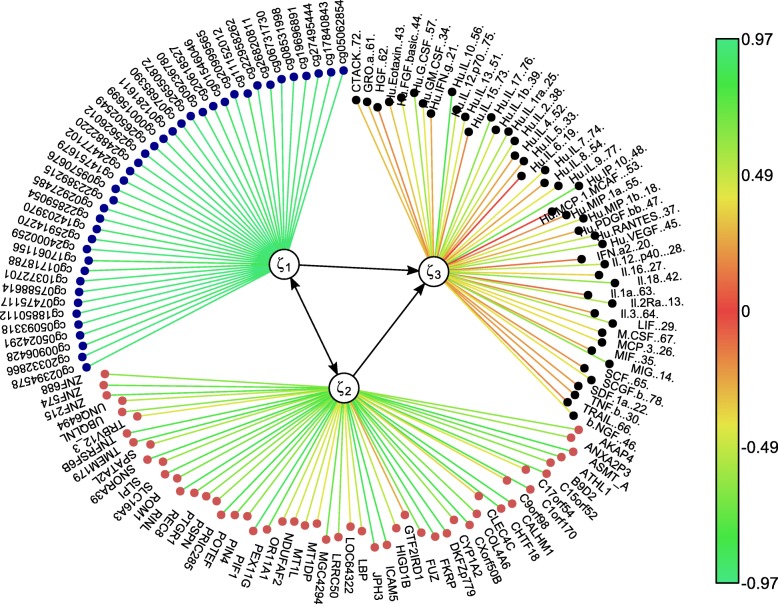
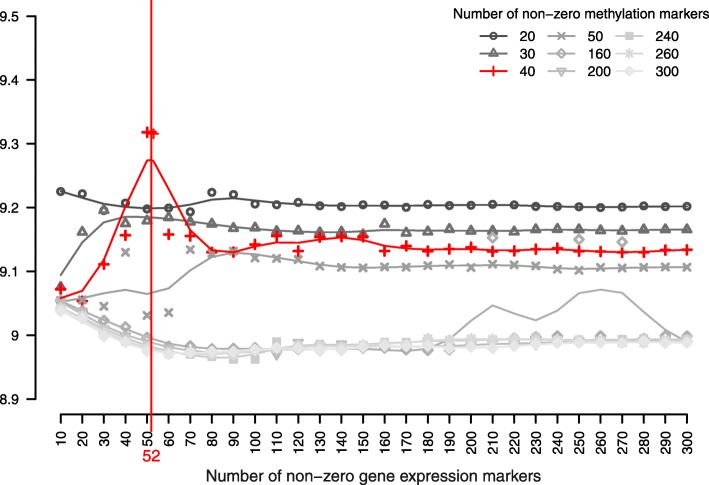
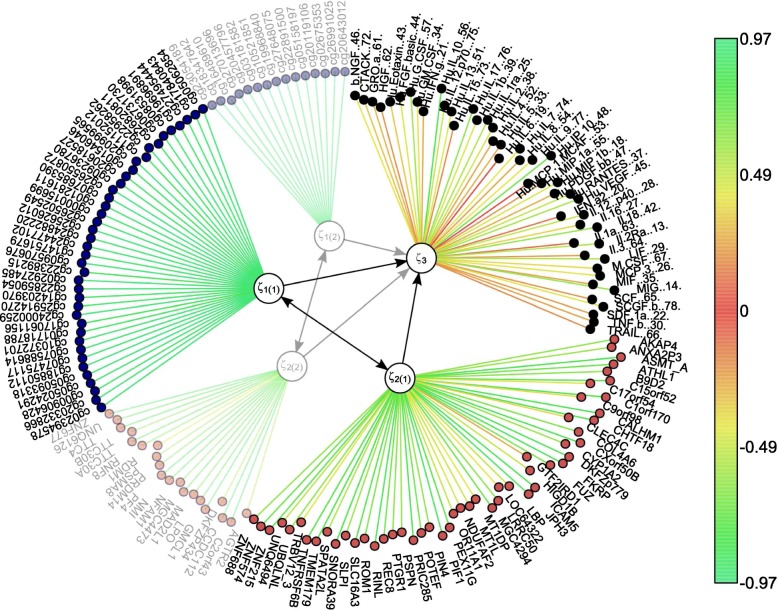
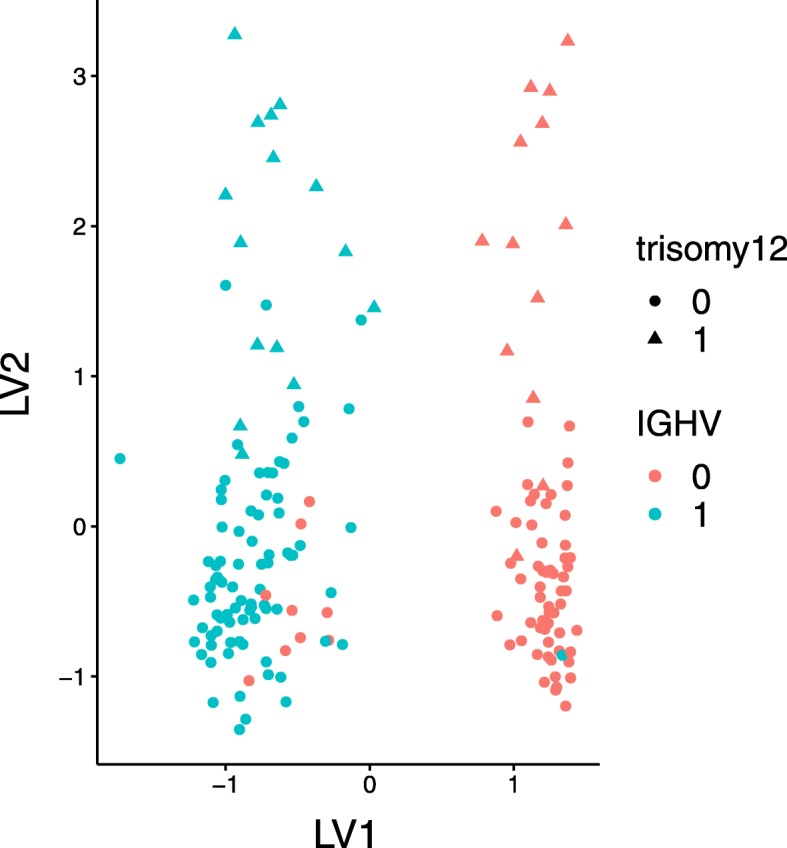
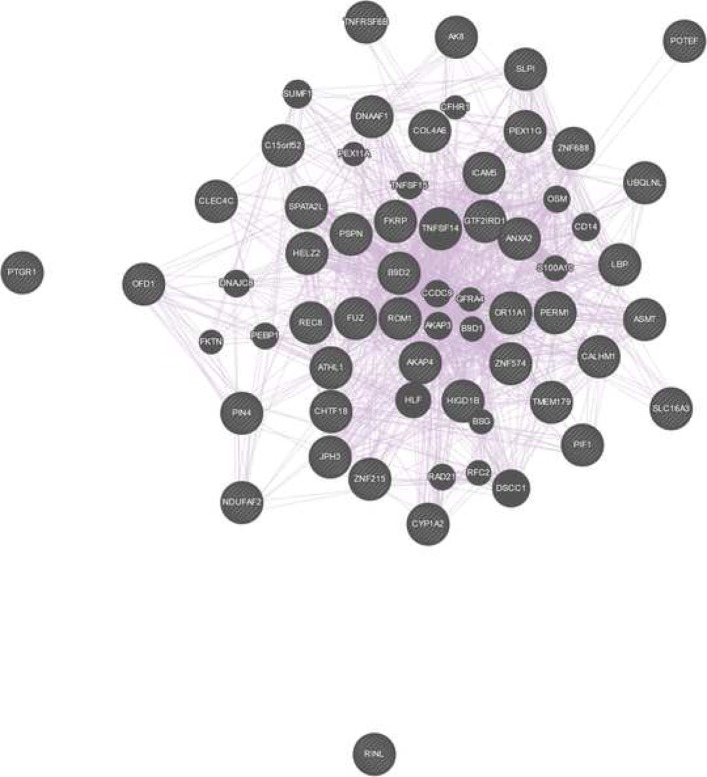
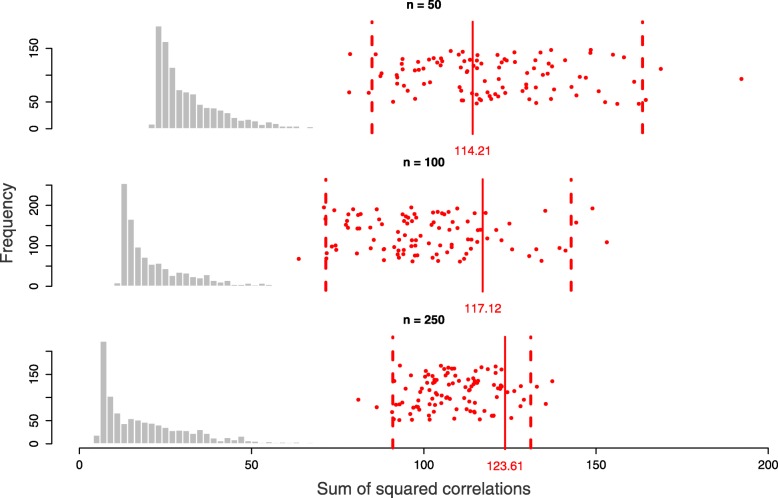
Results: With simulation studies, we quantified the ability of msPLS to discover associated variables among high dimensional data sources. Furthermore, we analysed high dimensional omics datasets to explore biological pathways associated with Marfan syndrome and with Chronic Lymphocytic Leukaemia. Additionally, we compared the results of msPLS to the results of Multi-Omics Factor Analysis (MOFA), which is an alternative method to analyse this type of data.
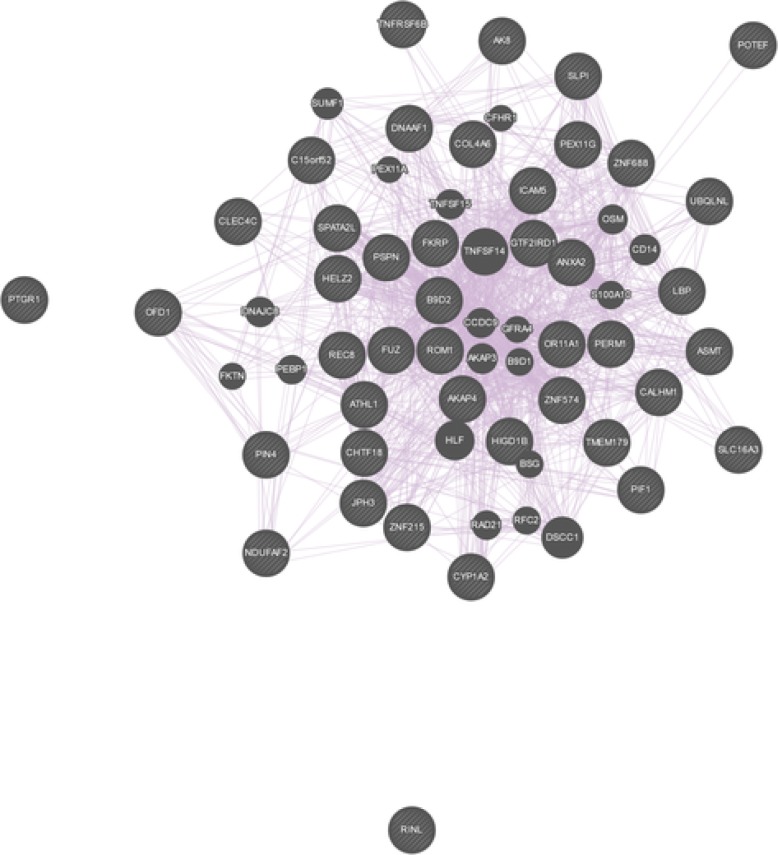
Conclusions: msPLS is an multiset multivariate method for the integrative analysis of multiple high dimensional omics data sources. It accounts for the relationship between multiple high dimensional data sources while it provides interpretable results through its sparse solutions. The biomarkers found by msPLS in the omics datasets can be interpreted in terms of biological pathways associated with the pathophysiology of Marfan syndrome and of Chronic Lymphocytic Leukaemia. Additionally, msPLS outperforms MOFA in terms of variation explained in the chronic lymphocytic leukaemia dataset while it identifies the two most important clinical markers for Chronic Lymphocytic Leukaemia AVAILABILITY: http://uva.csala.me/mspls.https://github.com/acsala/2018_msPLS.
Keywords: High dimensional omics data; Multivariate analysis; Partial least squares.
Conflict of interest statement
The authors declare that they have no competing interests.
Figures
References
-
- Tenenhaus A, Tenenhaus M. Regularized generalized canonical correlation analysis for multiblock or multigroup data analysis. Eur J Oper Res. 2014;238(2):391–403. doi: 10.1016/j.ejor.2014.01.008. - DOI
MeSH terms
LinkOut - more resources
Full Text Sources
