. 2020 Jan 10:148:e4.
doi: 10.1017/S0950268819002267.

Large-scale Lassa fever outbreaks in Nigeria: quantifying the association between disease reproduction number and local rainfall

Affiliations

Large-scale Lassa fever outbreaks in Nigeria: quantifying the association between disease reproduction number and local rainfall

Shi Zhao et al. Epidemiol Infect. .

Abstract

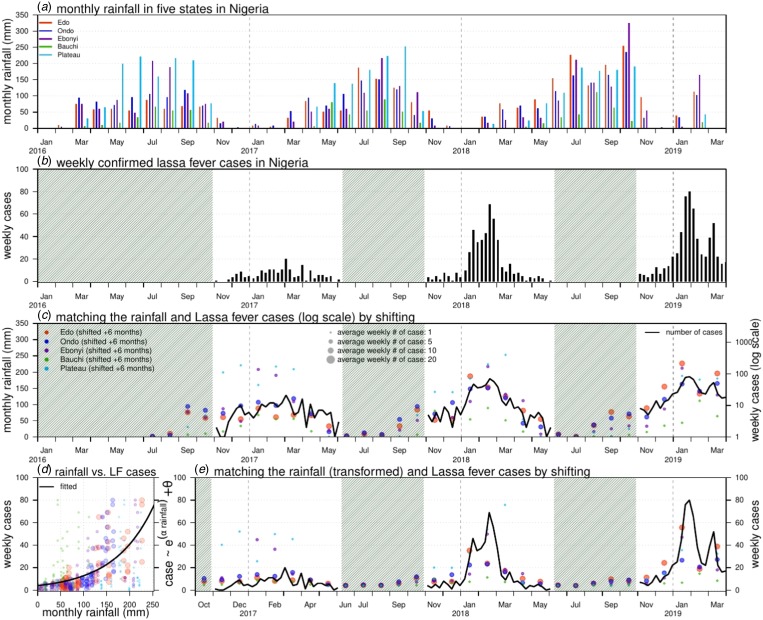
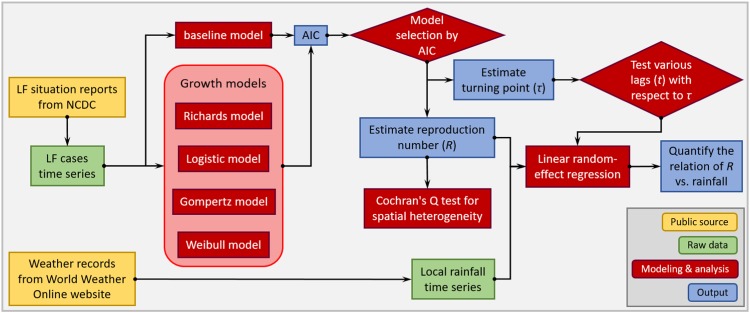
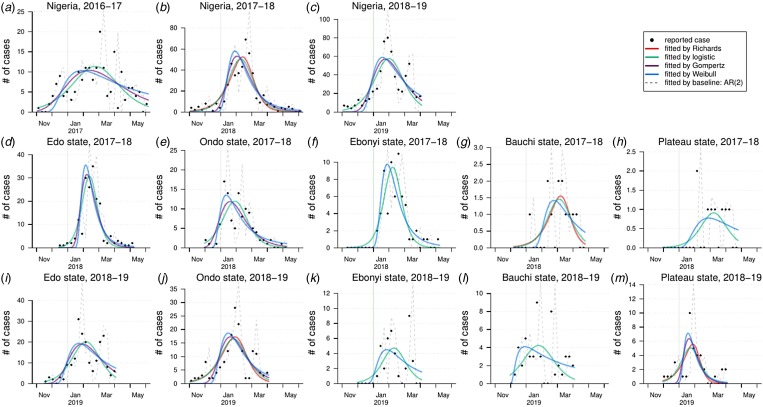
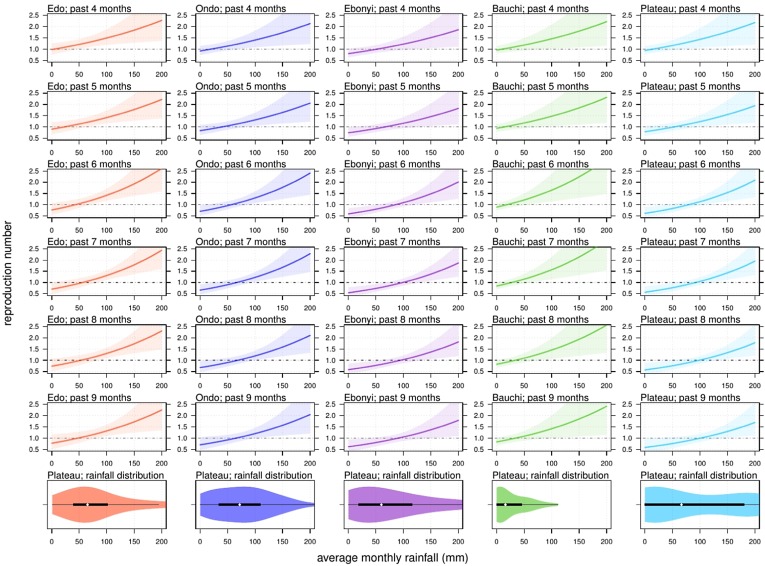
Lassa fever (LF) is increasingly recognised as an important rodent-borne viral haemorrhagic fever presenting a severe public health threat to sub-Saharan West Africa. In 2017-18, LF caused an unprecedented epidemic in Nigeria and the situation was worsening in 2018-19. This work aims to study the epidemiological features of epidemics in different Nigerian regions and quantify the association between reproduction number (R) and state rainfall. We quantify the infectivity of LF by the reproduction numbers estimated from four different growth models: the Richards, three-parameter logistic, Gompertz and Weibull growth models. LF surveillance data are used to fit the growth models and estimate the Rs and epidemic turning points (τ) in different regions at different time periods. Cochran's Q test is further applied to test the spatial heterogeneity of the LF epidemics. A linear random-effect regression model is adopted to quantify the association between R and state rainfall with various lag terms. Our estimated Rs for 2017-18 (1.33 with 95% CI 1.29-1.37) was significantly higher than those for 2016-17 (1.23 with 95% CI: (1.22, 1.24)) and 2018-19 (ranged from 1.08 to 1.36). We report spatial heterogeneity in the Rs for epidemics in different Nigerian regions. We find that a one-unit (mm) increase in average monthly rainfall over the past 7 months could cause a 0.62% (95% CI 0.20%-1.05%)) rise in R. There is significant spatial heterogeneity in the LF epidemics in different Nigerian regions. We report clear evidence of rainfall impacts on LF epidemics in Nigeria and quantify the impact.

Keywords: Lassa fever; Nigeria; modelling analysis; rainfall; reproduction number; spatial heterogeneity.


Conflict of interest statement

The authors declare that they have no competing interests.

Figures

Fig. 1.
Fig. 1.
Rainfall (unit: mm) and number of Lassa fever (LF) cases in Nigeria. Panel (a) shows the monthly rainfall in five states in Nigeria. Panel (b) shows the weekly number of LF cases in Nigeria. The shaded area represents a weekly number of cases lower than 10. Panel (c) matches the rainfall (dots) and LF cases (in log scale, black line) by shifting the rainfall time series by + 6 months. The sizes of each dot represent the number of the average weekly LF cases in each state in the 2017–18 and 2018–19 outbreaks. Panel (d) is the scatter plot of rainfall (shifted + 6 months) vs. LF cases; the dots of different colours and sizes share the same scheme as in panel (c). The black line is the fitting outcome of the formula ‘case ~ exp(α × rainfall) + θ’ by least square estimation and here, the ‘rainfall’ is the rainfall time series shifted + 6 months. The fitted R-squared is 0.41 and significance is P-value < 0.0001. Panel (e) is the fitting outcome from panel (d) and the rainfall dots (shifted + 6 months) of different colours and sizes share the same scheme as in panel (c).
Fig. 2.
Fig. 2.
The illustration diagram of the growth models fitting framework. The (solid and dashed) orange lines are the theoretical growth curves from the simple nonlinear growth models, i.e. the Richards, logistic, Gompertz, or Weibull models. The blue dots are the reported cumulative (cum.) number of cases. The blue shading area represents the period with epidemic reported, which is used for the model fitting in corresponds to the non-shaded area in Figure 1. The intrinsic growth rate is the γ in Eqn (1), which is estimated from the fitted growth models and used for R estimation.
Fig. 3.
Fig. 3.
A flow diagram of the modelling analysis. This figure shows the analysis procedures in this study.
Fig. 4.
Fig. 4.
The fitting results of estimates of Lassa epidemics in Nigeria by nonlinear growth models. In each panel, the dots are the observed (reported) cases, the dashed grey line is the fit by the baseline AR(2) model and the coloured lines are the fits from the nonlinear growth models.
Fig. 5.
Fig. 5.
The relationship between state rainfall and Lassa fever (LF) transmissibility, i.e. the reproduction number (R), in five different states with different time lags (t). The reproduction number of 1.0 is highlighted by the back dashed line. The panels at the bottom are the violin plots and show the distribution of rainfall in each state. The black rectangles represent the 25% and 75% quantiles and the white dot is the median.

References

    1. Gibb R et al. (2017) Understanding the cryptic nature of Lassa fever in West Africa. Pathogens and Global Health 111, 276–288. - PMC - PubMed
    1. Carey D et al. (1972) Lassa fever epidemiological aspects of the 1970 epidemic, Jos, Nigeria. Transactions of the Royal Society of Tropical Medicine and Hygiene 66, 402–408. - PubMed
    1. Richmond JK and Baglole DJ (2003) Lassa fever: epidemiology, clinical features, and social consequences. BMJ 327, 1271–1275. - PMC - PubMed
    1. The Lassa fever fact sheet, the World Health Organization (WHO) 2019. Available at https://www.who.int/en/news-room/fact-sheets/detail/lassa-fever.
    1. Shaffer JG et al. (2014) Lassa fever in post-conflict Sierra Leone. PLoS Neglected Tropical Diseases 8, e2748. - PMC - PubMed