. 2020 Feb 14;295(7):2034-2042.
doi: 10.1074/jbc.AC119.011795. Epub 2020 Jan 9.

CD137 negatively affects "browning" of white adipose tissue during cold exposure

Affiliations

CD137 negatively affects "browning" of white adipose tissue during cold exposure

Raj Kamal Srivastava et al. J Biol Chem. .

Abstract

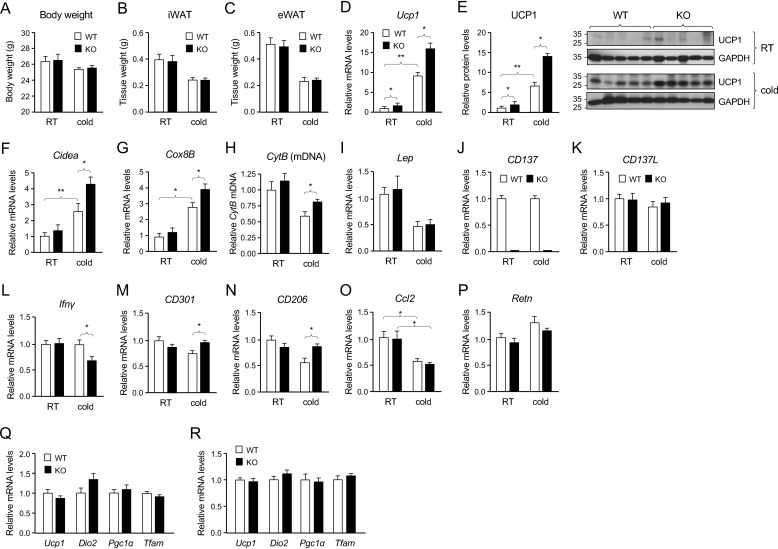
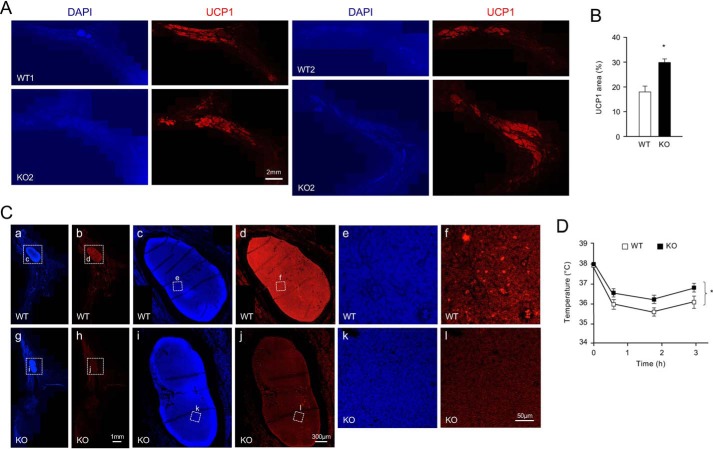
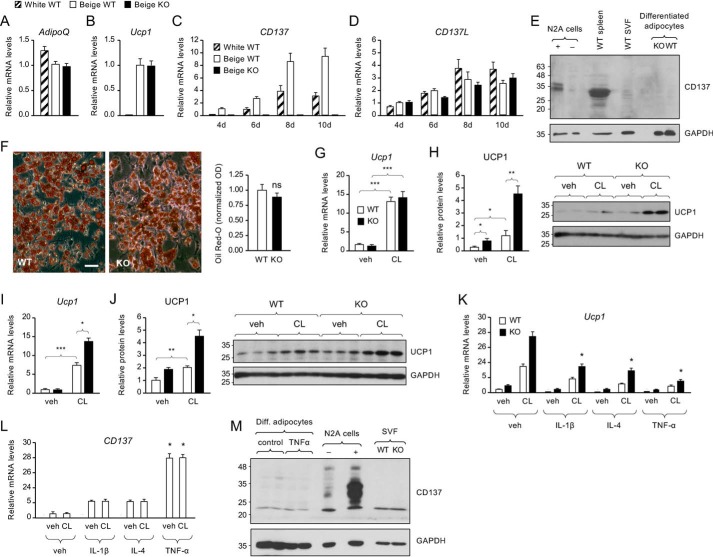
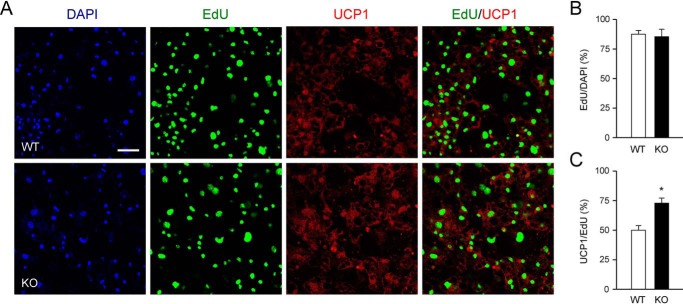
Prolonged cold exposure stimulates the formation of brownlike adipocytes expressing UCP1 (uncoupling-protein-1) in subcutaneous white adipose tissue which, together with classical brown adipose tissue, contributes to maintaining body temperature in mammals through nonshivering thermogenesis. The mechanisms that regulate the formation of these cells, alternatively called beige or brite adipocytes, are incompletely understood. Here we report that mice lacking CD137, a cell surface protein used in several studies as a marker for beige adipocytes, showed elevated levels of thermogenic markers, including UCP1, increased numbers of beige adipocyte precursors, and expanded UCP1-expressing cell clusters in inguinal white adipose tissue after chronic cold exposure. CD137 knockout mice also showed enhanced cold resistance. These results indicate that CD137 functions as a negative regulator of "browning" in white adipose tissue and call into question the use of this protein as a functional marker for beige adipocytes.

Keywords: UCP1; adipocyte; adipogenesis; adipokine; adipose tissue; adipose tissue metabolism; beige adipocyte; brite adipocyte; thermogenesis.


Conflict of interest statement

The authors declare that they have no conflicts of interest with the contents of this article

Figures

Figure 1.
Figure 1.
Enhanced expression of thermogenic proteins in iWAT of CD137 knockout mice after cold exposure. A, body weights of WT (open bars) and knockout (solid bars) mouse cohorts kept at room temperature (RT) and after chronic (4-week) cold exposure. B and C, weights of inguinal (B) and epididymal (C) fat depots in WT (open bars) and knockout (solid bars) mouse cohorts kept at RT and after chronic (4-week) cold exposure. D, expression of Ucp1 mRNA assessed by Q-PCR in iWAT of WT and CD137 knockout mice housed at RT or at 8 °C for 4 weeks (cold). Results are expressed as average ± S.E. of -fold change over WT at room temperature, n = 8 mice per group. *, p < 0.05; **, p < 0.01; 2-way ANOVA. E, expression of UCP1 protein assessed by Western blotting in iWAT of WT and CD137 knockout mice housed at RT or at 8 °C for 4 weeks (cold). Results are expressed as average ± S.E. of -fold change over WT at room temperature, n = 8 mice per group. *, p < 0.05; **, p < 0.01; 2-way ANOVA. Representative blots probed for UCP1 and GAPDH are show on the right-hand side. F and G, expression of Cidea (F) and Cox8B (G) mRNAs assessed by Q-PCR in iWAT of WT (open bars) and CD137 knockout (solid bars) mice housed at RT or at 8 °C for 4 weeks (cold). Results are expressed as average ± S.E. of -fold change over WT at RT, n = 8 mice per group. *, p < 0.05; **, p < 0.01; 2-way ANOVA. H, mitochondrial content assessed by Q-PCR for the mitochondrial gene cytochrome B (CytB) normalized to nuclear DNA in iWAT of WT (open bars) and CD137 knockout (solid bars) mice housed at RT or at 8 °C for 4 weeks (cold). Results are expressed as average ± S.E. of -fold change over WT at RT, n = 6 mice per group. *, p < 0.05. I to P, expression of Leptin (I), CD137 (J), CD137L (K), Ifnγ (L), CD301 (M), CD206 (N), Ccl2 (O), and Resistin (P) mRNAs assessed by Q-PCR in iWAT of WT (open bars) and CD137 knockout (solid bars) mice housed at RT or at 8 °C for 4 weeks (cold). Results are expressed as average ± S.E. of -fold change over WT at RT, n = 8 mice per group. *, p < 0.05; 2-way ANOVA. Q and R, expression of Ucp1, Dio2, Pgc1α, and Tfam mRNAs assessed by Q-PCR in brown adipose tissue of WT and CD137 knockout mice housed at room temperature (A) or at 5 °C for 4 weeks (B). Results are expressed as average ± S.E. of -fold change over WT, n = 8 mice per group.
Figure 2.
Figure 2.
CD137 knockout mice have expanded UCP1-expressing cell clusters in iWAT after cold exposure and show enhanced resistance to cold temperatures. A, immunohistochemistry analysis of UCP1 expression in sections of iWAT from WT and CD137 knockout mice after 4 weeks at 8 °C. Examples from two different mice of each genotype are shown as composites of 15–20 images through the whole iWAT fat pad. Counterstaining with DAPI is shown on the left. Scale bar, 2 mm. B, percentage of tissue area occupied by UCP1-positive cell clusters in iWAT from WT and CD137 knockout mice after 4 weeks at 8 °C. Results are expressed as average ± S.E., n = 8 mice per group. *, p = 0.023; Student's t test. C, immunohistochemistry analysis of CD137 expression (red) in sections of iWAT from 6-week-old cold-exposed WT and CD137 KO mice. DAPI counterstaining is shown in blue. Expression of CD137 could be detected in the iWAT lymph node (high magnification insets) but remained at the background levels similar to KO iWAT, in the rest of the tissue, where adipocytes are located. Size bars are indicated. D, body temperature of WT and CD137 knockout mice measured during 3-h exposure to 5 °C. Results are expressed as average ± S.E., n = 8 mice per group. *, p < 0.05 KO versus WT; 2-way ANOVA.
Figure 3.
Figure 3.
Enhanced response to β-adrenergic stimulation in cultured beige adipocytes from CD137 knockout mice after cold exposure. A and B, expression of Adiponectin (A) and Ucp1 (B) mRNAs assessed by Q-PCR in cultures of WT iWAT SVF cells differentiated for 8 days into white (hatched bars) or beige (open bars) adipocytes and CD137 knockout SVF cells differentiated to beige adipocytes (solid bars). Results are expressed in -fold change over beige WT as average ± S.E. of three independent experiments (n = 3) each performed in duplicate. C and D, expression of CD137 (C) and CD137L (D) mRNAs assessed by Q-PCR in cultures of WT iWAT SVF cells differentiated for 4, 6, 8, or 10 days into white (hatched bars) or beige (open bars) adipocytes and CD137 knockout SVF cells differentiated to beige adipocytes (solid bars). Results are expressed in -fold change over beige WT as average ± S.E. of three independent experiments (n = 3) each performed in duplicate. E, Western blot analysis of CD137 (molecular mass = 27kDa) expression in lysates of Neuro2A cells (N2A) stably transfected with CD137 expression vector (+) or control vector (−), extracts from WT spleen, iWAT SVF, and mature adipocytes differentiated in vitro from iWAT SVF derived from cold-exposed KO and WT mice. Loading control with GAPDH is shown in the lower panel. Expression of CD137 was detected in transfected N2A cells and spleen, but not in iWAT samples. F, representative phase contrast micrograph of Oil Red O staining in cultures of iWAT beige adipocytes isolated from WT or knockout mice after cold exposure. Scale bar, 20 μm. Histogram to the right shows quantification of Oil Red O staining in iWAT beige adipocytes isolated from WT or knockout mice after cold exposure. Shown are averages ± S.D. of triplicate measurements, normalized to the WT values. ns, not significantly different. G and I, expression of Ucp1 mRNA assessed by Q-PCR in cultures of iWAT beige adipocytes treated for 6 h with vehicle (veh) or the β-3 adrenergic agonist CL isolated from WT and knockout mice housed at room temperature (G) or for 4 weeks at 8 °C (I). Results are expressed in -fold change over WT (vehicle) as average ± S.E. of three independent experiments (n = 3) each performed in duplicate. *, p < 0.05; **, p < 0.01; ***, p < 0.001; 2-way ANOVA. H and J, expression of UCP1 protein assessed by Western blotting in cultures of iWAT beige adipocytes treated for 6 h with vehicle (veh) or the β-3 adrenergic agonist CL isolated from WT and knockout mice housed at room temperature (H) or for 4 weeks at 8 °C (J). Results are expressed in -fold change over WT (vehicle) as average ± S.E. of three independent experiments (n = 3) each performed in duplicate. *, p < 0.05; **, p < 0.01; ***, p < 0.001; 2-way ANOVA. Representative blots probed for UCP1 and GAPDH are show in the right-hand side. K, expression of Ucp1 mRNA assessed by Q-PCR in cultures of iWAT beige adipocytes, isolated from WT or knockout mice, treated for 6 h with vehicle (veh) or the β-3 adrenergic agonist CL after overnight treatment with the indicated cytokines. Results are expressed in -fold change over WT (vehicle) as average ± S.E. of three independent experiments (n = 3) each performed in duplicate. L, expression of CD137 mRNA assessed by Q-PCR in cultures of iWAT beige adipocytes, isolated from WT mice, treated for 6 h with vehicle (veh) or the β-3 adrenergic agonist CL after overnight treatment with the indicated cytokines. Results are expressed in -fold change over WT (vehicle) as average ± S.E. of three independent experiments (n = 3) each performed in duplicate. M, Western blot analysis of CD137 expression in lysates of in vitro differentiated adipocytes treated with TNFα, N2A cells transfected with CD137 plasmid, and iWAT SVF from cold-exposed KO and WT mice. Loading control with GAPDH is shown in the lower panel.
Figure 4.
Figure 4.
Increased number of beige adipocyte precursors in iWAT isolated from CD137 knockout mice after cold exposure. A, immunocytochemistry analysis of UCP1 expression in cultures of iWAT beige adipocytes labeled with a pulse of EdU prior to differentiation isolated from WT and knockout mice housed for 4 weeks at 8 °C. The panels show confocal images of DAPI, EdU, UCP1, and merged EdU/UCP1 labeling. Scale bar, 25 μm. B, percentage of EdU-positive cells among all cells labeled with DAPI in cultured iWAT beige adipocytes from WT and knockout mice housed for 4 weeks at 8 °C. Results are expressed as average ± S.E. of three independent experiments (n = 3) each performed in duplicate. C, percentage of UCP1-positive cells among all cells labeled with EdU in cultured iWAT beige adipocytes from WT and knockout mice housed for 4 weeks at 8 °C. Results are expressed as average ± S.E. of three independent experiments (n = 3) each performed in duplicate. *, p < 0.05; Student's t test.

Similar articles

Cited by

References

    1. Petrovic N., Walden T. B., Shabalina I. G., Timmons J. A., Cannon B., and Nedergaard J. (2010) Chronic peroxisome proliferator-activated receptor γ (PPARγ) activation of epididymally derived white adipocyte cultures reveals a population of thermogenically competent, UCP1-containing adipocytes molecularly distinct from classic brown adipocytes. J. Biol. Chem. 285, 7153–7164 10.1074/jbc.M109.053942 - DOI - PMC - PubMed
    1. Shabalina I. G., Petrovic N., de Jong J. M. A., Kalinovich A. V., Cannon B., and Nedergaard J. (2013) UCP1 in brite/beige adipose tissue mitochondria is functionally thermogenic. Cell Rep. 5, 1196–1203 10.1016/j.celrep.2013.10.044 - DOI - PubMed
    1. Harms M., and Seale P. (2013) Brown and beige fat: Development, function and therapeutic potential. Nat. Med. 19, 1252–1263 10.1038/nm.3361 - DOI - PubMed
    1. Sanchez-Gurmaches J., Hung C.-M., and Guertin D. A. (2016) Emerging complexities in adipocyte origins and identity. Trends Cell Biol. 26, 313–326 10.1016/j.tcb.2016.01.004 - DOI - PMC - PubMed
    1. Wang W., and Seale P. (2016) Control of brown and beige fat development. Nat. Rev. Mol. Cell Biol. 17, 691–702 10.1038/nrm.2016.96 - DOI - PMC - PubMed

Publication types

Substances