. 2020 Jan 9;11(1):147.
doi: 10.1038/s41467-019-13837-4.

Sensing of HIV-1 by TLR8 activates human T cells and reverses latency

Affiliations

Sensing of HIV-1 by TLR8 activates human T cells and reverses latency

Hany Zekaria Meås et al. Nat Commun. .

Abstract

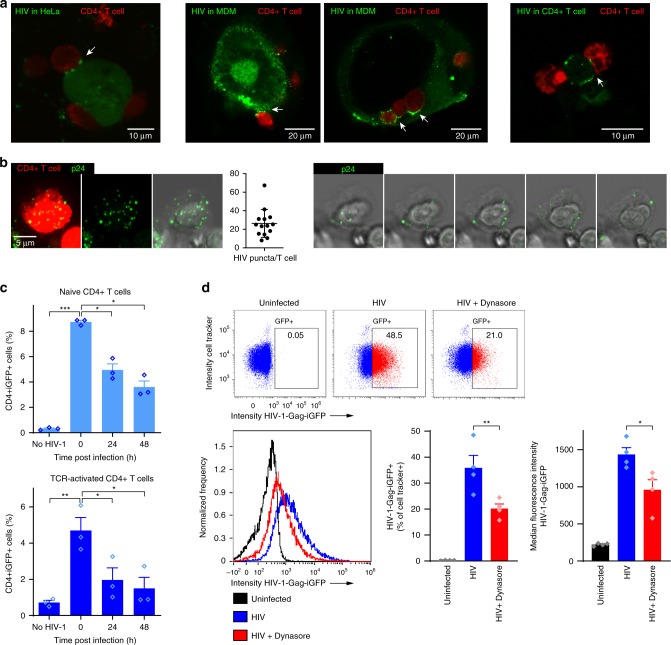
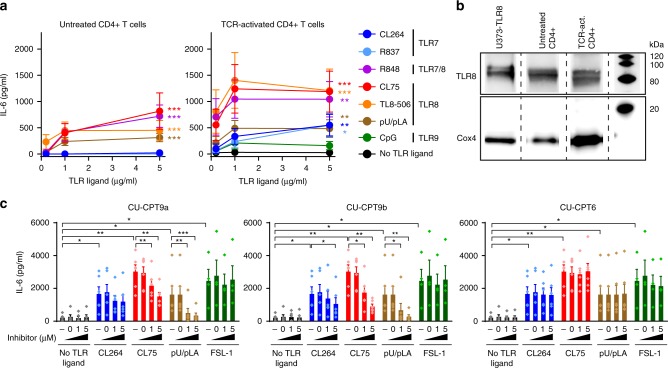
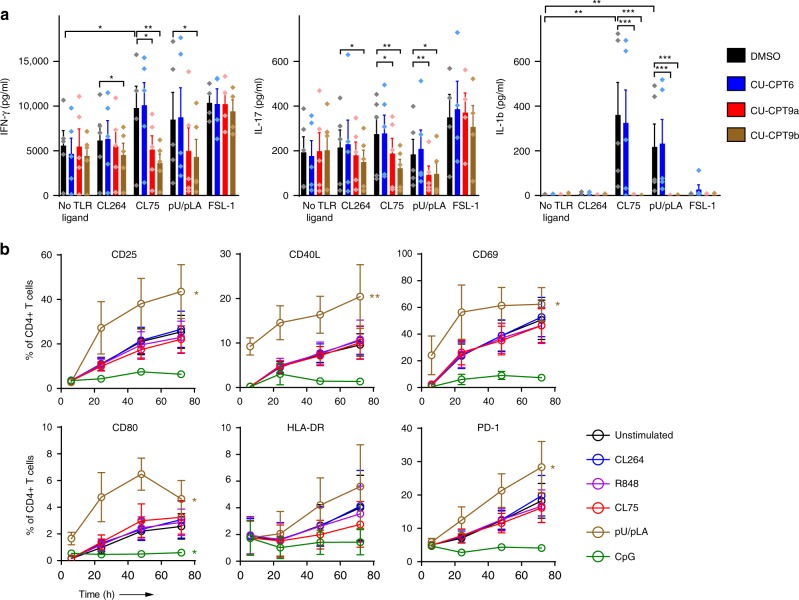
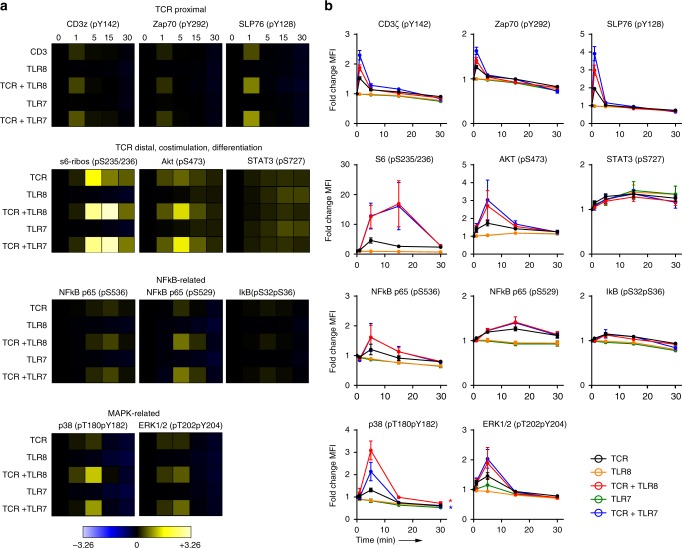
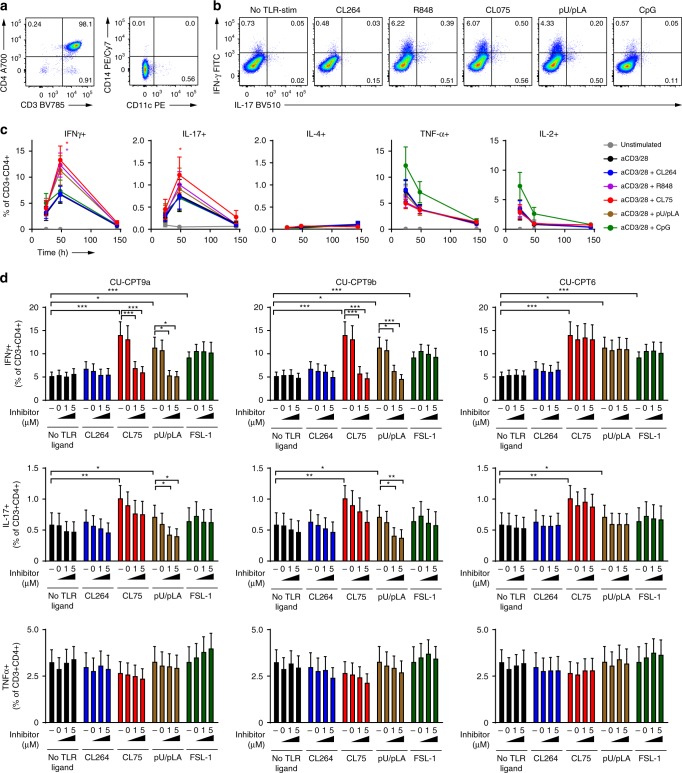
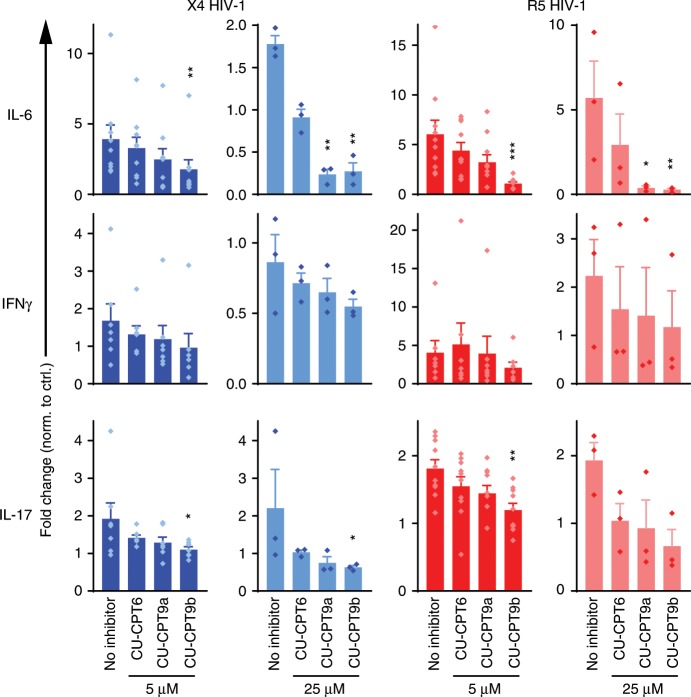
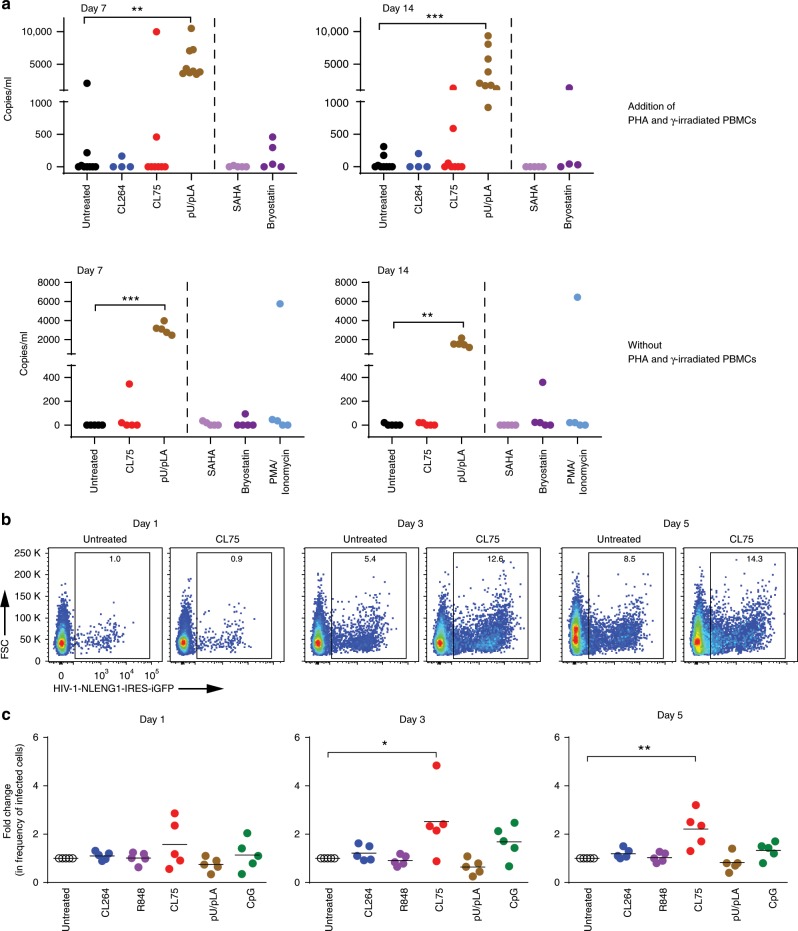
During HIV infection, cell-to-cell transmission results in endosomal uptake of the virus by target CD4+ T cells and potential exposure of the viral ssRNA genome to endosomal Toll-like receptors (TLRs). TLRs are instrumental in activating inflammatory responses in innate immune cells, but their function in adaptive immune cells is less well understood. Here we show that synthetic ligands of TLR8 boosted T cell receptor signaling, resulting in increased cytokine production and upregulation of surface activation markers. Adjuvant TLR8 stimulation, but not TLR7 or TLR9, further promoted T helper cell differentiation towards Th1 and Th17. In addition, we found that endosomal HIV induced cytokine secretion from CD4+ T cells in a TLR8-specific manner. TLR8 engagement also enhanced HIV-1 replication and potentiated the reversal of latency in patient-derived T cells. The adjuvant TLR8 activity in T cells can contribute to viral dissemination in the lymph node and low-grade inflammation in HIV patients. In addition, it can potentially be exploited for therapeutic targeting and vaccine development.


Conflict of interest statement

The authors declare no competing interests.

Figures

Fig. 1
Fig. 1. HIV-1 is endocytosed and degraded by CD4+ T cells.
a HeLa cells expressing X4-tropic HIV-1-Gag-iGFP (green), primary human monocyte-derived macrophages (MDM) infected with cell-free HIV-1-Gag-iGFP_JRFL (R5 HIV-1), or primary CD4+ T cells infected with cell-free HIV-1-Gag-iGFP (X4 HIV-1) were co-cultured for 3 h with TCR-activated CD4+ T cells (Cell Tracker Deep Red) in the presence of the CXCR4 inhibitor, AMD3100 or the CCR5 inhibitor, Maraviroc. HIV-1 is accumulating in the virological synapse between donor and acceptor cell for all tested donor cell types. b CD4+ T cells were co-cultured with HEK293T cells expressing NLENG1-IRES (X4 HIV-1) for 24 h, trypsin treated for removal of extracellular virus and labeled with antibodies against HIV-1 p24. Maximum intensity projection images of a representative CD4+ T cell (stained with Cell Tracker Deep Red, left image panel), and quantification of the number of trypsin-resistant HIV puncta (identified by p24 staining, green) per acceptor T cell. Slices from a confocal z-stack through the same cell depicting HIV puncta in trypsin-resistant compartments (right image panel, every second slice is shown). c Frequency of trypsinized HIV-1-positive CD4+ T cells after co-cultured for 3 h with HIV-1-Gag-iGFP-expressing HeLa cells, analyzed by flow cytometry 0, 24, and 48 h post co-culture. Bars represent mean + SEM from three independent experiments. d CD4+ T cells were pre-treated with 80 µM Dynasore for 1 h prior to co-culture with HEK293T cells expressing HIV-1-Gag-iGFP (X4 HIV-1) for 24 h and analysis by imaging flow cytometry. Dot plot examples showing frequencies of trypsinized HIV-1-positive CD4+ T cells (top). Histogram overlay of median fluorescent intensity of Gag-GFP (left) and quantification (right). Bars represent mean + SEM from four independent experiments. Statistical significance was determined from log-transformed data by repeated measures two-way ANOVA with Dunnettʼs post-test in c and two-tailed paired t-test in d; significance levels: *p < 0.05; **p < 0.01; ***p < 0.001. Source data are provided as a Source Data File.
Fig. 2
Fig. 2. TLR8 is expressed and induces secretion of IL-6 in human primary CD4+ T cells.
a Untreated or TCR-activated human primary CD4+ T cells were stimulated with 0.2, 1, and 5 μg/ml ligands to TLR7 (CL264, R837), TLR7/8 (R848), TLR8 (CL75, TL8-506, pU/pLA), or TLR9 (CpG, 0.2, 1, 5 μM) for 24 h and IL-6 secretion was analyzed by ELISA. Data represent mean + SEM from four independent experiments. b TLR8 expression in untreated or TCR-activated CD4+ T cells was analyzed by immunoblotting. Lysates from U373 cells overexpressing human TLR8 were used as positive control and Cox4 as housekeeping control. c CD4+ T cells were untreated (−) or pre-treated with DMSO (=0), 1 or 5 μM of TLR8-specific inhibitors CU-CPT9a, CU-CPT9b, or the negative control compound CU-CPT6, for 2 h prior to TCR activation and stimulation with 5 μg/ml CL264, CL75, pU/pLA, or FSL-1 (TLR2) for 24 h. IL-6 secretion was analyzed by ELISA. Bars represent mean + SEM from six independent experiments. Statistical significance was determined in a by calculating areas under the curve (AUC) followed by repeated measures one-way ANOVA with Dunnett´s post-test on log-transformed data, in c by two-way ANOVA with Dunnettʼs post-test; significance levels: *p < 0.05; **p < 0.01; ***p < 0.001. Source data are provided as a Source Data File.
Fig. 3
Fig. 3. TLR8 enhances cytokine secretion and surface activation markers in CD4+ T cells.
a CD4+ T cells were pre-treated with 5 µM TLR8-specific inhibitors CU-CPT9a, CU-CPT9b, or the negative control compound CU-CPT6, prior to TCR activation and stimulation with synthetic TLR ligands (5 µg/ml). Cell supernatants were harvested at 24 h and IFN-γ, IL-17, and IL-1β analyzed using multiplex ELISA. Bars represent mean values + SEM from five independent experiments. b TCR-activated CD4+ T cells were stimulated with 5 μg/ml CL264, R848 (TLR7/8), CL75, pU/pLA, or CpG (TLR9, 5 μM). T cell activation markers were analyzed by flow cytometry at the indicated time points after surface staining for CD25, CD40L, CD69, CD80, HLA-DR, and PD-1. Graphs represent mean values ± SEM from three independent experiments. Statistical significance was determined in a by ANOVA with Dunnettʼs post-test, in b by area under the curve (AUC) calculation followed by one-way ANOVA with Dunnettʼs post-test on log-transformed data; significance levels: *p < 0.05; **p < 0.01; ***p < 0.001. Source data are provided as a Source Data File.
Fig. 4
Fig. 4. TLR8 and TLR7 augment TCR signaling in CD4+ T cells.
TCR signaling was induced in CD4+ T cells for 0–30 min in the presence or absence of 5 μg/ml of CL264 (TLR7), CL75 (TLR8), or both. Phosphorylation of signaling proteins in the TCR and TLR pathways was analyzed using phospho-epitope-specific antibodies. TCR proximal (CD3ζ, Zap70, SLP76) and more distal (ribosomal protein S6, Akt, STAT3) signaling proteins were included, as well as proteins in the NF-κB (p65, IκB) and MAPK (p38, ERK1/2) pathways. Phosphorylation levels were quantified as arcsinh ratios of the median fluorescence intensity for the various phospho-specific Abs in activated versus unstimulated CD4+ T cells. a Phosphorylation levels displayed as heat maps (blue = reduced, yellow = increased) for one representative out of three experiments. b Phosphorylation levels from all three experiments displayed as the average arcsinh ratio± SEM of median fluorescence intensities. Statistical significance was determined by area under the curve (AUC) calculation followed by one-way ANOVA with Dunnettʼs post-test on log-transformed data; significance levels: *p < 0.05; **p < 0.01; ***p < 0.001. Source data are provided as a Source Data File.
Fig. 5
Fig. 5. TLR8 enhances differentiation of CD4+ T cells towards Th1 and Th17.
a Purity analysis of CD4+ T cells after isolation and content of contaminating CD14+ and CD11c+ cells. b, c CD4+ T cells were TCR-activated in the presence or absence of 5 μg/ml CL264 (TLR7), R848 (TLR7/8), CL75, pU/pLA (TLR8), or CpG (TLR9, 5 μM). Production of CD4+ T helper effector cytokines IFN-γ, IL-17, IL-4, TNF-α, and IL-2 was analyzed at 24–144 h by intracellular flow cytometry. b Example of flow cytometric analysis of Th1 lineage cytokine IFN-γ and Th17 cytokine IL-17 at 48 h. c Frequencies of cytokine-producing CD4+ T cells over time. Results represent mean + SEM from eight independent experiments. d CD4+ T cells were pre-treated with TLR8-specific inhibitors CU-CPT9a, CU-CPT9b, or the negative control compound CU-CPT6 for 2 h prior to TCR activation and stimulation with 5 μg/ml of CL264, CL75, pU/pLA, or FSL-1 (TLR2) for 72 h. Cytokine production was analyzed by intracellular flow cytometry. Results from inhibitor-treated CD4+ T cells were compared to untreated (−) or DMSO (=0) treated control cells (same data in all three graphs for each cytokine). Bars represent mean + SEM from ten experiments. Statistical significance was determined from log-transformed data by repeated measures two-way ANOVA with Dunnettʼs post-test in c (48 h timepoint) and in d; significance levels: *p < 0.05; **p < 0.01; ***p < 0.001. Source data are provided as a Source Data File.
Fig. 6
Fig. 6. Endolysosomal HIV-1 potentiates cytokine secretion from CD4+ T cells.
CD4+ T cells were pre-treated with CXCR4 inhibitor AMD3100 or CCR5 inhibitor Maraviroc for 24 h, and TLR8-specific inhibitors CU-CPT9a, CU-CPT9b, or the negative control compound CU-CPT6 for 2 h, prior to concomitant TCR activation and co-culture with HEK293T cells expressing HIV-1-Gag-iGFP (X4 HIV-1) or HIV-Gag-iGFP JRFL (R5 HIV-1). Cytokines were analyzed in the supernatant 24 h post infection by multiplex ELISA. Results are presented as fold change relative to co-cultures in the absence of HIV-1. Bars represent means + SEM from 7 to 10 independent experiments with 5 μM inhibitor and three independent experiments with 25 μM inhibitor. Statistical significance (inhibitor samples versus untreated) was determined using repeated measures one-way ANOVA with Dunnettʼs post-test on log-transformed data; significance levels: *p < 0.05; **p < 0.01; ***p < 0.001. Source data are provided as a Source Data File.
Fig. 7
Fig. 7. TLR8 increases HIV replication and reverses latency in CD4+ T cells.
a Viral outgrowth assay: CD4+ T cells isolated from aviremic patients were activated with γ-irradiated PBMCs and PHA (nine donors) or left untreated (five donors) and stimulated with 5 μg/ml of CL264 (TLR7), CL75, or pU/pLA (TLR8) for the time points indicated. Cells from four treated and all five untreated donors were stimulated with SAHA (335 nM), Bryostatin (10 nM), or PMA/ionomycin (500 nM/1.3 μM) for 16 h. HIV RNA was quantified in the supernatant by qPCR. b, c CD4+ T cells isolated from healthy blood donors were TCR-activated in the presence or absence of 5 μg/ml CL264, R848 (TLR7/8), CL75, pU/pLA, or CpG (TLR9, 5 μM) for 48 h prior to infection with cell-free NLENG1-IRES (X4 HIV-1). The frequency of eGFP+ T cells over time was quantified using flow cytometry; representative dot plot examples of untreated and CL75-treated CD4+ T cells 1–5 days post HIV infection are shown in b. Quantification in c is presented as fold change relative to HIV-1-infected cells in the absence of TLR ligands. The mean value of five independent experiment is indicated. Statistical significance was determined using repeated measures mixed effects model with Dunnettʼs post-test on log-transformed data; significance levels: *p < 0.05; **p < 0.01; ***p < 0.001. Source data are provided as a Source Data File.

References

    1. Deeks SG, Lewin SR, Havlir DV. The end of AIDS: HIV infection as a chronic disease. Lancet. 2013;382:1525–1533. doi: 10.1016/S0140-6736(13)61809-7. - DOI - PMC - PubMed
    1. Deeks SG, Tracy R, Douek DC. Systemic effects of inflammation on health during chronic HIV infection. Immunity. 2013;39:633–645. doi: 10.1016/j.immuni.2013.10.001. - DOI - PMC - PubMed
    1. Zapata HJ, Shaw AC. Aging of the human innate immune system in HIV infection. Curr. Opin. Immunol. 2014;29:127–136. doi: 10.1016/j.coi.2014.06.007. - DOI - PMC - PubMed
    1. Reynolds JM, Dong C. Toll-like receptor regulation of effector T lymphocyte function. Trends Immunol. 2013;34:511–519. doi: 10.1016/j.it.2013.06.003. - DOI - PubMed
    1. Shen, H. S. et al. HIV coreceptor tropism determination and mutational pattern identification. Sci. Rep. 6, 21280 (2016). - PMC - PubMed

Publication types