Meta-Analysis
. 2020 Jan 9;11(1):164.
doi: 10.1038/s41467-019-13965-x.

Genome-wide CRISPR screen identifies host dependency factors for influenza A virus infection

Affiliations
Meta-Analysis

Genome-wide CRISPR screen identifies host dependency factors for influenza A virus infection

Bo Li et al. Nat Commun. .

Abstract

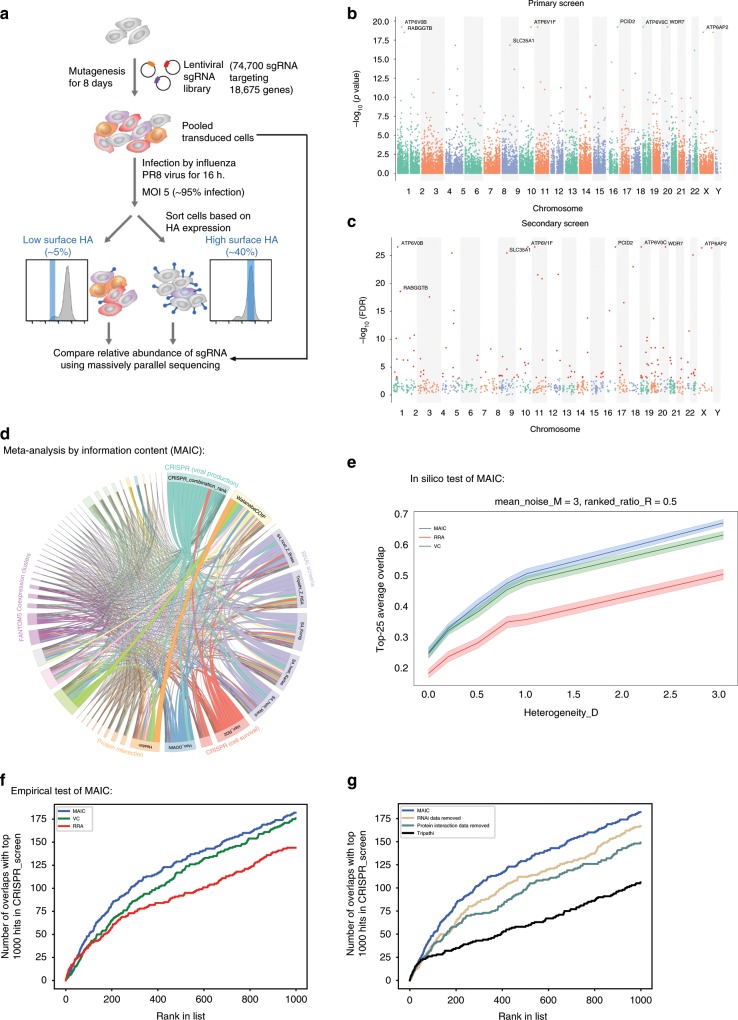
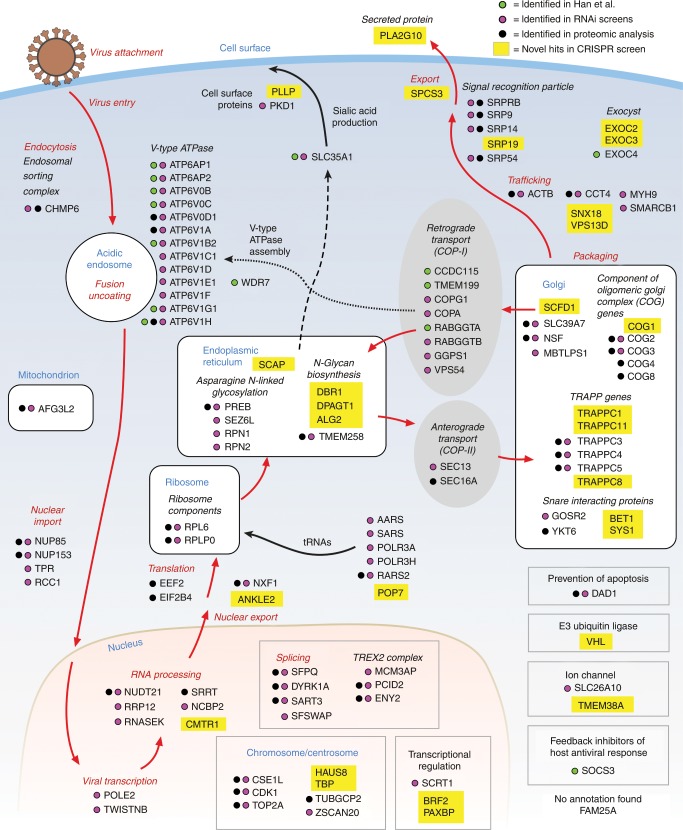
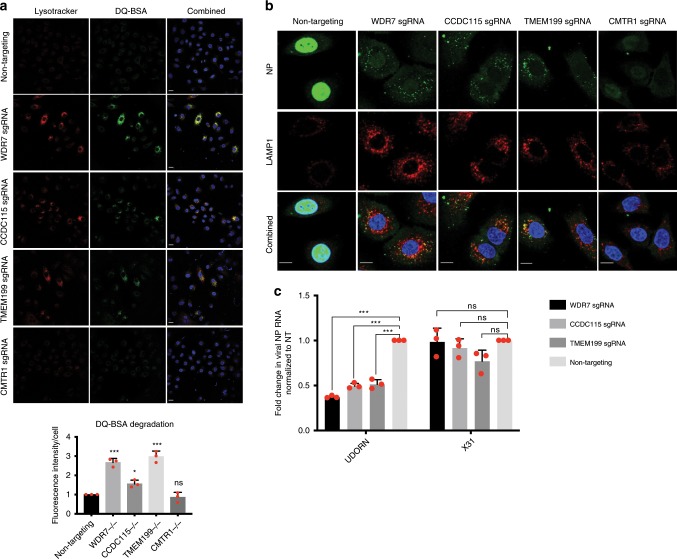
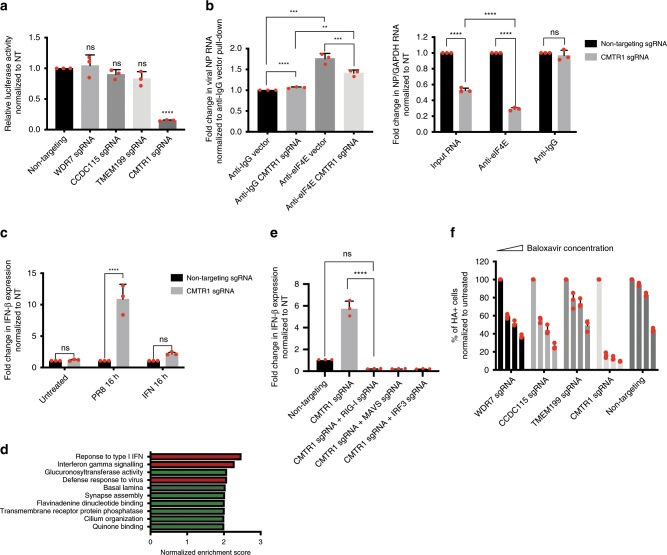
Host dependency factors that are required for influenza A virus infection may serve as therapeutic targets as the virus is less likely to bypass them under drug-mediated selection pressure. Previous attempts to identify host factors have produced largely divergent results, with few overlapping hits across different studies. Here, we perform a genome-wide CRISPR/Cas9 screen and devise a new approach, meta-analysis by information content (MAIC) to systematically combine our results with prior evidence for influenza host factors. MAIC out-performs other meta-analysis methods when using our CRISPR screen as validation data. We validate the host factors, WDR7, CCDC115 and TMEM199, demonstrating that these genes are essential for viral entry and regulation of V-type ATPase assembly. We also find that CMTR1, a human mRNA cap methyltransferase, is required for efficient viral cap snatching and regulation of a cell autonomous immune response, and provides synergistic protection with the influenza endonuclease inhibitor Xofluza.


Conflict of interest statement

The authors declare no competing interests.

Figures

Fig. 1
Fig. 1. Genome-wide CRISPR screens identify IAV host dependency factors.
a Schematics of the genome-wide CRISPR/Cas9 screening strategy. b, c Spatial distribution of CRISPR knockout signals on the genome for the primary and secondary screens. b Gene-level p-values in primary screen. A selection of top hits is highlighted. c Gene-level FDRs for top hits in the secondary screen. The core set of 121 robust hits (FDR < 0.05) is shown highlighted in red. d Representation of shared information content between each data source after MAIC analysis. Size of data source blocks is proportional to the summed information content (MAIC scores) of input list. Lines are colored according to the dominant data source. Data source categories share the same color; the largest categories and data sources are labeled (see supplementary information for full source data). CRISPR screen performed in this study is labeled as CRISPR (viral production). e Example of validation of MAIC screen using synthetic data (see methods). Y-axes show overlap ratio compared to a known truth (see methods; narrow line = average of 100 replicates; shading = 95% confidence interval). MAIC consistently out-performs existing methods (robust rank aggregation, RRA; vote counting; VC) when presented realistic inputs. Example shown is for a mixture of ranked and unranked data sources, and moderate variation in data quality (heterogeneity) between data sources. See supplementary Figs. 2 for full evaluation. f Experimental validation of MAIC (computed without CRISPR data) against an unseen gold standard (CRISPR screen). Plot shows number of overlaps with the top 1000 hits in CRISPR screen for a given position in each ranked dataset. g Contribution of different data categories to predictive value of the MAIC. As in (f), graph shows number of overlaps with the top 1000 CRISPR screen hits. Results are shown with all RNAi data from previous studies removed from the input set, and with all proteomic or protein interaction data removed. The results of the systematic meta-analysis by Tripathi et al. are shown for comparison.
Fig. 2
Fig. 2. CRISPR screens hits and their predicted roles in the IAV life cycle.
Diagram showing all 121 hits from our CRISPR screen (FDR < 0.05) and their predicted roles in the IAV life cycle. Hits are marked by a colored dot if they had also been identified in previous RNAi screens (Magenta), proteomic studies (Black) or CRISPR screen (Green). Hits unique to our CRISPR screen are highlighted in yellow.
Fig. 3
Fig. 3. Validation of screen hits in A549 cells and normal human lung fibroblasts (NHLF).
a A549 cells and b primary normal human lung fibroblasts were transduced with either gene-specific or non-targeting sgRNA, followed by infection with PR8 virus at MOI 5 for 16 h. Y-axis shows percentage of HA-positive cells normalized to non-targeting sgRNA. Error bars represent standard deviations from three independent experimental replicates. c Virus titer in plaque forming units (PFU)/ml at 24, 48, and 72 h post-infection with either PR8 (Left) or Udorn (right) virus at MOI 0.1. Supernatant used for the plaque assay was collected from infected A549 cells transduced with either gene-specific or non-targeting sgRNA. Error bars represent standard deviations from three independent experimental replicates. d Fold change in viral HA RNA level relative to GAPDH measured by qRT-PCR. A549 cells transduced with either gene-specific or non-targeting sgRNA were infected with H1N1 California/2009, H1N1/New Caledonia/1999 or H5N1/Vietnam/2004/PR8-recombinant IAV strains at high MOI for 16 h. Fold change was normalized to HA RNA level in A549 cells transduced with non-targeting sgRNA. A549 cells transduced with SLC35A1 sgRNA was used for comparison. Error bars represent standard deviations from three independent experimental replicates. e A549 cells transduced with either gene-specific or non-targeting sgRNA were infected with VSV-GFP virus at MOI 1 for 16 h. Y-axis shows percentage of GFP-positive cells normalized to non-targeting sgRNA. Error bars represent standard deviations from three independent experimental replicates. f Proliferation curve of transduced A549 cells up to 9 days post sgRNA-transduction. Error bars represent standard deviations from three independent experimental replicates. ****P = 0.0001 ***P < 0.001 and *P < 0.05, by one-way ANOVA test.
Fig. 4
Fig. 4. WDR7, CCDC115, TMEM199 and CMTR1 are involved in early infection.
a Flow cytometry and fluorescent in situ hybridization (FISH) for influenza PR8 NP protein and RNA. A549 cells were transduced with either gene-specific or non-targeting sgRNA and infected with PR8 virus for 4 h. Infected cells were stained with anti-H1N1 NP antibody or NP FISH RNA probes. Bar graphs show quantification for the percentage of NP-positive cells for both protein and RNA (cells with positive FISH staining) normalized to non-targeting sgRNA. Scale bar = 20 μm. Error bars represent standard deviation from three independent experimental replicates for NP protein staining and four randomly chosen frames for NP RNA FISH. b A549 cells were transduced with either gene-specific or non-targeting sgRNA and infected with MLV-GFP reporter virus pseudo-typed with either influenza PR8 HA and NA or MLV envelop proteins. Y-axis shows percentage of GFP-positive cells normalized to non-targeting sgRNA. Error bars represent standard deviations from three independent experimental replicates. c Histogram showing level of surface-bound HA (left) and sialic acid (right). A549 cells transduced with either gene-specific or non-targeting sgRNA were incubated with PR8 virus for 30 min at 4 °C for monitoring level of surface-bound HA or stained with fluorescein-labeled Sambucus Nigra Lectin for 1 h at 4 °C for surface sialic acid. Cells transduced with sgRNA targeting SLC35A1 was used as positive control. Histograms shown is representative of three independent experimental replicates. ****P = 0.0001 ***P < 0.001 and **P < 0.01, by one-way ANOVA test.
Fig. 5
Fig. 5. WDR7, CCDC115 and TMEM199 regulate endo-lysosomal pH.
a Immunofluorescence of A549 cells transduced with either gene-specific or non-targeting sgRNA and stained with Lysotracker red, anti-LAMP1 and anti-Rab7 antibodies. Scale bar = 20 μm. b Lysotracker red staining of A549 cells transduced with either gene-specific or non-targeting sgRNA. Cells were mock-treated or treated with 100 nM Bafilomycin A (BafA). Scale bar = 20 μm. c A549 cells transduced with either gene-specific or non-targeting sgRNA were treated with different concentrations of BafA followed by PR8 virus infection. Error bars represent standard deviations from two independent experimental replicates. d A549 cells transduced with either gene-specific or non-targeting sgRNA were fractioned into membrane and cytosolic components. The two fractions were then subjected to SDS-PAGE and Western blotting using antibodies against subunit A of the V1 domain and subunit D of the V0 domain as measure of V-ATPase assembly. Western blotting was also performed for HSP90 (cytosolic) and COX-IV (membrane) as positive controls. e Cytosolic and nuclear proteins were extracted from A549 cells transduced with either gene-specific or non-targeting sgRNA using the NE-PER Nuclear and Cytoplasmic extraction kit. Samples in each fraction were subjected to SDS-PAGE and western blotting using antibodies against TFEB. Western blotting for TATA-binding protein (TBP) was used as positive control. f Whole cell lysates were extracted from A549 cells transduced with either gene-specific or non-targeting sgRNA. Samples were subjected to SDS-PAGE and western blotting using antibodies against TFEB and Phospho-TFEB (ser211).
Fig. 6
Fig. 6. Loss of WDR7, CCDC115 and TMEM199 prevents IAV nuclear entry.
a Immunofluorescence staining of A549 cells transduced with either gene-specific or non-targeting sgRNA with DQ-green bovine serum albumin (BSA) and Lysotracker red. Cells were treated with 20ug/ml DQ-BSA and Lysotracker red for 1 h at 37 °C followed by fixation to monitor uptake and hydrolysis of the DQ-BSA. DQ-BSA staining was quantified by dividing total fluorescence intensity by the number of cells in each frame. Bar graph shows the relative fluorescence intensity between different sgRNAs. Scale bar = 20 μm. Error bars represent standard deviation from three randomly chosen frames. b Immunofluorescent staining of A549 cells transduced with either gene-specific or non-targeting sgRNA with FITC-conjugated anti-H1N1 NP antibody. Cells were infected with PR8 virus at MOI 500 for 2 h at 37 °C. Scale bar = 15 μm. c Fold change in viral NP RNA level relative to GAPDH measured by qRT-PCR. A549 cells transduced with gene-specific or non-targeting sgRNA were infected with either influenza H3N2 Udorn or X31 virus at MOI 5 for 16 h. Fold change was normalized to viral NP RNA level in A549 cells transduced with non-targeting sgRNA. Error bars represent standard deviations from three independent experimental replicates. ***P < 0.001 and *P < 0.05, by one-way ANOVA test.
Fig. 7
Fig. 7. Loss of CMTR1 inhibits viral replication and up-regulates anti-viral genes.
a A549 cells transduced with gene-specific or non-targeting sgRNAs were transfected with PR8 PA, PB1, PB2, and NP plasmids together with green-Renilla and Luciferase reporter plasmids for 24 hours. Luciferase activity was measured and normalized to A549 cells transduced with non-targeting sgRNA. Error bars represent standard deviations from three independent experimental replicates. b A549 cells transduced with CMTR1 or non-targeting sgRNA were infected with PR8 virus, in vivo crosslinked, lysed and immunoprecipitated with either anti-eIF4E or anti-IgG antibody to extract capped cellular and viral RNA. qRT-PCR was performed to monitor the relative abundance of PR8 NP RNA. (Left): Fold change in NP RNA levels normalized to anti-IgG non-targeting sgRNA pulldown. (Right): Fold change in NP relative to GAPDH RNA levels normalized to non-targeting sgRNA. Error bars represent standard deviations from three independent experimental replicates. c Fold change in IFN- β relative to GAPDH mRNA levels measured by qRT-PCR. A549 cells transduced with CMTR1 or non-targeting sgRNA were either mocked treated, infected with PR8 virus or treated with 200 U/ml IFN- β for 16 h. Fold change was normalized to A549 cells transduced with non-targeting sgRNA. Error bars represent standard deviations from three independent experimental replicates. d Gene Ontology (GO) enrichment analysis showing the top 10 up-regulated gene categories in A549 cells transduced with CMTR1 sgRNA versus non-targeting sgRNA after PR8 virus infection. IFN-related and antiviral gene categories are colored in red. e Fold change in IFN- β relative to GAPDH mRNA levels measured by qRT-PCR. A549 cells were transduced with CMTR1 sgRNA alone or together with sgRNA targeting RIG-I, MAV or IRF3 and infected with PR8 virus. Fold change was normalized to cells transduced with non-targeting sgRNA. Error bars represent standard deviations from three independent experimental replicates. f A549 cells transduced with gene-specific or non-targeting sgRNA were pre-treated with 0, 1, 5 or 10 nM of Baloxavir followed by PR8 virus infection. Y-axis shows the percentage of HA-positive cells normalized to untreated cells. Error bars represent standard deviations from three independent experimental replicates. ****P = 0.0001, **P < 0.01, by one-way ANOVA test.

References

    1. Shrestha S. S., Swerdlow D. L., Borse R. H., Prabhu V. S., Finelli L., Atkins C. Y., Owusu-Edusei K., Bell B., Mead P. S., Biggerstaff M., Brammer L., Davidson H., Jernigan D., Jhung M. A., Kamimoto L. A., Merlin T. L., Nowell M., Redd S. C., Reed C., Schuchat A., Meltzer M. I. Estimating the Burden of 2009 Pandemic Influenza A (H1N1) in the United States (April 2009-April 2010) Clinical Infectious Diseases. 2010;52(Supplement 1):S75–S82. doi: 10.1093/cid/ciq012. - DOI - PubMed
    1. Simonsen Lone, Spreeuwenberg Peter, Lustig Roger, Taylor Robert J., Fleming Douglas M., Kroneman Madelon, Van Kerkhove Maria D., Mounts Anthony W., Paget W. John. Global Mortality Estimates for the 2009 Influenza Pandemic from the GLaMOR Project: A Modeling Study. PLoS Medicine. 2013;10(11):e1001558. doi: 10.1371/journal.pmed.1001558. - DOI - PMC - PubMed
    1. Gao R, et al. Human Infection with a Novel Avian-Origin Influenza A (H7N9) Virus. N. Engl. J. Med. 2013;368:1888–1897. doi: 10.1056/NEJMoa1304459. - DOI - PubMed
    1. Webster RG, Govorkova EA. H5N1 influenza–continuing evolution and spread. N. Engl. J. Med. 2006;355:2174–2177. doi: 10.1056/NEJMp068205. - DOI - PubMed
    1. Yen HL, Webster RG. Pandemic influenza as a current threat. Curr. Top. Microbiol. Immunol. 2009;333:3–24. - PubMed

Publication types

MeSH terms