

Modelling photovoltaic soiling losses through optical characterization
- PMID: 31919401
- PMCID: PMC6952442
- DOI: 10.1038/s41598-019-56868-z
Modelling photovoltaic soiling losses through optical characterization
Abstract
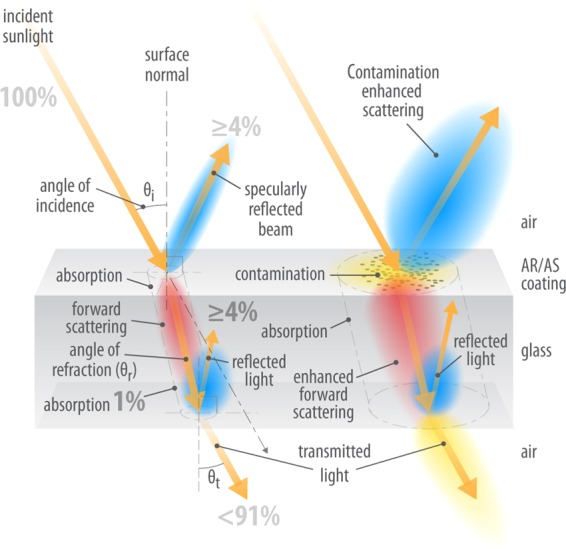
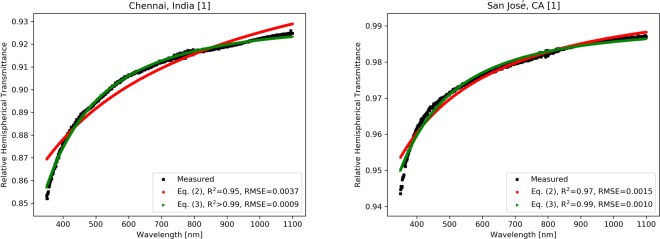
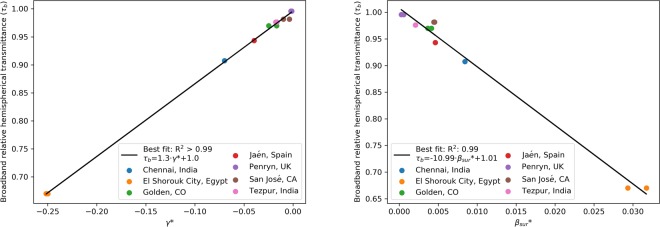
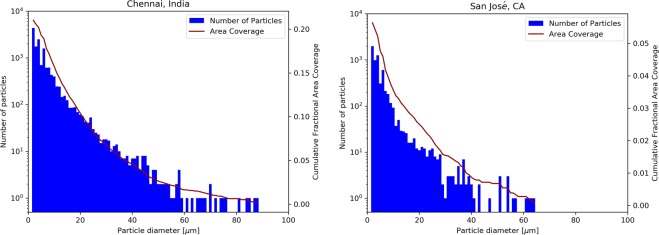
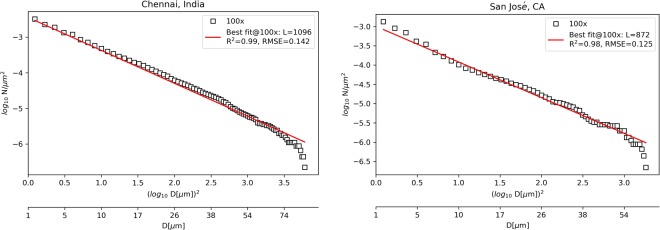
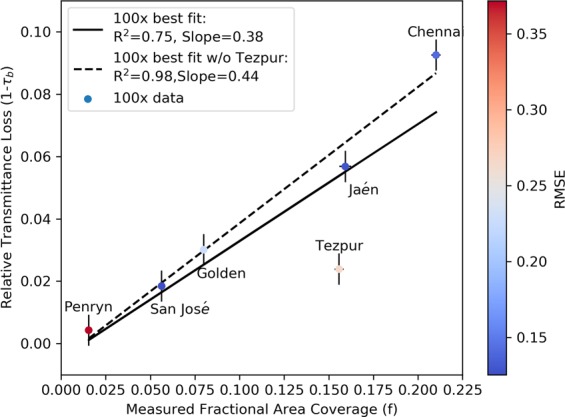
The accumulation of soiling on photovoltaic (PV) modules affects PV systems worldwide. Soiling consists of mineral dust, soot particles, aerosols, pollen, fungi and/or other contaminants that deposit on the surface of PV modules. Soiling absorbs, scatters, and reflects a fraction of the incoming sunlight, reducing the intensity that reaches the active part of the solar cell. Here, we report on the comparison of naturally accumulated soiling on coupons of PV glass soiled at seven locations worldwide. The spectral hemispherical transmittance was measured. It was found that natural soiling disproportionately impacts the blue and ultraviolet (UV) portions of the spectrum compared to the visible and infrared (IR). Also, the general shape of the transmittance spectra was similar at all the studied sites and could adequately be described by a modified form of the Ångström turbidity equation. In addition, the distribution of particles sizes was found to follow the IEST-STD-CC 1246E cleanliness standard. The fractional coverage of the glass surface by particles could be determined directly or indirectly and, as expected, has a linear correlation with the transmittance. It thus becomes feasible to estimate the optical consequences of the soiling of PV modules from the particle size distribution and the cleanliness value.
Conflict of interest statement
The authors declare no competing interests.
Figures

References
-
- Sarver T, Al-Qaraghuli A, Kazmerski LL. A comprehensive review of the impact of dust on the use of solar energy: History, investigations, results, literature, and mitigation approaches. Renew. Sustain. Energy Rev. 2013;22:698–733. doi: 10.1016/j.rser.2012.12.065. - DOI
-
- Costa SCS, Diniz ASAC, Kazmerski LL. Dust and soiling issues and impacts relating to solar energy systems: Literature review update for 2012–2015. Renew. Sustain. Energy Rev. 2016;63:33–61. doi: 10.1016/j.rser.2016.04.059. - DOI
-
- Simpson, L. J. et al. NREL efforts to address soiling on PV modules. In 2017 IEEE 44th Photovoltaic Specialist Conference (PVSC) (IEEE, 2017).
-
- Gostein, M., Duster, T. & Thuman, C. Accurately measuring PV soiling losses with soiling station employing module power measurements. In IEEE 42nd Photovoltaic Specialist Conference (PVSC) (2015).
Publication types
LinkOut - more resources
Full Text Sources
Other Literature Sources
Research Materials
