. 2020 Jun;18(3):365-375.
doi: 10.1007/s12021-019-09446-7.

A Rational Approach to Understanding and Evaluating Responsive Neurostimulation

Affiliations

A Rational Approach to Understanding and Evaluating Responsive Neurostimulation

Nathaniel D Sisterson et al. Neuroinformatics. 2020 Jun.

Abstract

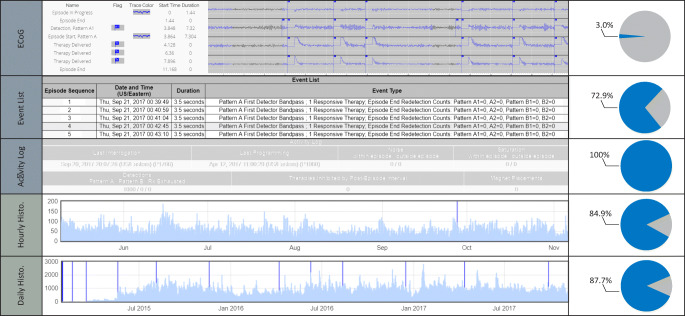
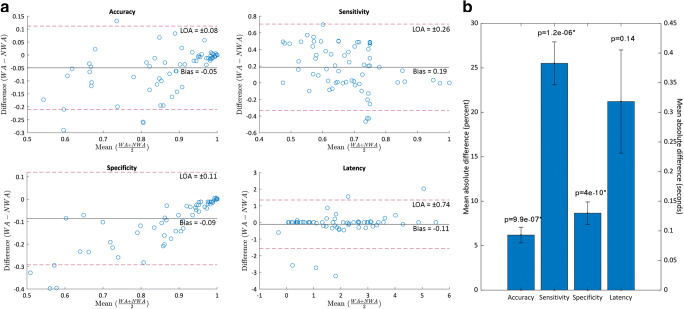
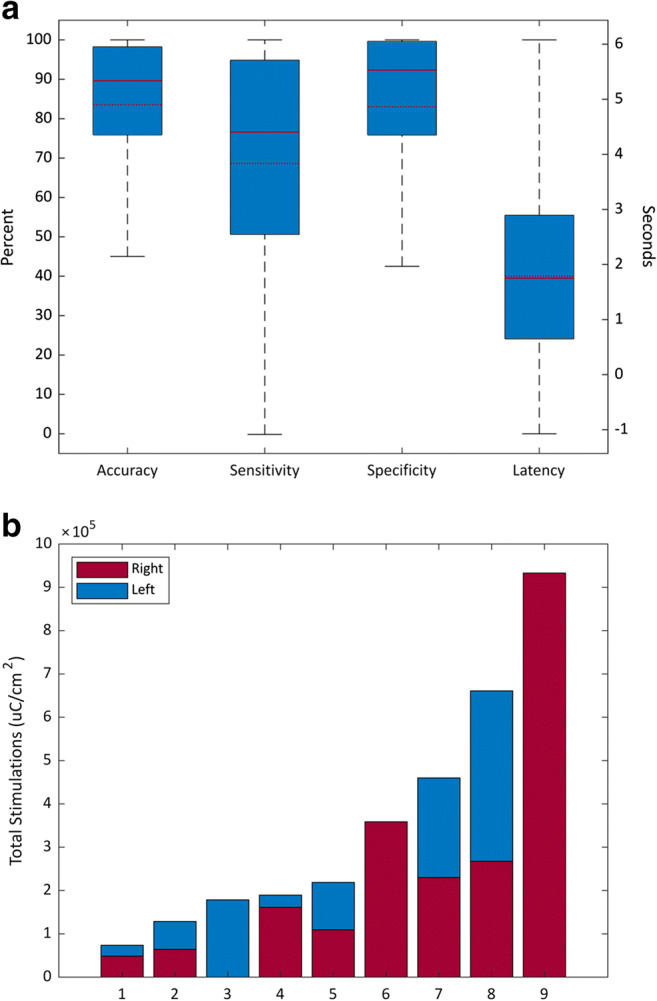
Closed-loop brain stimulation is increasingly used in level 4 epilepsy centers without an understanding of how the device behaves on a daily basis. This lack of insight is a barrier to improving closed-loop therapy and ultimately understanding why some patients never achieve seizure reduction. We aimed to quantify the accuracy of closed-loop seizure detection and stimulation on the RNS device through extrapolating information derived from manually reviewed ECoG recordings and comprehensive device logging information. RNS System event logging data were obtained, reviewed, and analyzed using a custom-built software package. A weighted-means methodology was developed to adjust for bias and incompleteness in event logs and evaluated using Bland-Altman plots and Wilcoxon signed-rank tests to compare adjusted and non-weighted (standard method) results. Twelve patients implanted for a mean of 21.5 (interquartile range 13.5-31) months were reviewed. The mean seizure frequency reduction post-RNS implantation was 40.1% (interquartile range 0-96.2%). Three primary levels of event logging granularity were identified (ECoG recordings: 3.0% complete (interquartile range 0.3-1.8%); Event Lists: 72.9% complete (interquartile range 44.7-99.8%); Activity Logs: 100% complete; completeness measured with respect to Activity Logs). Bland-Altman interpretation confirmed non-equivalence with unpredictable differences in both magnitude and direction. Wilcoxon signed rank tests demonstrated significant (p < 10-6) differences in accuracy, sensitivity, and specificity at >5% absolute mean difference for extrapolated versus standard results. Device behavior logged by the RNS System should be used in conjunction with careful review of stored ECoG data to extrapolate metrics for detector performance and stimulation.

Keywords: Closed-loop; Device configuration; Drug-resistant epilepsy; Extrapolation; Neuromodulation; Seizure detection.


Figures

Fig. 1
Fig. 1
Flow diagram of data loading, pre-processing, manual review, and calculations using the BRAINStim© platform. a Data crucial to the analysis of RNS System performance are loaded from the PDMS using a custom C#.NET HTML parsing tool. b Raw ECoG data, along with hardware diagnostic information, are loaded from files provided by NeuroPace. c ECoG data are sorted into groups by programming epoch, which are exported as .EDF files. d ECoG data are manually reviewed, and EIP onset and laterality are annotated. All data are imported back into the database and merged with the original files. e Weighted calculation scripts are executed on the database. f The results of the scripts are loaded back into the database and used to generate figures, as well as to facilitate further analysis
Fig. 2
Fig. 2
Levels of RNS System detailed and summary logging. Completeness of each source of logging information relative to the Activity Log, which is the most complete but least detailed logging source, is shown in pie charts. Representative screen captures of the NeuroPace PDMS provide a basic reference of the primary sources of logging data used to perform our analyses. Logging data (top) comes from the Reports tab for ECoG recordings (most detailed) and the interrogation Event List and Activity Log (most complete); additional summary data (bottom) comes from the Neurostimulator History tab for daily and hourly histogram data
Fig. 3
Fig. 3
a Bland–Altman plots. For weighted accuracy, there was a negative bias with significant dispersion, and a slight positive trend between the mean and difference, with greater scatter as the mean decreases. For weighted latency, there was a negative bias with minimal dispersion, and some scattering at all values. For weighted sensitivity, there was a positive bias with significant dispersion and no clear trend, but with less scatter above a mean of 80%. For weighted specificity, there was a negative bias moderate dispersion from the bias with a positive trend between mean and difference, with greater scatter as the mean decreases. b Absolute mean difference of standard and weighted calculations. Accuracy, sensitivity, and specificity all have statistically, as well as clinically significant differences (defined as a difference of >5%) in extrapolated versus standard calculations. The difference between extrapolated and standard latency calculations was not statistically significant
Fig. 4
Fig. 4
a Boxplots of mean, median, 25th and 75th percentiles, and range of accuracy, sensitivity, specificity, and latency. Wide interquartile ranges for accuracy, sensitivity, and specificity (left axis), with disagreement between the mean (dashed) and median (solid), revealing a heterogeneous and widely distributed differences in device behavior between patients. Latency (right axis) has a relatively narrower interquartile range, a wide range still exists. b Total stimulation per patient at 8.5 months post-implant. There is significant variability in the rate at which stimulation therapy is delivered between patients, with some patients receiving greater than 10 times the amount, or dosage, as others. For patients with a bilateral lead configuration, the rate at which stimulation therapy is delivered to the left and right hemispheres can be uneven, as well

References

    1. Banerjee PN, Filippi D, Hauser WA. The descriptive epidemiology of epilepsy - a review. Epilepsy Research. 2009;85(1):31–45. doi: 10.1016/j.eplepsyres.2009.03.003.The. - DOI - PMC - PubMed
    1. Baud MO, Kleen JK, Mirro EA, Andrechak JC, King-Stephens D, Chang EF, Rao VR. Multi-day rhythms modulate seizure risk in epilepsy. Nature Communications. 2018;9(1):88. doi: 10.1038/s41467-017-02577-y. - DOI - PMC - PubMed
    1. Berg AT, Berkovic SF, Brodie MJ, Buchhalter J, Cross JH, Van Emde Boas W, et al. Revised terminology and concepts for organization of seizures and epilepsies: Report of the ILAE commission on classification and terminology, 2005-2009. Epilepsia. 2010;51(4):676–685. doi: 10.1111/j.1528-1167.2010.02522.x. - DOI - PubMed
    1. Bergey GK, Morrell MJ, Mizrahi EM, Goldman A, King-Stephens D, Nair D, et al. Long-term outcomes of treatment with responsive brain stimulation in adults with refractory partial seizures. Neurology. 2015;84(8):810–817. doi: 10.1212/WNL.0000000000001280. - DOI - PMC - PubMed
    1. Bland JM, Altman DG. Statistical methods for assessing agreement between two methods of clinical measurement. Lancet (London, England) 1986;1(8476):307–310. doi: 10.1016/S0140-6736(86)90837-8. - DOI - PubMed