. 2020 Nov;16(11):2069-2083.
doi: 10.1080/15548627.2020.1714209. Epub 2020 Jan 16.

Autophagy-dependent ferroptosis drives tumor-associated macrophage polarization via release and uptake of oncogenic KRAS protein

Affiliations

Autophagy-dependent ferroptosis drives tumor-associated macrophage polarization via release and uptake of oncogenic KRAS protein

Enyong Dai et al. Autophagy. 2020 Nov.

Abstract

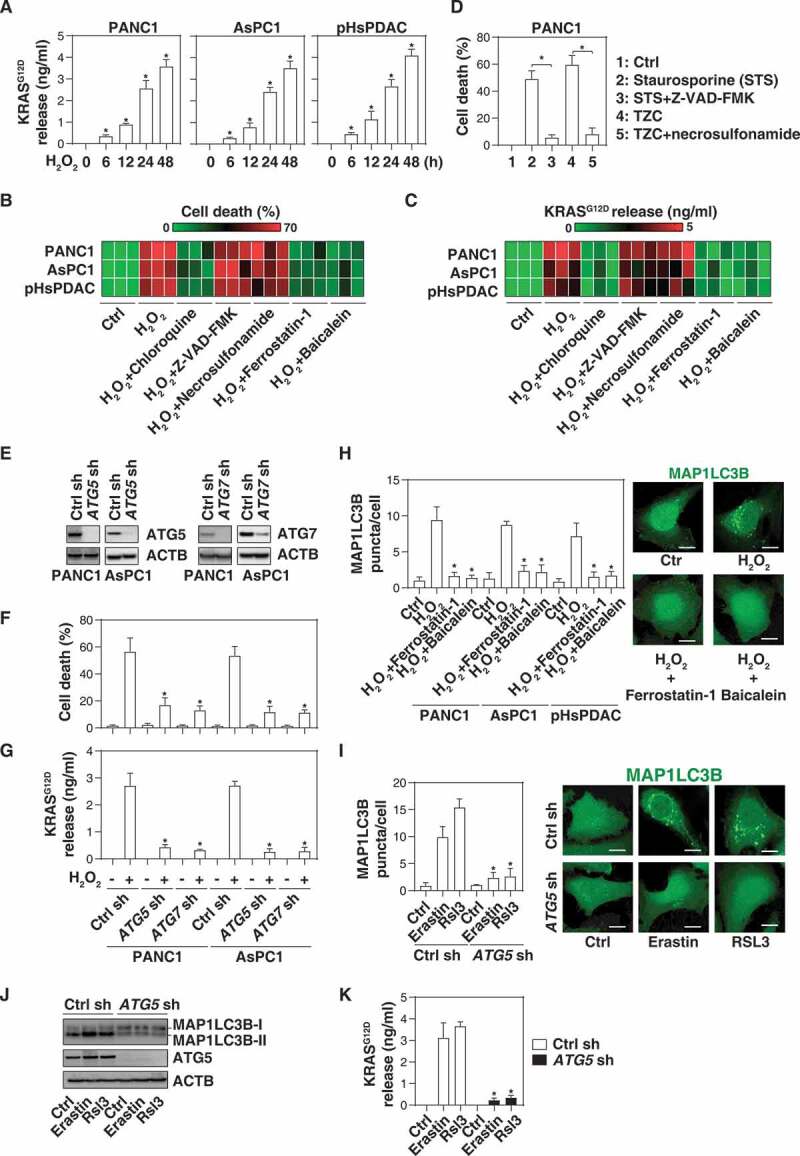
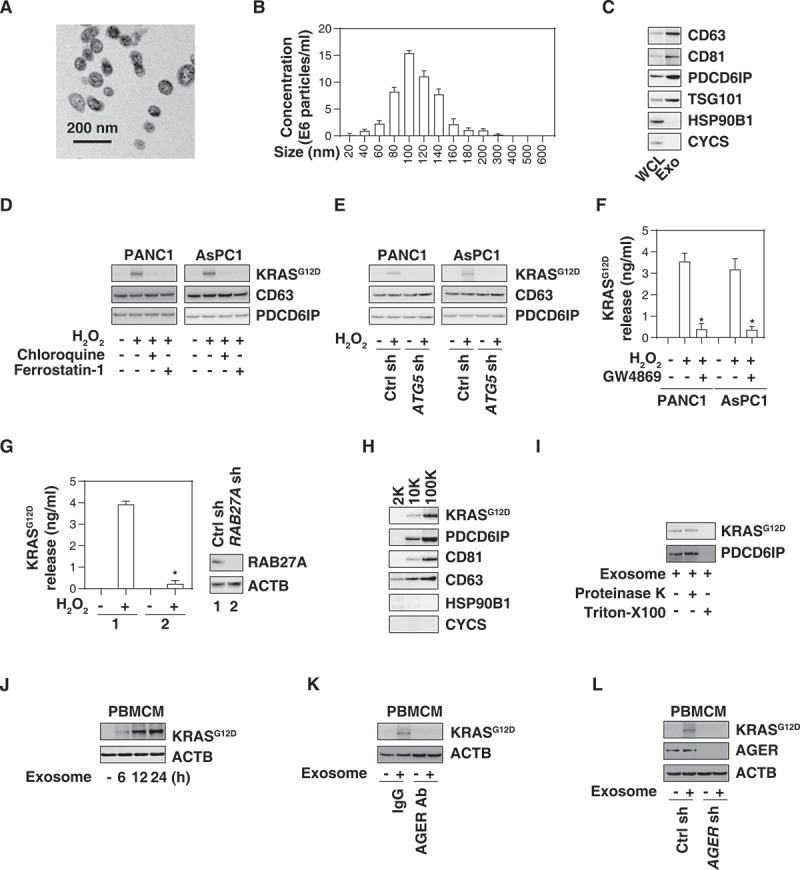
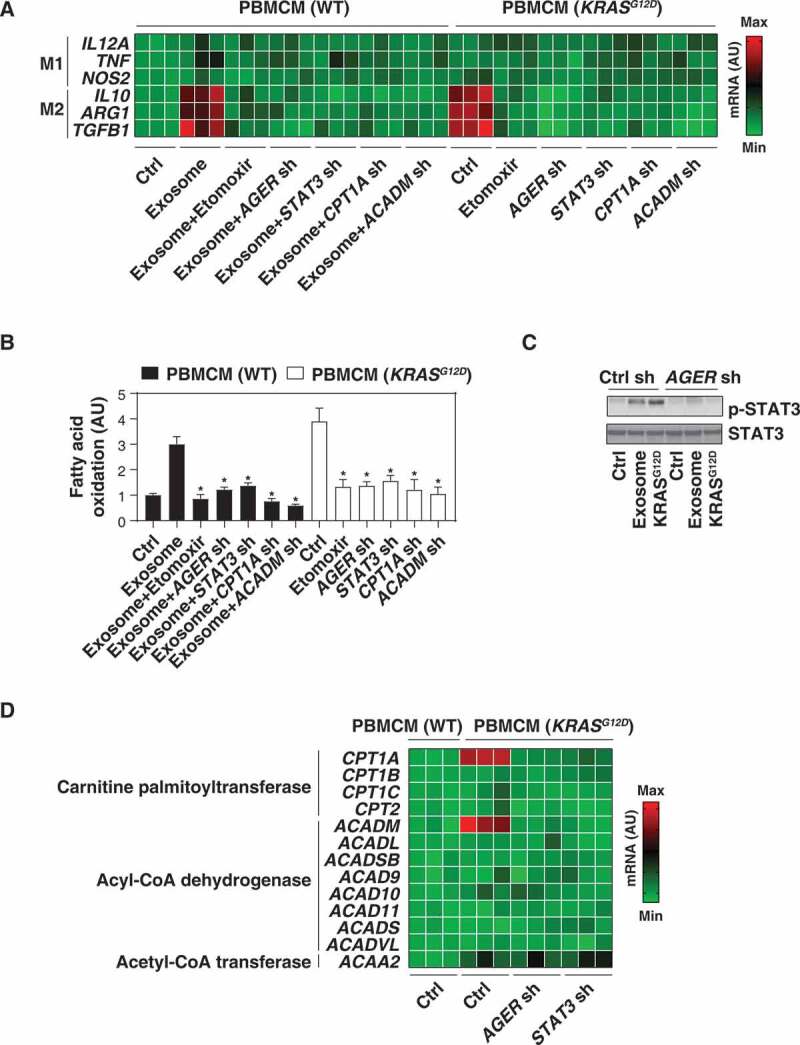
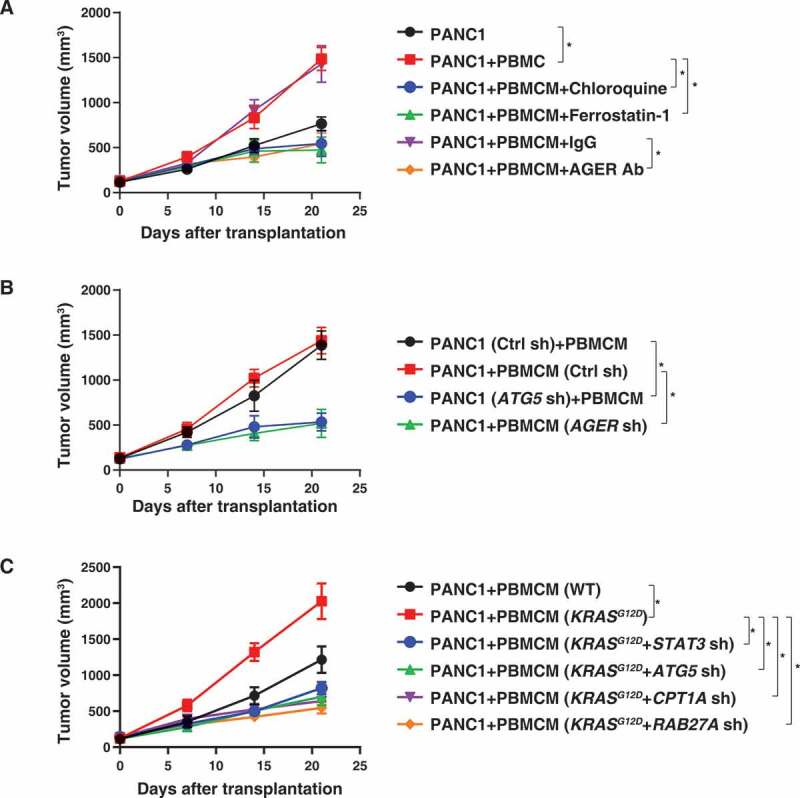
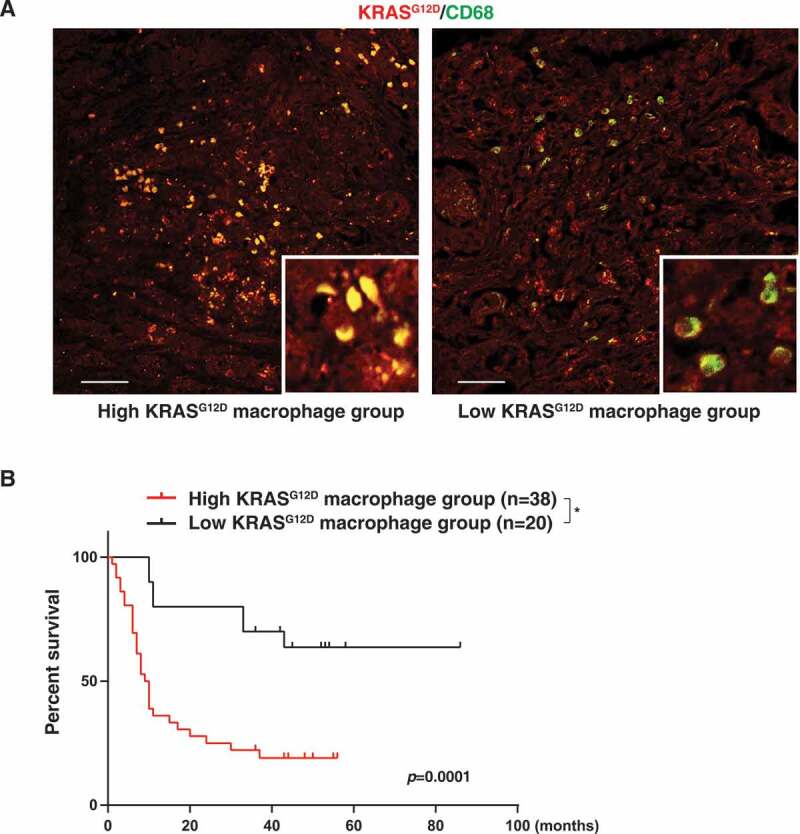
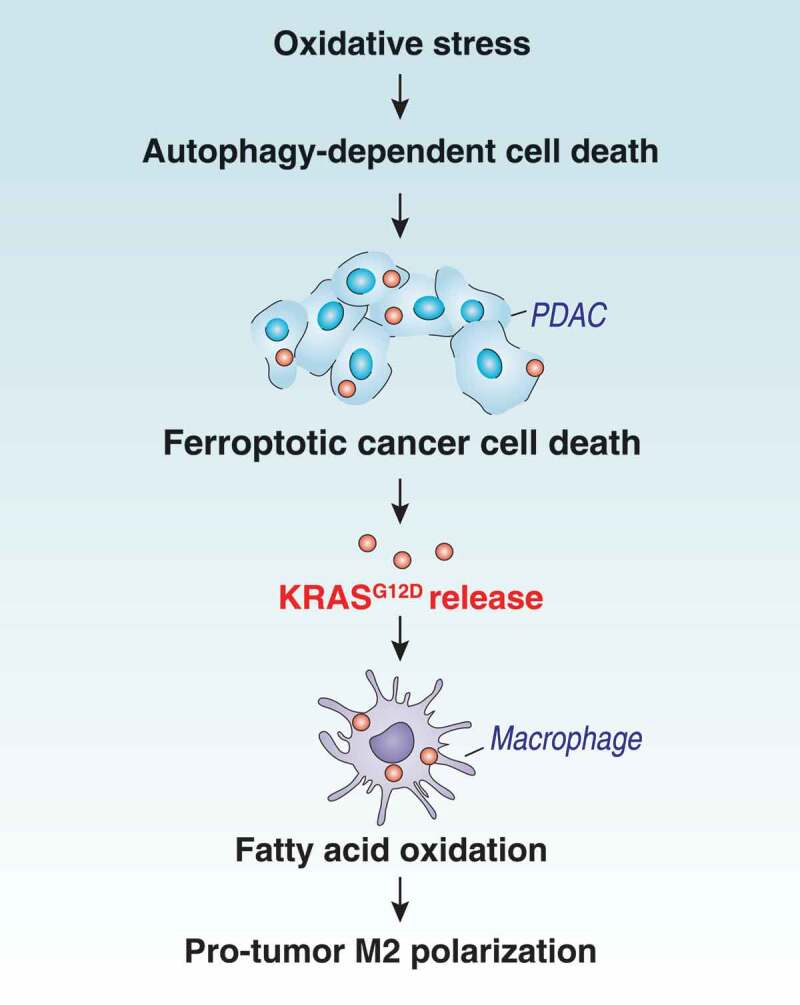
KRAS is the most frequently mutated oncogene in human neoplasia. Despite a large investment to understand the effects of KRAS mutation in cancer cells, the direct effects of the oncogenetic KRAS activation on immune cells remain elusive. Here, we report that extracellular KRASG12D is essential for pancreatic tumor-associated macrophage polarization. Oxidative stress induces KRASG12D protein release from cancer cells succumbing to autophagy-dependent ferroptosis. Extracellular KRASG12D packaged into exosomes then is taken up by macrophages through an AGER-dependent mechanism. KRASG12D causes macrophages to switch to an M2-like pro-tumor phenotype via STAT3-dependent fatty acid oxidation. Consequently, the disruption of KRASG12D release and uptake can abolish the macrophage-mediated stimulation of pancreatic adenocarcinomas in mouse models. Importantly, the level of KRASG12D expression in macrophages correlates with poor survival in pancreatic cancer patients. These findings not only identify extracellular KRASG12D as a key mediator of cancer cell-macrophage communication, but also provide a novel KRAS-targeted anticancer strategy. Abbreviations: DAMP, damage-associated molecular pattern; PBMCMs, peripheral blood mononuclear cell-derived macrophages; PDAC, pancreatic ductal adenocarcinoma; s.c., subcutaneously; TAMs, tumor-associated macrophages; TME, tumor microenvironment.

Keywords: DAMP; KRAS; autophagy; exosomes; ferroptosis; macrophage.


Conflict of interest statement

No potential conflict of interest was reported by the authors.

Figures

Figure 1.
Figure 1.
The extracellular release of KRASG12D during autophagy-dependent ferroptotic cancer cell death. (A) The indicated human PDAC cells were treated with H2O2 (500 µM) for 6–48 h and the level of KRASG12D in the supernatants was assayed as described in the Materials and Methods (n = 3, *P < 0.05 versus control group). (B, C) Heat map of levels of cell death (B) and KRASG12D release (C) in the indicated PDAC cells following treatment with H2O2 (500 µM) in the absence or presence of chloroquine (50 µM), Z-VAD-FMK (20 µM), necrosulfonamide (1 µM), ferrostatin-1 (1 µM), or baicalein (10 µM) for 24 h (n = 3). (D) Analysis of cell death in PANC1 cells following treatment with staurosporine (1 µM) or TNF (50 nM) + Z-VAD-FMK (20 µM) + cycloheximide (10 µg/ml) (TZC) in the absence or presence of Z-VAD-FMK (20 µM) or necrosulfonamide (1 µM) for 24 h (n = 3, *P < 0.05). (E) Western blot analysis of protein expression of ATG5 or ATG7 in the indicated PDAC cells. (F, G) Cell death (F) and KRASG12D release (G) in the indicated PDAC cells following H2O2 (500 µM) treatment for 24 h (n = 3, *P < 0.05 versus control shRNA group). (H) MAP1LC3B puncta in the indicated PDAC cells following H2O2 (500 µM) treatment in the absence or presence of ferrostatin-1 (1 µM) or baicalein (10 µM) for 24 h (10–15 random fields, *P < 0.05 versus H2O2 group). Representative images of MAP1LC3B staining in PANC1 cells are shown in the right panel. Bar: 10 µm. (I) MAP1LC3B puncta in control and ATG5-knockdown PANC1 cells following treatment with erastin (10 µM) or RSL3 (0.5 µM) for 24 h (10–15 random fields, *P < 0.05 versus control group). Representative images of MAP1LC3B staining are shown in the right panel. Bar: 10 µm. (J) Western blot analysis of protein expression in the indicated PANC1 cells following treatment with erastin (10 µM) or RSL3 (0.5 µM) for 24 h. (K) The level of extracellular KRASG12D in the indicated PANC1 cells following treatment with erastin (10 µM) or RSL3 (0.5 µM) for 24 h (n = 3, *P < 0.05 versus control group)
Figure 2.
Figure 2.
AGER is required for exosome uptake of KRASG12D by macrophages. (A) Transmission electron microscopy image of the exosomes isolated from PANC1 cells. (B) nanoparticle tracking analysis for the exosomes isolated from PANC1 cells. (C) Western blot analysis of exosome markers in PANC1 cells. CD63, CD81, PDCD6IP/ALIX, and TSG101 are used as exosome markers, and HSP90B1/GRP9 and CYCS are used as markers of cellular contamination. WCL, whole cell lysate; Exo, exosome. (D) Western blot analysis of KRASG12D, CD63, and PDCD6IP/ALIX expression in isolated exosomes from PDAC cells following treatment with H2O2 (500 µM) in the absence or presence of chloroquine (50 µM) or ferrostatin-1 (1 µM) for 24 h. (E) Western blot analysis of KRASG12D, CD63, and PDCD6IP/ALIX expression in isolated exosomes from wild-type and ATG5-knockdown PDAC cells following treatment with H2O2 (500 µM) for 24 h. (F) Analysis of KRASG12D release in the supernatant in PDAC cells following treatment with H2O2 (500 µM) in the absence or presence of GW4869 (10 µM) for 24 h (n = 3, *P < 0.05 versus H2O2 group). (G) Analysis of KRASG12D release in the supernatant in wild-type and RAB27A-knockdown PANC1 cells following treatment with H2O2 (500 µM) for 24 h (n = 3, *P < 0.05 versus wild-type group). (H) Western blot analysis of indicated protein expression in the successive pellets (2K, 10K, and 100K) of extracellular vesicles isolated from H2O2-treated PANC1 cells. (I) Proteinase protection assay of 100K pellets in the absence or presence of proteinase K (1 mg/mL) or 1% Triton X-100 for 30 min at 37°C. (J) Western blot analysis of KRASG12D and ACTB expression in PBMCMs following treatment with 100 μg/ml exosomes isolated from H2O2 (500 µM, 24 h)-treated PANC1 cells for 6–24 h. (K) Western blot analysis of KRASG12D and ACTB expression in PBMCMs following treatment with 100 μg/ml exosomes isolated from H2O2 (500 µM)-treated PANC1 cells in the absence or presence of AGER Ab (50 µg/ml) and control IgG (50 µg/ml) for 24 h. (L) Western blot analysis of KRASG12D and ACTB expression in wild-type and AGER-knockdown PBMCMs following treatment with 100 μg/ml exosomes isolated from H2O2 (500 µM)-treated PANC1 for 24 h
Figure 3.
Figure 3.
KRASG12D promotes macrophage M2 polarization via STAT3-dependent fatty acid oxidation. (A) Heat map of mRNA expression of M1 and M2 genes in the indicated wild-type (WT) or KRASG12D-driven PBMCMs in the absence or presence of exosomes (100 μg/ml) or etomoxir (5 µM) for 24 h. (B) Analysis of fatty acid oxidation level in WT or KRASG12D-driven PBMCMs in the absence or presence of exosomes (100 μg/ml) or etomoxir (5 µM) for 24 h. (C) Western blot analysis of STAT3 and p-STAT3 expression in the indicated PBMCMs with or without KRASG12D transfection or exosome treatment (100 μg/ml) for 24 h. (D) Heat map of mRNA expression of fatty acid oxidation-related genes in indicated WT or KRASG12D-driven PBMCMs
Figure 4.
Figure 4.
Blocking KRASG12D release and uptake suppresses macrophage-mediated pancreatic tumor growth in vivo. (A) NOD SCID mice were injected subcutaneously (s.c.) with PANC1 cells (7 × 106) or PANC1 cells (5 × 106) plus PBMCMs (2 × 106) and treated with chloroquine (50 mg/kg, s.c., twice a week), ferrostatin-1 (50 mg/kg, s.c., twice a week), anti-AGER antibody (10 mg/kg, s.c., twice a week) or control IgG (10 mg/kg, s.c., twice a week). Tumor volume was calculated weekly (n = 5 mice/group, *P < 0.05, ANOVA LSD test). (B, C) NOD SCID mice were injected s.c. with the indicated gene knockdown PANC1 cells (5 × 106) plus wild-type or KRASG12D-driven PBMCMs (2 × 106). Tumor volume was calculated weekly (n = 5 mice/group, *P < 0.05, ANOVA LSD test)
Figure 5.
Figure 5.
High KRASG12D expression in macrophages correlates with poor survival in PDAC patients. (A) Representative images of KRASG12D (red) and CD68 (green) staining in PDAC tissues. Bar: 100 µm. (B) Comparative survival analysis of KRASG12D expression in macrophages in PDAC patients (*P = 0.0001, log-rank test)
Figure 6.
Figure 6.
Schematic depicting autophagy-dependent ferroptosis driving tumor-associated macrophage polarization via the release and uptake of oncogenic KRASG12D

References

    1. Binnewies M, Roberts EW, Kersten K, et al. Understanding the tumor immune microenvironment (TIME) for effective therapy. Nat Med. 2018;24:541–550. - PMC - PubMed
    1. Wellenstein MD, de Visser KE.. Cancer-cell-intrinsic mechanisms shaping the tumor immune landscape. Immunity. 2018;48:399–416. - PubMed
    1. Simanshu DK, Nissley DV, McCormick F, et al. Their regulators in human disease. Cell. 2017;170:17–33. - PMC - PubMed
    1. Pylayeva-Gupta Y, Grabocka E, Bar-Sagi D.. RAS oncogenes: weaving a tumorigenic web. Nat Rev Cancer. 2011;11:761–774. - PMC - PubMed
    1. Waters AM, Der CJ.. KRAS: the critical driver and therapeutic target for pancreatic cancer. Cold Spring Harb Perspect Med. 2018;8:a031435. - PMC - PubMed

Publication types

Substances