. 2019 Dec 5:13:1312.
doi: 10.3389/fnins.2019.01312. eCollection 2019.

Electrical Stimulation in the Human Cochlea: A Computational Study Based on High-Resolution Micro-CT Scans

Affiliations

Electrical Stimulation in the Human Cochlea: A Computational Study Based on High-Resolution Micro-CT Scans

Siwei Bai et al. Front Neurosci. .

Abstract

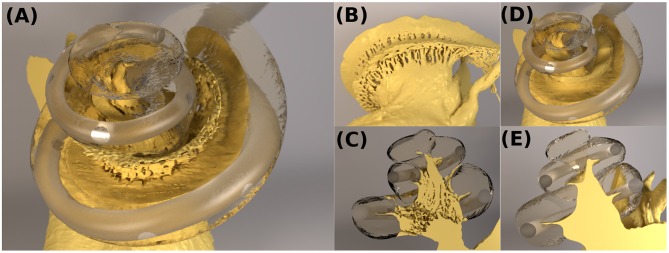
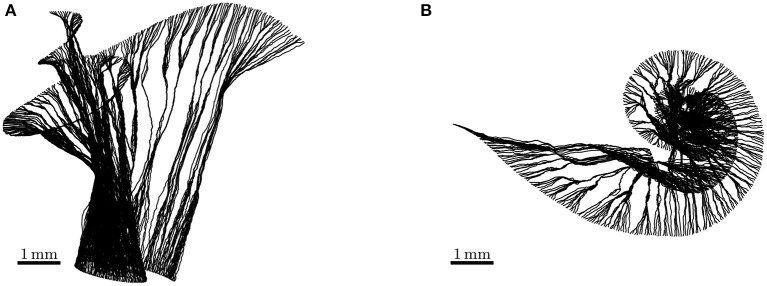
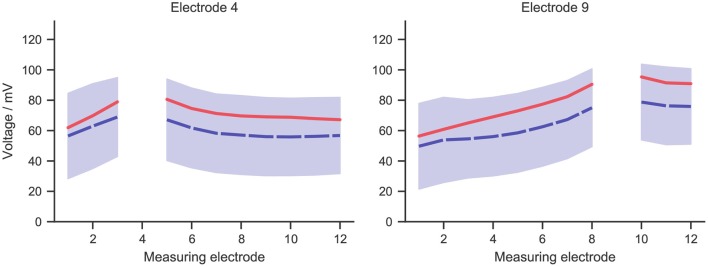
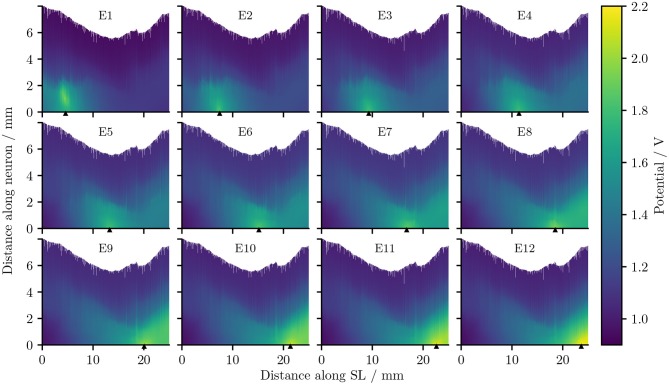
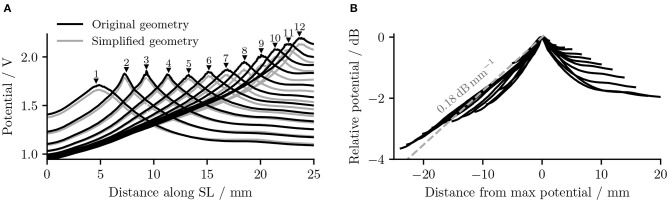
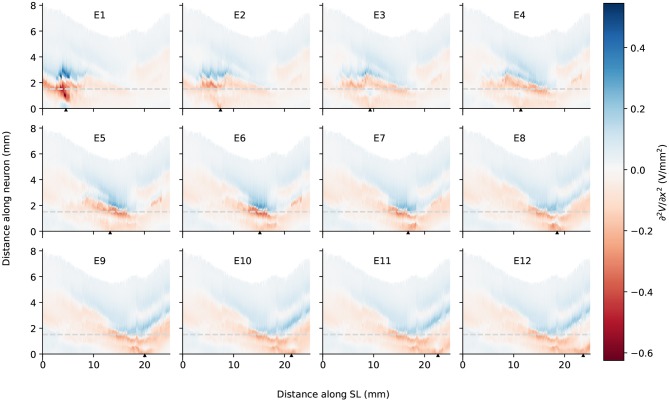
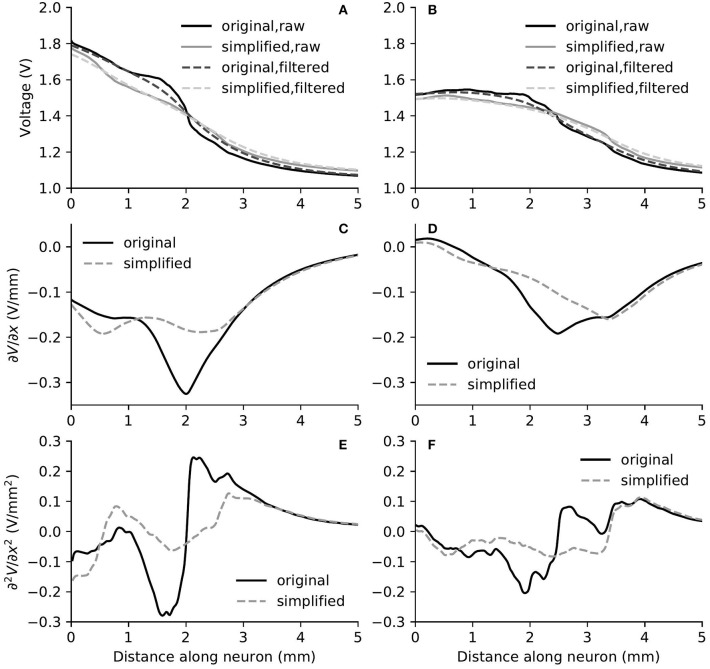
Background: Many detailed features of the cochlear anatomy have not been included in existing 3D cochlear models, including the microstructures inside the modiolar bone, which in turn determines the path of auditory nerve fibers (ANFs). Method: We captured the intricate modiolar microstructures in a 3D human cochlea model reconstructed from μCT scans. A new algorithm was developed to reconstruct ANFs running through the microstructures within the model. Using the finite element method, we calculated the electrical potential as well as its first and second spatial derivatives along each ANF elicited by the cochlear implant electrodes. Simulation results of electrical potential was validated against intracochlear potential measurements. Comparison was then made with a simplified model without the microstructures within the cochlea. Results: When the stimulus was delivered from an electrode located deeper in the apex, the extent of the auditory nerve influenced by a higher electric potential grew larger; at the same time, the maximal potential value at the auditory nerve also became larger. The electric potential decayed at a faster rate toward the base of the cochlea than toward the apex. Compared to the cochlear model incorporating the modiolar microstructures, the simplified version resulted in relatively small differences in electric potential. However, in terms of the first and second derivatives of electric potential along the fibers, which are relevant for the initiation of action potentials, the two models exhibited large differences: maxima in both derivatives with the detailed model were larger by a factor of 1.5 (first derivative) and 2 (second derivative) in the exemplary fibers. More importantly, these maxima occurred at different locations, and opposite signs were found for the values of second derivatives between the two models at parts along the fibers. Hence, while one model predicts depolarization and spike initiation at a given location, the other may instead predict a hyperpolarization. Conclusions: Although a cochlear model with fewer details seems sufficient for analysing the current spread in the cochlear ducts, a detailed-segmented cochlear model is required for the reconstruction of ANF trajectories through the modiolus, as well as the prediction of firing thresholds and spike initiation sites.

Keywords: auditory nerve fibers; cochlear implant; computational model; electrical stimulation; finite element analysis; model reconstruction.


Figures

Figure 1
Figure 1
Illustration of the procedures to reconstruct the FE cochlear model from μCT scans of a piece of human cadaveric temporal bone. (Flowchart reconstruction both FE and nerve—JE). Illustration of the procedures to reconstruct the auditory nerve fibers in the auditory nerve: (1) find the shortest path through the FE Mesh; (2) select sub-volume surrounding the mesh, and remesh the sub-volume to find a new shortest path; (3) generate a multi-compartment model based on the fiber trajectory.
Figure 2
Figure 2
(A–C) The cochlear model “ORI” with a detailed-segmented auditory nerve geometry; (D,E) The cochlear model “SIM” with a simplified nerve model, whose fine details through the Rosenthal's canals were removed.
Figure 3
Figure 3
Side view (A) and top view (B) of auditory nerve fibers reconstructed from the detailed-segmented auditory nerve in the cochlear model “ORI.” Their lengths range from 5.520 to 8.151 mm.
Figure 4
Figure 4
The mean (dashed blue line) and standard deviation (blue zone) of intracochlear potential measurement data for two exemplary electrodes: 4 and 9. The solid red line represents data from the simulation, whose stimulating current was adjusted to the same value as in the measurement, i.e., 50 μA.
Figure 5
Figure 5
The electrical potentials along the reconstructed fibers within the detailed-segmented cochlear model. The stimulating electrode for each plot is specified at the top, and its location along the edge of spiral lamina is marked by the black solid triangles on the x-axis. “SL” stands for the outer edge of osseous spiral lamina.
Figure 6
Figure 6
(A) The electrical potentials (in absolute value) along the edge of the spiral lamina within the “original” detailed-segmented and “simplified” cochlear models. The number and the black solid triangle above each potential line, respectively, specify the stimulating electrode used and its location along the spiral lamina to produce this specific line. “SL” stands for the outer edge of osseous spiral lamina. (B) The normalized electrical potentials along the edge of the spiral lamina within the original detailed-segmented model. Each potential line was normalized to its maximal value.
Figure 7
Figure 7
The second spatial derivative of electrical potential along the fiber direction within the detailed-segmented cochlear model. The stimulating electrode for each plot is specified at the top, and its location along the edge of spiral lamina is marked by the black solid triangles on the x-axis. The gray line in each plot indicates the soma location. “SL” stands for the outer edge of osseous spiral lamina.
Figure 8
Figure 8
The electric potential (A,B), as well as the first (C,D) and second (E,F) derivatives of filtered electric potential along the fiber direction for two example fibers (truncated at 5 mm) within the “original” detailed-segmented and “simplified” cochlear models, when the stimulating electrode was E3. The electric potential (A), first (C) and second (E) derivatives on the left column were taken from the fiber 9.31 mm on the spiral lamina away from the base, which was also the closest fiber to the stimulating electrode. The electric potential (B), first (D) and second (F) derivatives on the right column were taken from the fiber 12.44 mm away from the base.
Figure 9
Figure 9
The electric potential (A,B), as well as the first (C,D) and second (E,F) derivatives of filtered electric potential along the fiber direction for two example fibers (truncated at 5 mm) within the “original” detailed-segmented and “simplified” cochlear models, when the stimulating electrode was E5. The electric potential (A), first (C) and second (E) derivatives on the left column were calculated on the fiber 13.27 mm on the spiral lamina away from the base, which was also the closest fiber to the stimulating electrode. The electric potential (B), first (D) and second (F) derivatives on the right column were calculated on the fiber 10.15 mm away from the base.
Figure 10
Figure 10
The second spatial derivative of electrical potential along the fiber direction within the simplified cochlear model. The stimulating electrode for each plot is specified at the top, and its location along the edge of spiral lamina is marked by the black solid triangles on the x-axis. The gray line in each plot indicates the soma location. “SL” stands for the outer edge of osseous spiral lamina.

References

    1. Arnesen A. R., Osen K. K. (1978). The cochlear nerve in the cat: topography, cochleotopy, and fiber spectrum. J. Compar. Neurol. 178, 661–678. 10.1002/cne.901780405 - DOI - PubMed
    1. Bachmaier R., Encke J., Obando-Leitón M., Hemmert W., Bai S. (2019). Comparison of multi-compartment cable models of human auditory nerve fibers. Front. Neurosci. 13:1173. 10.3389/fnins.2019.01173 - DOI - PMC - PubMed
    1. Bai S., Loo C., Al Abed A., Dokos S. (2012). A computational model of direct brain excitation induced by electroconvulsive therapy: comparison among three conventional electrode placements. Brain Stimul. 5, 408–421. 10.1016/j.brs.2011.07.004 - DOI - PubMed
    1. Braun K., Böhnke F., Stark T. (2012). Three-dimensional representation of the human cochlea using micro-computed tomography data: presenting an anatomical model for further numerical calculations. Acta Oto-Laryngol. 132, 603–613. 10.3109/00016489.2011.653670 - DOI - PubMed
    1. Briaire J. J., Frijns J. H. (2000). Field patterns in a 3D tapered spiral model of the electrically stimulated cochlea. Hear. Res. 148, 18–30. 10.1016/S0378-5955(00)00104-0 - DOI - PubMed