. 2019 Dec 10:13:72.
doi: 10.3389/fninf.2019.00072. eCollection 2019.

Identifying Vulnerable Brain Networks in Mouse Models of Genetic Risk Factors for Late Onset Alzheimer's Disease

Affiliations

Identifying Vulnerable Brain Networks in Mouse Models of Genetic Risk Factors for Late Onset Alzheimer's Disease

Alexandra Badea et al. Front Neuroinform. .

Abstract

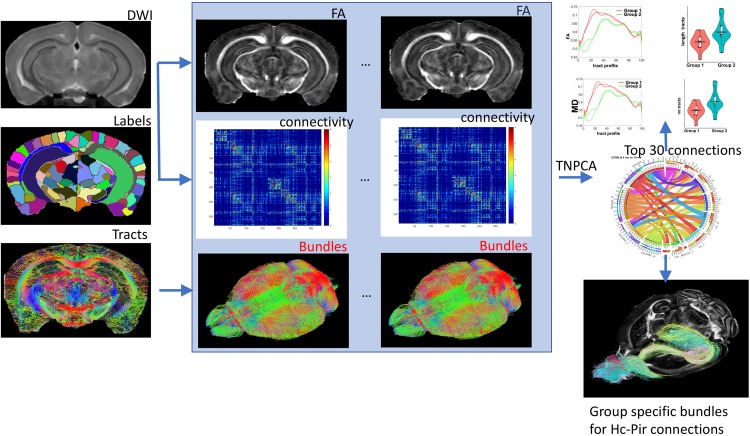
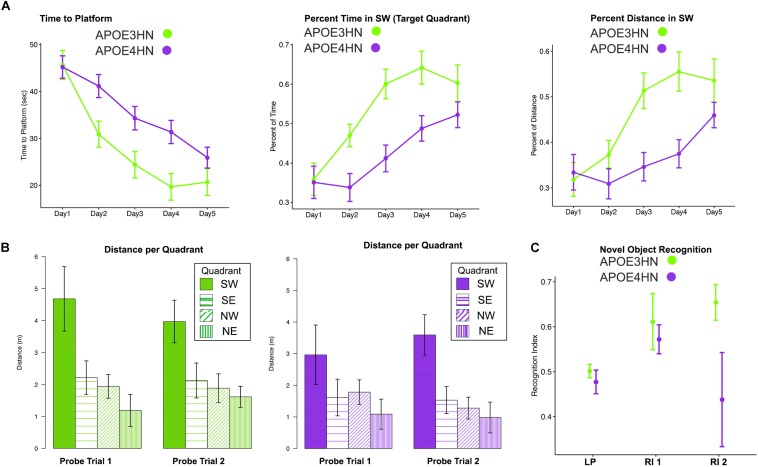
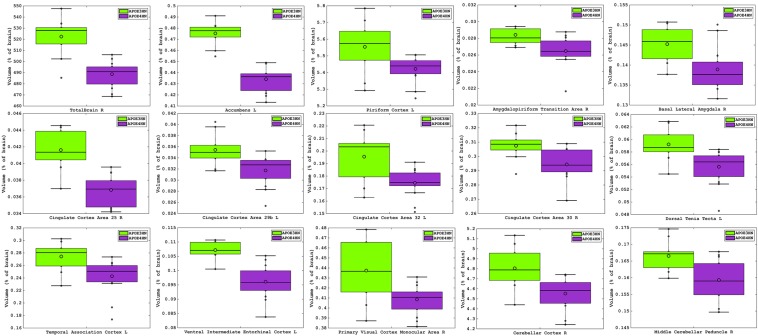
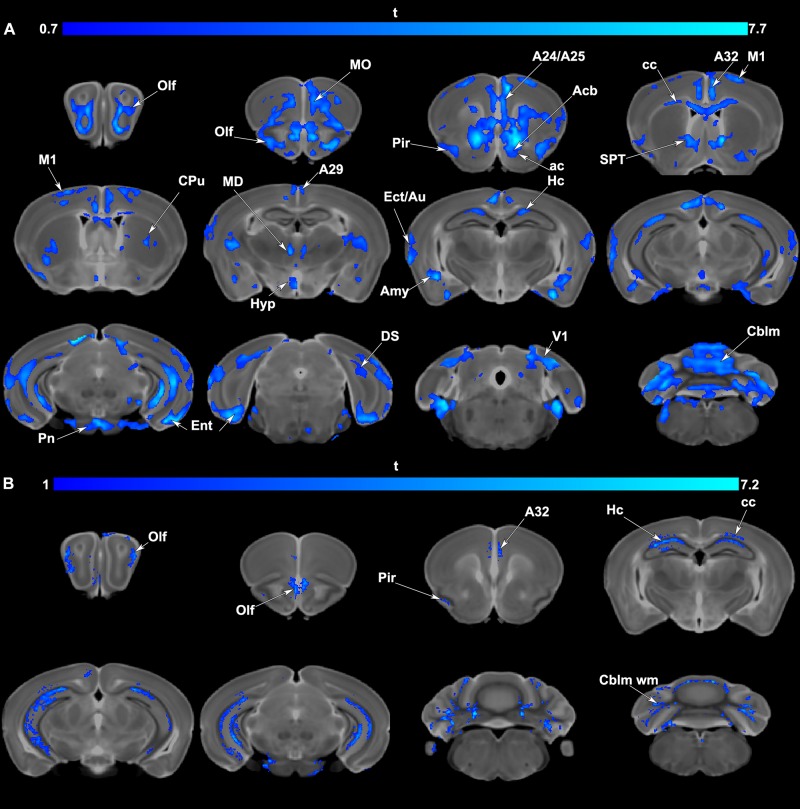
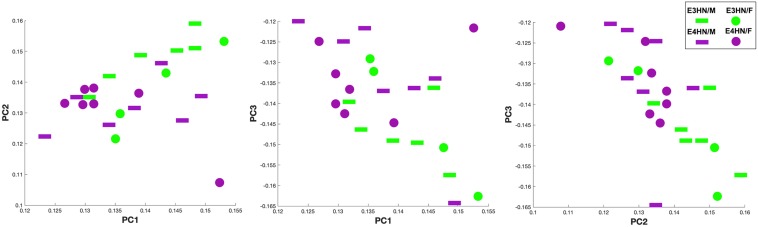
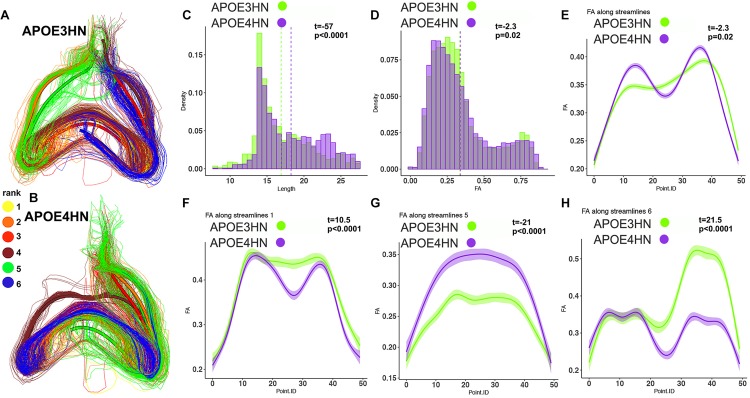
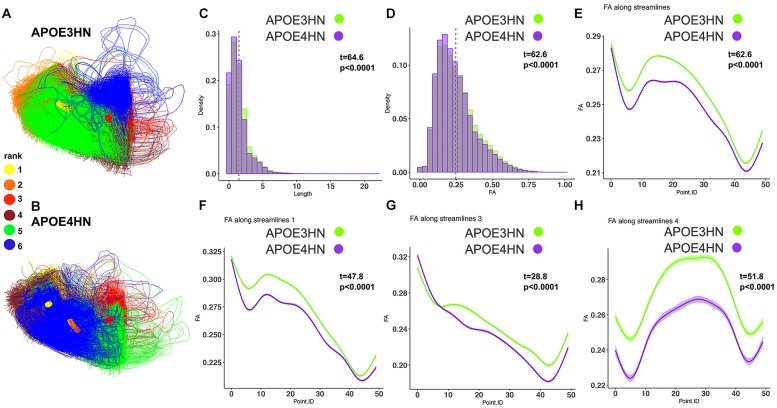
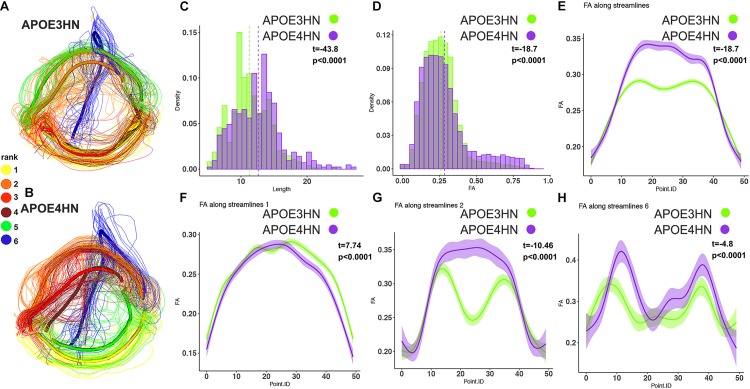
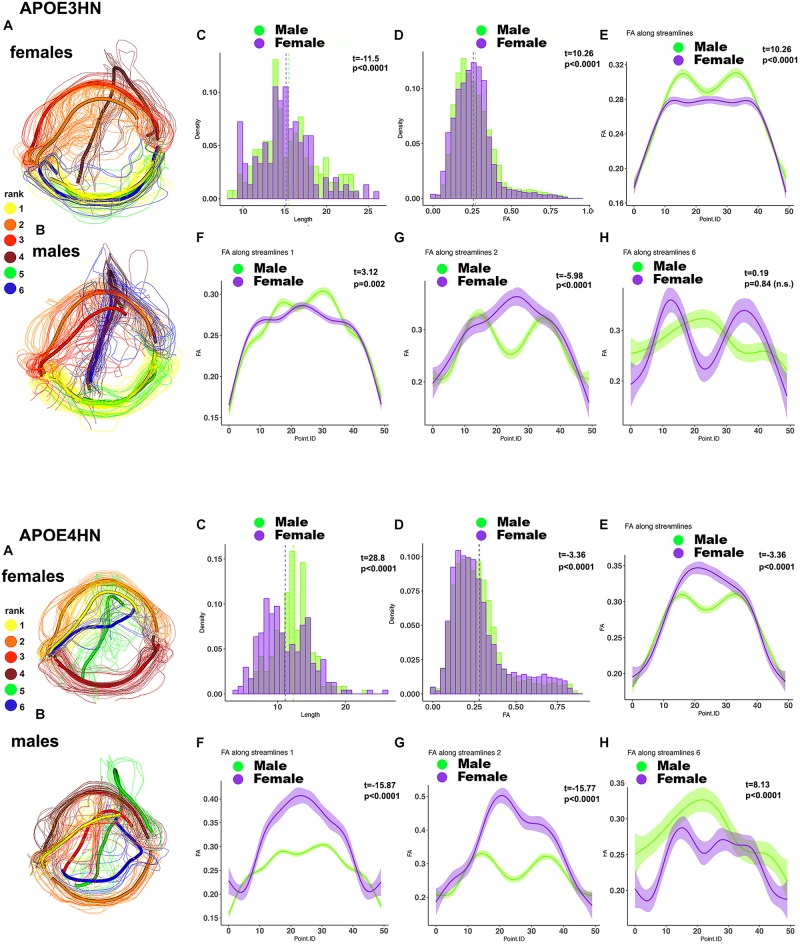
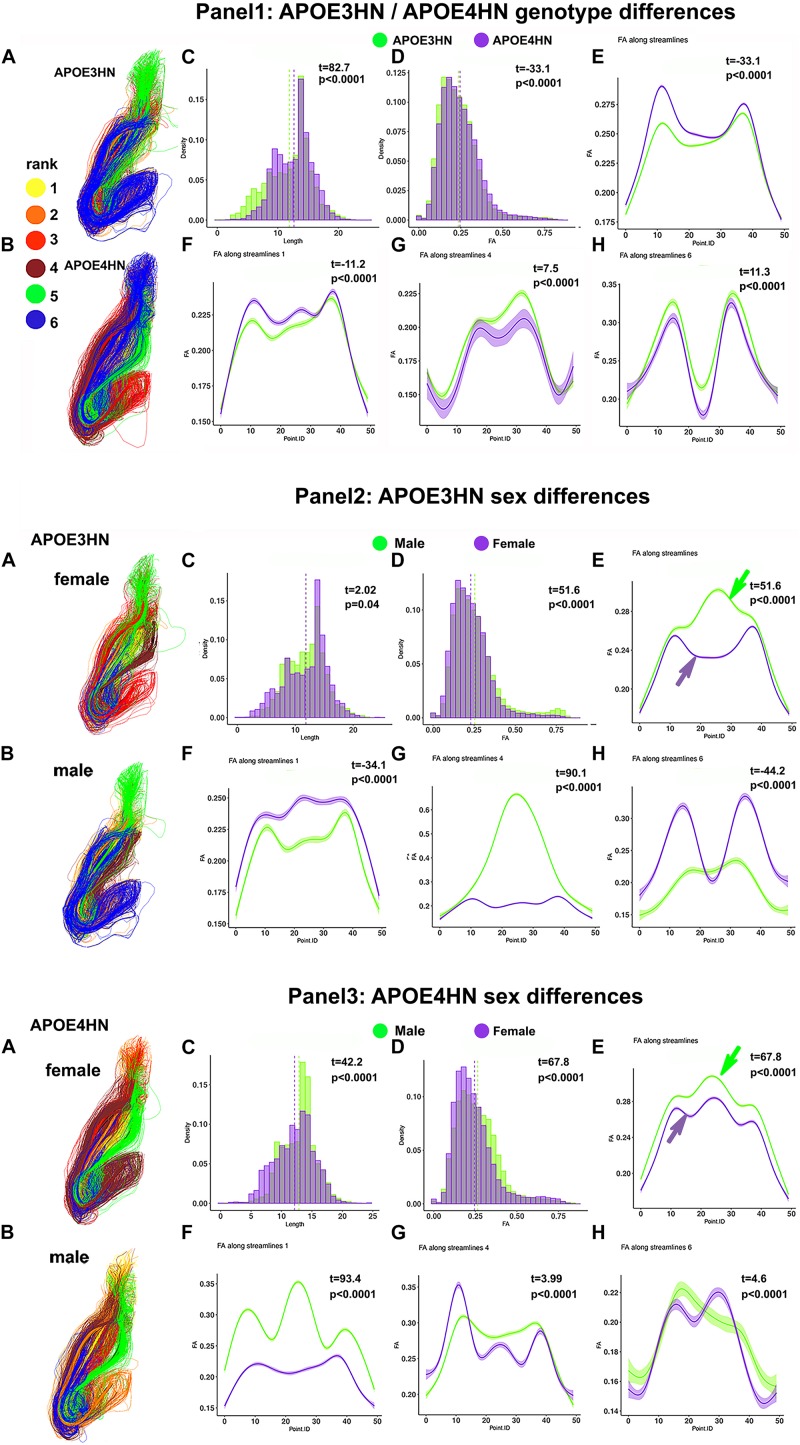
The major genetic risk for late onset Alzheimer's disease has been associated with the presence of APOE4 alleles. However, the impact of different APOE alleles on the brain aging trajectory, and how they interact with the brain local environment in a sex specific manner is not entirely clear. We sought to identify vulnerable brain circuits in novel mouse models with homozygous targeted replacement of the mouse ApoE gene with either human APOE3 or APOE4 gene alleles. These genes are expressed in mice that also model the human immune response to age and disease-associated challenges by expressing the human NOS2 gene in place of the mouse mNos2 gene. These mice had impaired learning and memory when assessed with the Morris water maze (MWM) and novel object recognition (NOR) tests. Ex vivo MRI-DTI analyses revealed global and local atrophy, and areas of reduced fractional anisotropy (FA). Using tensor network principal component analyses for structural connectomes, we inferred the pairwise connections which best separate APOE4 from APOE3 carriers. These involved primarily interhemispheric connections among regions of olfactory areas, the hippocampus, and the cerebellum. Our results also suggest that pairwise connections may be subdivided and clustered spatially to reveal local changes on a finer scale. These analyses revealed not just genotype, but also sex specific differences. Identifying vulnerable networks may provide targets for interventions, and a means to stratify patients.

Keywords: Alzheimer’s disease; diffusion tensor (DT) MRI; magnetic resonance imaging; morphometric; mouse model; neurodegeneration; tract based analysis; tractography.


Figures

FIGURE 1
FIGURE 1
The main elements of our flowchart for characterizing differences between mouse models based on connectivity included image reconstructions and coregistration of individual DWI acquisitions, brain parcelation in 332 regions, and connectome reconstruction based on a constant solid angle method. TNPCA was used to derive subgraphs discriminating two genotypes and the resulting selected pairwise connections between nodes were analyzed for tract length and FA differences. The hippocampus-piriform connections are shown as an example. Hc: hippocampus; Pir: piriform cortex.
FIGURE 2
FIGURE 2
Main repeated measured ANOVA (RMANOVA) results for the memory testing based on acquisition performance and probe trial results (mean ± SEM) in the Morris Water Maze indicate that both APOE3HN and APOE4HN mice learn but there is a significant effect of genotype for both swim time and swim distance. As swim time and distance to hidden platform decreased, the percentage of time spent and distance swam in the target quadrant increased (A). The probe trials indicated that both genotypes had a preference for the SW target quadrant, but APOE3HN mice spent more time swimming in the SW quadrant than APOE4HN mice in the first probe trial (B). E = northeast, NW = northwest, SE = southeast, SW = southwest (target quadrant). N = 11 APOE3HN, N = 14 APOE4HN mice. (C) A novel object recognition test revealed that animals had equal location preferences (LP), and object recognition indices (RI) 90 min later, however, after 24 h APOE4HN mice had lower recognition indices relative to APOE3HN mice (t = –2.28, p = 0.04). N = 10 APOE3HN, N = 6 APOE4HN mice (some APOE4HN were not be tested to preserve the matched ages for MRI). Data show mean values, and standard error bars.
FIGURE 3
FIGURE 3
Volume atrophy was detected in regions spanning from the rostral to the caudal aspects of the brain, and ranged from 10% for the temporal association cortex, entorhinal and cingulate cortex, down to 2% for the piriform cortex. The visual cortex, accumbens and amygdalo-piriform transition areas were ∼7% smaller and the cerebellum was ∼5% smaller in APOE4HN mice, FDR = 5%.
FIGURE 4
FIGURE 4
(A) Voxel based analyses indicated that volume atrophy occurred in vulnerable regions comprising olfactory/piriform (Olf, Pir) cingulate (A24,25,29, 32), sensory (Ect: ectorhinal, Au: auditory, V1: primary visual cortex) and motor cortex (M1), and the entorhinal cortex (Ent). Deeper gray matter regions with atrophy in APOE4 carriers included the accumbens (Acb), caudate putamen (CPu), hippocampal formation (Hc, subiculum: DS), amygdala (Amy), as well thalamic nuclei (mediodorsal: MD) and the cerebellum (Cblm) and pontine nuclei (Pn). Among white matter tracts the anterior commissure (ac), and corpus callosum (cc) also had areas of atrophy. Results are presented as t maps, FDR cluster-corrected for multiple comparisons, using an initial cluster forming threshold of 0.05 significance, and the whole brain as a mask (blue color). (B) Voxel based analyses indicative of fractional anisotropy (FA) reductions suggested vulnerable brain networks. These included the olfactory (Olf) and in particular the piriform cortex (Pir), cingulate cortex (A32), hippocampus (Hc), and the white matter of the corpus callosum (cc) and cerebellum (Cblm wm). Results are presented as t maps, FDR cluster-corrected for multiple comparisons, using initial cluster forming threshold of 0.05 significance, and the whole brain as a mask (blue color). The DWI minimum deformation average template serves as the background.
FIGURE 5
FIGURE 5
Scatter plot of the top three principal components for the connectome TNPCA analysis. The two genotypes are shown in green: APOE3HN, and purple: APOE4HN. Sex information is also indicated, although sex was not used as a predictor (female: disk, male: bar).
FIGURE 6
FIGURE 6
The piriform cortex-hippocampal interhemispheric connections through the top 6 bundles were ranked according to size (yellow for the first and largest bundle, orange for the second, red for the third, brown for the fourth, green for the fifth, blue for the sixth. The interhemispheric connections appeared stronger in the APOE3HN mice relative to APOE4HN mice (A) and (B), according to the size based ranking for the major sub-bundles. This indicated different connectivity patterns for the two genotypes. Differences in fiber length distributions between the two genotypes are shown in (C), and in FA distributions in (D) using histogram densities. These indicate a slight shift toward longer length (C), but lower FA values in APOE4HN mice, which may suggest dismyelination (D). After establishing spatial correspondence through an affine bundle centroid registration, we detected that differences along the bundle containing all connections between the piriform cortex and hippocampus were not uniform (E). We identified the top 3 sub-bundles accounting for the largest difference between the genotypes (F–H). FA appeared in general lower for APE4HN mice in sections of two of these subbundles (F,H), but higher in one subbundle (G).
FIGURE 7
FIGURE 7
The 2nd ranked connection discriminating between the genotypes involved intrahemispheric cerebellar connections between white and gray matter. APOE4HN (B) showed consistent deficiencies relative to APOE3HN (A) carriers in fiber length and FA distributions (C,D). These differences were evident in whole bundle (E) and subbundle analyses (F–H).
FIGURE 8
FIGURE 8
The interhemispheric hippocampal cerebellar connections showed significant differences between APOE3HN (A) and APOE4HN (B) mice in length (C) and FA (D,E). The top three subbundles with significant differences between genotypes showed lower FA for APOE4HN mice relative to APOE3HN in the largest subbundle (F), but higher FA for the 2nd and 6th spatially matched subbundles (G,H), and also higher variability for the APOE4HN genotype.
FIGURE 9
FIGURE 9
Within genotype, between sex (A: female; B: male) analyses for the hippocampal-cerebellar interhemispheric connections. APOE3HN females had longer connections compared to males and the opposite was true for APOE4HN mice (C). Differences in FA over the whole set of streamlines (D) were subtler in terms of effect sizes, but clearly evident in our along the bundle analysis. APOE3HN males had overall higher FA values than females, and the opposite was true for APOE4HN mice (E). The top subbundles with significant genotype differences (F) had also higher FA for APOE3HN males compared to females (bundle 1), while APOE4HN females had higher FA compared to males. The 2nd ranked bundle showed higher FA in females compared to males of both genotypes, with a more accentuated difference for APOE4HN mice (H). The 3rd ranked subbundle did not show sex differences for APOE3HN mice, while APOE4HN males showed higher FA compared to females of the same genotype.
FIGURE 10
FIGURE 10
Intrahemispheric connections between the hippocampus and piriform cortex. The first panel compares the two genotypes; the second panel compares the two sexes, within the APOE3HN genotype; the third panel compare the two sexes, within the APOE4HN genotype. Fiber length and FA distributions are shown in Panels 1–3, C, D. Qualitatively males of the two genotypes presented more similar, consistent bundle FA shapes, while females showed more variability between the genotypes (panels 2E,3E). Overall, females had lower FA along the entire bundle set in both APOE3HN (panel 2E) and APOE4HN mice (panel 3E). Interestingly, APOE3HN females had larger FA than males for the largest subbundle (panel 2F). However, FA was lower along the same subbundle in APOE4HN females relative to males of the same genotype (panel 3F), and differences were larger relative to those between males and females of APOE3HN genotype. These patterns varied by subbundle, and spatially, along the bundles.

Similar articles

Cited by

References

    1. Anderson R. J., Cook J. J., Delpratt N., Nouls J. C., Gu B., McNamara J. O., et al. (2018a). Small animal multivariate brain analysis (SAMBA) – a high throughput pipeline with a validation framework. Neuroinformatics 17 451–472. - PMC - PubMed
    1. Anderson R. J., Wang N., Cook J. J., Cofer G. P., Dibb R., Johnson G. A., et al. (2018b). A high performance computing cluster implementation of compressed sensing reconstruction for MR histology. Proc. Intl. Soc. Mag. Reson. Med. 26.
    1. Anderson R. J., Cook J. J., Delpratt N. A., Nouls J. C., Gu B., McNamara J. O., et al. (2017). Small Animal multivariate brain analysis (SAMBA): a high throughput pipeline with a validation framework. arXiv[preprint] - PMC - PubMed
    1. Avants B. B., Epstein C. L., Grossman M., Gee J. C. (2008). Symmetric diffeomorphic image registration with cross-correlation: evaluating automated labeling of elderly and neurodegenerative brain. Med. Image Anal. 12 26–41. 10.1016/j.media.2007.06.004 - DOI - PMC - PubMed
    1. Avants B. B., Tustison N. J., Song G., Cook P. A., Klein A., Gee J. C. (2011). A reproducible evaluation of ANTs similarity metric performance in brain image registration. Neuroimage 54 2033–2044. 10.1016/j.neuroimage.2010.09.025 - DOI - PMC - PubMed