Mapping the Effect of Interictal Epileptic Activity Density During Wakefulness on Brain Functioning in Focal Childhood Epilepsies With Centrotemporal Spikes
- PMID: 31920937
- PMCID: PMC6930928
- DOI: 10.3389/fneur.2019.01316
Mapping the Effect of Interictal Epileptic Activity Density During Wakefulness on Brain Functioning in Focal Childhood Epilepsies With Centrotemporal Spikes
Abstract
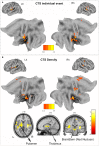
Childhood epilepsy with centrotemporal spikes (CECTS) is the most common type of "self-limited focal epilepsies." In its typical presentation, CECTS is a condition reflecting non-lesional cortical hyperexcitability of rolandic regions. The benign evolution of this disorder is challenged by the frequent observation of associated neuropsychological deficits and behavioral impairment. The abundance (or frequency) of interictal centrotemporal spikes (CTS) in CECTS is considered a risk factor for deficits in cognition. Herein, we captured the hemodynamic changes triggered by the CTS density measure (i.e., the number of CTS for time bin) obtained in a cohort of CECTS, studied by means of video electroencephalophy/functional MRI during quite wakefulness. We aim to demonstrate a direct influence of the diurnal CTS frequency on epileptogenic and cognitive networks of children with CECTS. A total number of 8,950 CTS (range between 27 and 801) were recorded in 23 CECTS (21 male), with a mean number of 255 CTS/patient and a mean density of CTS/30 s equal to 10,866 ± 11.46. Two independent general linear model models were created for each patient based on the effect of interest: "individual CTS" in model 1 and "CTS density" in model 2. Hemodynamic correlates of CTS density revealed the involvement of a widespread cortical-subcortical network encompassing the sensory-motor cortex, the Broca's area, the premotor cortex, the thalamus, the putamen, and red nucleus, while in the CTS event-related model, changes were limited to blood-oxygen-level-dependent (BOLD) signal increases in the sensory-motor cortices. A linear relationship was observed between the CTS density hemodynamic changes and both disease duration (positive correlation) and age (negative correlation) within the language network and the bilateral insular cortices. Our results strongly support the critical role of the CTS frequency, even during wakefulness, to interfere with the normal functioning of language brain networks.
Keywords: BOLD; CECTS; centrotemporal spikes; cognition; epileptic discharges frequency; language network.
Copyright © 2019 Vaudano, Avanzini, Cantalupo, Filippini, Ruggieri, Talami, Caramaschi, Bergonzini, Vignoli, Veggiotti, Guerra, Gessaroli, Santucci, Canevini, Piccolo, Pisani, Gobbi, Dalla Bernardina and Meletti.
Figures


Similar articles
-
Self-limited childhood epilepsies are disorders of the perisylvian communication system, carrying the risk of progress to epileptic encephalopathies-Critical review.Front Neurol. 2023 Jun 14;14:1092244. doi: 10.3389/fneur.2023.1092244. eCollection 2023. Front Neurol. 2023. PMID: 37388546 Free PMC article. Review.
-
Centrotemporal spikes during NREM sleep: The promoting action of thalamus revealed by simultaneous EEG and fMRI coregistration.Epilepsy Behav Case Rep. 2013 Jul 27;1:106-9. doi: 10.1016/j.ebcr.2013.06.005. eCollection 2013. Epilepsy Behav Case Rep. 2013. PMID: 25667840 Free PMC article.
-
Persistent abnormalities in Rolandic thalamocortical white matter circuits in childhood epilepsy with centrotemporal spikes.Epilepsia. 2020 Nov;61(11):2500-2508. doi: 10.1111/epi.16681. Epub 2020 Sep 18. Epilepsia. 2020. PMID: 32944938 Free PMC article.
-
The natural history of seizures and neuropsychiatric symptoms in childhood epilepsy with centrotemporal spikes (CECTS).Epilepsy Behav. 2020 Feb;103(Pt A):106437. doi: 10.1016/j.yebeh.2019.07.038. Epub 2019 Oct 20. Epilepsy Behav. 2020. PMID: 31645314 Free PMC article.
-
The perisylvian epileptic network. A unifying concept.Ideggyogy Sz. 2005 Jan 20;58(1-2):21-31. Ideggyogy Sz. 2005. PMID: 15884395 Review.
Cited by
-
Self-limited childhood epilepsies are disorders of the perisylvian communication system, carrying the risk of progress to epileptic encephalopathies-Critical review.Front Neurol. 2023 Jun 14;14:1092244. doi: 10.3389/fneur.2023.1092244. eCollection 2023. Front Neurol. 2023. PMID: 37388546 Free PMC article. Review.
-
Sleep and Epilepsy Link by Plasticity.Front Neurol. 2020 Aug 28;11:911. doi: 10.3389/fneur.2020.00911. eCollection 2020. Front Neurol. 2020. PMID: 32982931 Free PMC article.
-
Spike-induced cytoarchitectonic changes in epileptic human cortex are reduced via MAP2K inhibition.Brain Commun. 2024 Apr 29;6(3):fcae152. doi: 10.1093/braincomms/fcae152. eCollection 2024. Brain Commun. 2024. PMID: 38741662 Free PMC article.
References
-
- Scheffer IE, French J, Hirsch E, Jain S, Mathern GW, Moshé SL, et al. . Classification of the epilepsies: new concepts for discussion and debate-Special report of the ILAE classification task force of the commission for classification and terminology. Epilepsia Open. (2016) 1:37–44. 10.1002/epi4.5 - DOI - PMC - PubMed
LinkOut - more resources
Full Text Sources
Research Materials

