. 2019 Dec 20:10:2814.
doi: 10.3389/fmicb.2019.02814. eCollection 2019.

Quantitation and Comparison of Phenotypic Heterogeneity Among Single Cells of Monoclonal Microbial Populations

Affiliations

Quantitation and Comparison of Phenotypic Heterogeneity Among Single Cells of Monoclonal Microbial Populations

Federica Calabrese et al. Front Microbiol. .

Abstract

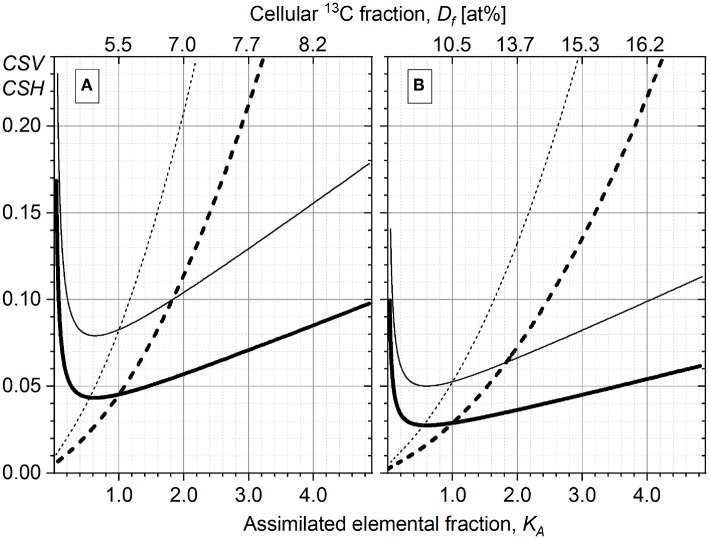
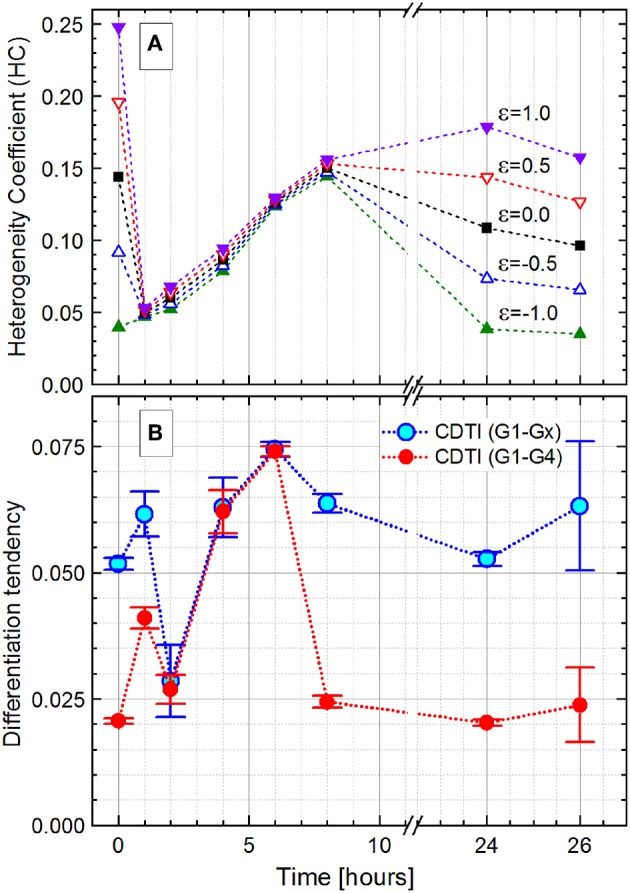
Phenotypic heterogeneity within microbial populations arises even when the cells are exposed to putatively constant and homogeneous conditions. The outcome of this phenomenon can affect the whole function of the population, resulting in, for example, new "adapted" metabolic strategies and impacting its fitness at given environmental conditions. Accounting for phenotypic heterogeneity becomes thus necessary, due to its relevance in medical and applied microbiology as well as in environmental processes. Still, a comprehensive evaluation of this phenomenon requires a common and unique method of quantitation, which allows for the comparison between different studies carried out with different approaches. Consequently, in this study, two widely applicable indices for quantitation of heterogeneity were developed. The heterogeneity coefficient (HC) is valid when the population follows unimodal activity, while the differentiation tendency index (DTI) accounts for heterogeneity implying outbreak of subpopulations and multimodal activity. We demonstrated the applicability of HC and DTI for heterogeneity quantitation on stable isotope probing with nanoscale secondary ion mass spectrometry (SIP-nanoSIMS), flow cytometry, and optical microscopy datasets. The HC was found to provide a more accurate and precise measure of heterogeneity, being at the same time consistent with the coefficient of variation (CV) applied so far. The DTI is able to describe the differentiation in single-cell activity within monoclonal populations resolving subpopulations with low cell abundance, individual cells with similar phenotypic features (e.g., isotopic content close to natural abundance, as detected with nanoSIMS). The developed quantitation approach allows for a better understanding on the impact and the implications of phenotypic heterogeneity in environmental, medical and applied microbiology, microbial ecology, cell biology, and biotechnology.

Keywords: SIP–nanoSIMS; Zipf's law; anabolic activity; flow cytometry; heterogeneity quantitation; multimodality; phenotypic heterogeneity; single-cell resolution.


Figures

Figure 1
Figure 1
Representative sketch for the derivation of distribution width (DW) in the case of skewed distribution.
Figure 2
Figure 2
Counting statistics variation CSVKA (Equation 18, dashed line) and counting statistics heterogeneity CSHKA (Equation 19, solid line) calculated for the 13C isotope fraction Dgs of the growth substrate corresponding to 10 at% (A) and 20 at% (B). Two values of the total carbon ion counts are represented: N = 15 × 103 (thin lines) and N = 5 × 10⁴ (thick lines). The initial isotope ratio Ri = 0.011, corresponding to 1% of 13C cellular abundance, and the CSVRi = 0 are considered.
Figure 3
Figure 3
The histograms of Pseudomonas stutzeri cell distribution in their 13C fraction (Df, A) and their relative assimilation KA (B) plotted at three different time points of incubation with 13C-labeled acetate. The dependence of KA on Df is shown in (A) with the dotted line and right Y-axis-KA. (C) Distribution of Pseudomonas putida cells in relative assimilation KA. The RGB insets show the overlay of 13C14N/12C14N (red), 31P16O2- (green), and 12C14N (blue) acquired with nanoscale secondary ion mass spectrometry (nanoSIMS) at different time points for both bacterial strains.
Figure 4
Figure 4
Rank–activity distribution (bottom X-axis) of Pseudomonas putida single cells after 60 min of incubation with an isotope-labeled growth substrate. The relative assimilation of each single cell is represented in the rank–activity plot with hollow circles. For comparison, the corresponding histogram from Figure 3 was overlaid (top X-axis).
Figure 5
Figure 5
Heterogeneity indices derived for Pseudomonas putida after different incubation times. (A) Comparison of the HCcorr (Equation 21) calculated with different ε values; error bars represent the ΔHCcorr (Equation 21′). (B) Cumulated differentiation tendency index (CDTI) trend of entire populations (represented as S ± ΔS; Equations 27 and 28); error bars show the ±ΔS intervals. (C) CDTI calculated (Equations 27 and 28) for cell subpopulations revealing weak differentiation tendency (WDT) and strong differentiation tendency at low/high KA (low/high SDT).
Figure 6
Figure 6
Heterogeneity indices derived for Pseudomonas stutzeri after different incubation times. (A) Comparison of the HCcorr (Equation 21) calculated with different ε values; error bars represent the ΔHCcorr (Equation 21′). (B) Cumulated differentiation tendency index (CDTI) trend of entire populations (represented as S ± ΔS; Equations 27 and 28); error bars show the ±ΔS intervals. (C) CDTI calculated (Equations 27 and 28) for cell subpopulations revealing weak differentiation tendency (WDT) and strong differentiation tendency at low KA (low SDT).
Figure 7
Figure 7
Heterogeneity dynamics of Pseudomonas putida population during growth over 26 h. (A) DAPI fluorescence intensity (related to DNA content) vs. forward scatter (FSC) intensity (related to cell size) dot plots of the 0-, 2-, 6-, and 24-h samples after data transformation (details about the data transformation and dot plots of the remaining samples in Supplementary Figures S11, S12). (B) Histograms of DAPI fluorescence intensity distribution used to define the boundaries between the subpopulations G1–Gx, which correspond to the chromosome number in the cells. (C) Cells ranked according to their fluorescence intensity (open circles) together with the multicomponent Zipfian fit (solid red line).
Figure 8
Figure 8
Development of the Pseudomonas putida culture heterogeneity over the 26-h growth expressed as the heterogeneity coefficient (HC) with different ε values (Equation 16; A) and cumulated differentiation tendency index (CDTI, B). In (B), CDTIG1−Gx for the entire population and CDTIG1−G4 for cells in G1 to G4 subpopulations are represented as S ± ΔS (Equations 27 and 28); because of small ΔS values (ΔS/S ≤ 0.001), the magnified ±ΔS × 500 intervals are shown with the error bars.
Figure 9
Figure 9
The distribution of single cells in their length represented for the different growth conditions reported in Nikolic et al. (2017) with histograms and rank–length plots.
Figure 10
Figure 10
Changes in the single-cell length heterogeneity of Escherichia coli upon the different growth conditions reported in Nikolic et al. (2017). (A) The coefficient of variation (CV) together with the median of cell length [error bars represent the ±median absolute deviation (MAD) interval, Equation (7)]. (B) The heterogeneity coefficient (HC) (Equation 16) calculated with different ε values. (C) The Zipfian slope [differentiation tendency index (DTI)] of the rank–length distributions as s ± Δs (Equation 25); because of small Δs errors (Δs/s ≤ 0.001) obtained with the single-component Zipfian approximation, the magnified ±Δs × 100 intervals are shown with the error bars.

References

    1. Ackermann M. (2015). A functional perspective on phenotypic heterogeneity in microorganisms. Nat. Rev. Microbiol. 13:497. 10.1038/nrmicro3491 - DOI - PubMed
    1. Almendro V., Marusyk A., Polyak K. (2013). Cellular heterogeneity and molecular evolution in cancer. Annu. Rev. Pathol. Mech. Dis. 8, 277–302. 10.1146/annurev-pathol-020712-163923 - DOI - PubMed
    1. Arnoldini M., Vizcarra I. A., Peña-Miller R., Stocker N., Diard M., Vogel V., et al. . (2014). Bistable expression of virulence genes in salmonella leads to the formation of an antibiotic-tolerant subpopulation. PLoS Biol. 12:e1001928. 10.1371/journal.pbio.1001928 - DOI - PMC - PubMed
    1. Avery S. V. (2006). Microbial cell individuality and the underlying sources of heterogeneity. Nat. Rev. Microbiol. 4:577. 10.1038/nrmicro1460 - DOI - PubMed
    1. Balaban N. Q., Merrin J., Chait R., Kowalik L., Leibler S. (2004). Bacterial persistence as a phenotypic switch. Science 305, 1622–1625. 10.1126/science.1099390 - DOI - PubMed

LinkOut - more resources