. 2019 Dec 10:10:2903.
doi: 10.3389/fimmu.2019.02903. eCollection 2019.

Co-expression Networks Identify DHX15 RNA Helicase as a B Cell Regulatory Factor

Affiliations

Co-expression Networks Identify DHX15 RNA Helicase as a B Cell Regulatory Factor

Thiago Detanico et al. Front Immunol. .

Abstract

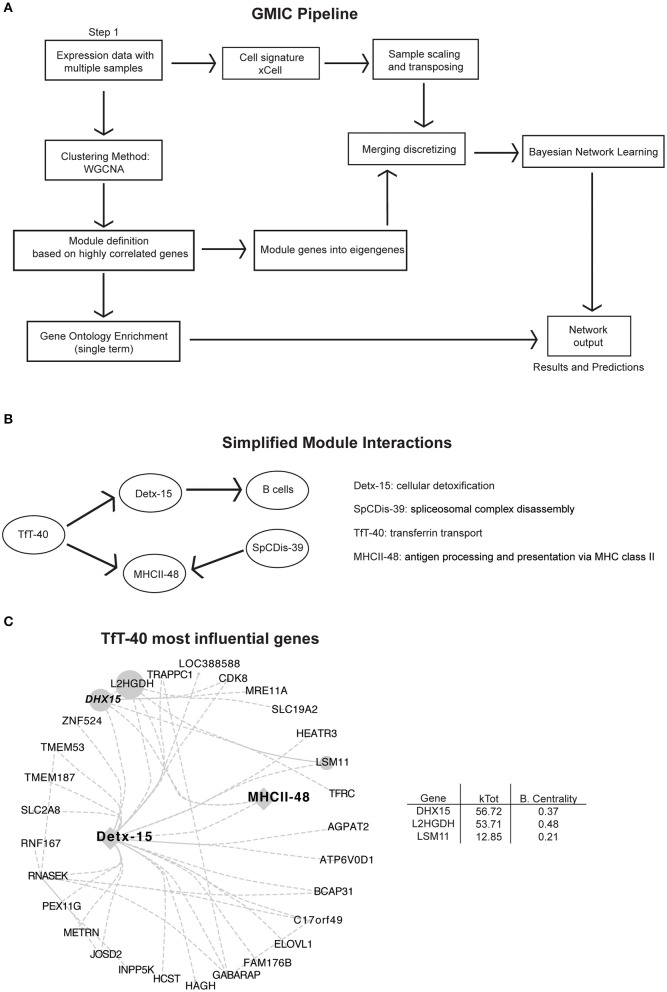
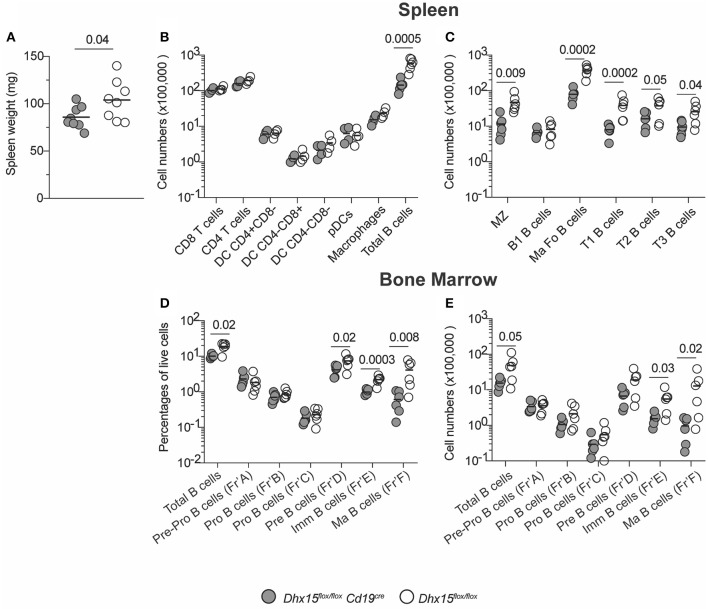
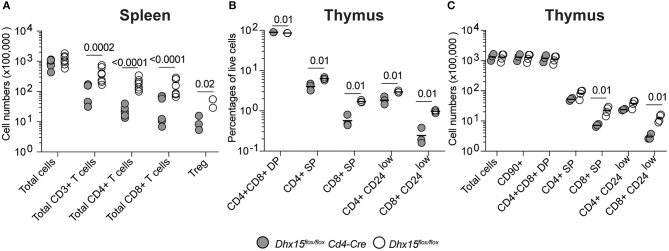
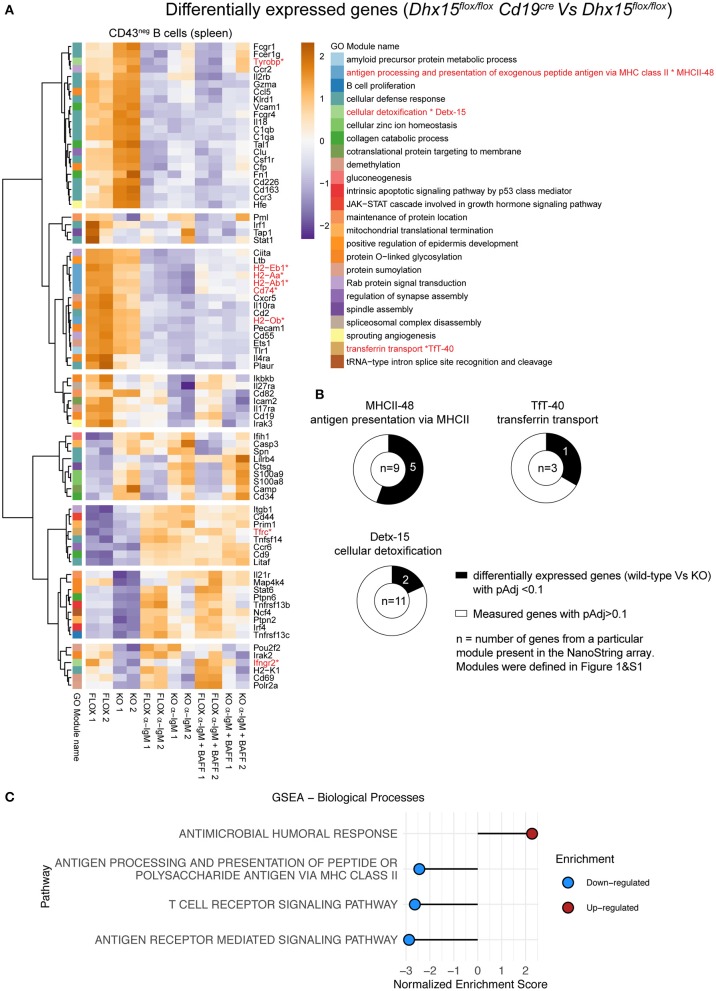
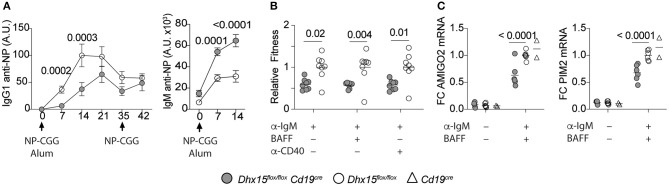
Genome-wide co-expression analysis is often used for annotating novel gene functions from high-dimensional data. Here, we developed an R package with a Shiny visualization app that creates immuno-networks from RNAseq data using a combination of Weighted Gene Co-expression Network Analysis (WGCNA), xCell immune cell signatures, and Bayesian Network Learning. Using a large publicly available RNAseq dataset we generated a Gene Module-Immune Cell (GMIC) network that predicted causal relationships between DEAH-box RNA helicase (DHX)15 and genes associated with humoral immunity, suggesting that DHX15 may regulate B cell fate. Deletion of DHX15 in mouse B cells led to impaired lymphocyte development, reduced peripheral B cell numbers, and dysregulated expression of genes linked to antibody-mediated immune responses similar to the genes predicted by the GMIC network. Moreover, antigen immunization of mice demonstrated that optimal primary IgG1 responses required DHX15. Intrinsic expression of DHX15 was necessary for proliferation and survival of activated of B cells. Altogether, these results support the use of co-expression networks to elucidate fundamental biological processes.

Keywords: B cell; Bayesian network; DHX15; RNA helicase; WGCNA; antibodies.


Figures

Figure 1
Figure 1
Analysis pipeline and immune-networks. RNAseq data from 557 subjects originally described by Schmitz et al. (12) was used in our co-expression workflow to create the modular immune-network. (A) Schematic illustration of the analysis pipeline used to generate the immune-networks. Cell signatures were added using xCell signature-based method, and co-expression genes were first determined using WGCNA. Eigengenes were determined using principal component analysis of the modular genes. Bayesian Network learning was applied to eigengenes to create the full immune-network and modules with cell signature. An open access version of the GMIC generating package is available from doi: 10.18129/B9.bioc.GmicR. (B) Simplified modular network from Supplementary Figure 1A, focused on MHCII class II presentation (MHCII-48), and module TfT-40. (C) Representation of the most influential genes for the TfT-40 module. The total number of edges were minimized by using a 0.04 threshold. Sizes of nodes and labels represent betweenness centrality calculated by Cytoscape from the depicted directed network, and it is proportional to the gene influence. DHX15 is highlighted in a bold italic font. For an expanded version see Supplementary Figure 1B.
Figure 2
Figure 2
B cell lymphopenia in DHX15 B cell conditional KO mice. (A) Spleen weight in mg from experimental (filled symbols) and negative littermates (opened symbols). (B) Immunophenotyping of the spleen. Cell numbers were defined by the percentages of CD45+Singlets+Live gate+ (Total cells). Additional leukocyte gates were defined as followed: T cells (CD3+B220CD19), B cells (B220+CD19+CD3), DCs (CD11c+CD19CD3F4/80), pDCs (DCgate+CD11cintB220+), and macrophages (F4/80+CD19CD3CD11c). (C) Spleen B cell populations were defined according to Supplementary Figure 3A. (D,E) Bone marrow immunophenotyping. B cell development fractions were determined using Supplementary Figure 3B gating strategy. Percentages and total numbers were relative to the Live gate+ Singlets+ FSC-A/SSC-A gate. Total bone marrow cell numbers were relative to two fibulas per mouse. Each symbol represents an individual animal, from the combined results of 3–4 experiments. Animals were 8–14 weeks of age, and from both sexes. Statistical analysis was performed with R studio using the multiple linear regression function and the following equation: rank(Variable Y)~Genotype + Sex + Replicate. Only P values smaller than 0.05 were reported.
Figure 3
Figure 3
T cell deficiency and impaired thymocyte development in Dhx15flox/flox Cd4-Cre mice. (A) Total cell counts (total CD45+ cells) and T cell subtypes from Dhx15flox/flox Cd4-Cre+(filled symbols) and Dhx15flox/flox negative littermate (opened symbols). Cell gates were defined as in Figure 2. Treg cells were defined by the CD4+ T cell scheme gate followed by segregation using the Foxp3 stain. (B,C) Immunophenotyping of the thymus. Cell numbers were calculated using a CD45+Singlets+Live gate+. Each symbol represents an individual animal, from the combined results of 2 experiments. Animals were 8–14 weeks of age, and from both sexes. Statistical analysis was performed with R studio using the multiple linear regression function and the following equation: rank(Variable Y)~Genotype + Sex + Replicate. Only P values smaller than 0.05 were shown.
Figure 4
Figure 4
Differential gene expression in DHX15 deficient B cells. NanoString analysis of negative selected purified B cells from the spleens of Dhx15flox/flox Cd19cre and Dhx15flox/flox mice. Cultured B cells were stimulated or not with anti-IgM ± BAFF for 22 h, followed by RNA extraction. NanoString data was normalized using DESeq2. (A) A total of 98 genes were significantly differentially expressed (pAdj < 0.1) between DHX15-null B cells and controls. Significant genes were matched to the human WGCNA gene modules as described in Supplementary Table 1, and differentially expressed genes belonging to module 0 were excluded from the heatmap (total of 17 genes). Expression levels represent DESeq2-normalized values, scaled by row. Color-coding on the left represents individual WGCNA gene modules as annotated on the right and defined in Figure 1 and Supplementary Figure 1. *Represent the differentially expressed genes that belong to modules MHCII-48, TfT-40, and Detx-15. (B) Doughnut graphs represent the total number of genes measured by NanoString that belong to MHCII-48, TfT-40, and Detx-15. (C) Gene set enrichment analysis of differentially expressed genes, using the GO gene set (biological processes) from the Molecular Signatures Database. Top 4 pathways are shown, which were identified from genes differentially expressed in DHX15-null B cells.
Figure 5
Figure 5
Reduced primary antibody responses in Dhx15flox/flox Cd19cre mice. (A) IgG1 and IgM anti-NP18BSA Abs in sera of mice immunized with NP-CGG in alum. Arrows indicated the immunization days. X-axis represent the time points when sera were collected. Arbitrary units (A.U.) were defined using pooled serum from animals that were immunized with NP-CGG. The graph represents the mean ± SEM from two independent experiments. Filled symbol represents the mean A.U. of IgG1 or IgM anti-NP Abs from Dhx15flox/flox Cd19cre (n = 12). Opened symbol represents the mean A.U. for Dhx15flox/flox mice (n = 15). (B) Competitive fitness was determined by using a mixed co-cultured system of CD45.2+ and CD45.1+ splenocytes (CD45.2+ Dhx15flox/flox Cd19cre or CD45.2+ Dhx15flox/flox with CD45.1+ wild-type cells). Relative Fitness was calculated after 72 h of in vitro stimulation with the indicated treatments by the following equation: [72 h Treatment Ratio (%B220+CD45.2+/%B220+CD45.1+)]:[0 h Ratio(%B220+CD45.2+/%B220+CD45.1+)]. Data represents the summary of two combined experiments. Each symbol represents an individual mouse. (C) Relative expression of PIM2 and AMIGO2 by RT-qPCR after 24 h stimulation with anti-IgM plus BAFF on purified B cells. Data represents the summary of three independent experiments, with n = 2 per experiment, except for the Cd19cre animals (one experiment). Expression was normalized using ACTIN, RPL1a, and L32 genes. Fold-changes (FC) were calculated by dividing each data point by the mean normalized expression of the stimulated Dhx15flox/flox group in each experiment. Each symbol represents an individual mouse. Animals were 8–14 weeks of age, and from both sexes. Statistical analysis was performed with R studio using multiple linear regression function and the following equations: (A) rank(A.U.)~Genotype*Bleed Day + Sex. (B,C) rank(Variable Y)~Genotype + Sex + Replicate. Only P values smaller than 0.05 were reported.

References

    1. Crouser ED, Fingerlin TE, Yang IV, Maier LA, Nana-Sinkam P, Collman RG, et al. Application of “Omics” and systems biology to sarcoidosis research. Ann Am Thorac Soc. (2017) 14:S445–51. 10.1513/AnnalsATS.201707-567OT - DOI - PMC - PubMed
    1. Ching T, Himmelstein DS, Beaulieu-Jones BK, Kalinin AA, Do BT, Way GP, et al. Opportunities and obstacles for deep learning in biology and medicine. J R Soc Interface. (2018) 15:20170387. 10.1098/rsif.2017.0387 - DOI - PMC - PubMed
    1. Deo RC. Machine learning in medicine. Circulation. (2015) 132:1920–30. 10.1161/CIRCULATIONAHA.115.001593 - DOI - PMC - PubMed
    1. Saelens W, Cannoodt R, Saeys Y. A comprehensive evaluation of module detection methods for gene expression data. Nat Commun. (2018) 9:1090 10.1038/s41467-018-03424-4 - DOI - PMC - PubMed
    1. van Dam S, Vosa U, van der Graaf A, Franke L, de Magalhaes JP. Gene co-expression analysis for functional classification and gene-disease predictions. Brief Bioinform. (2018) 19:575–92. 10.1093/bib/bbw139 - DOI - PMC - PubMed

Publication types

LinkOut - more resources