. 2019 Dec 11:10:1205.
doi: 10.3389/fgene.2019.01205. eCollection 2019.

Variational Autoencoders for Cancer Data Integration: Design Principles and Computational Practice

Affiliations

Variational Autoencoders for Cancer Data Integration: Design Principles and Computational Practice

Nikola Simidjievski et al. Front Genet. .

Abstract

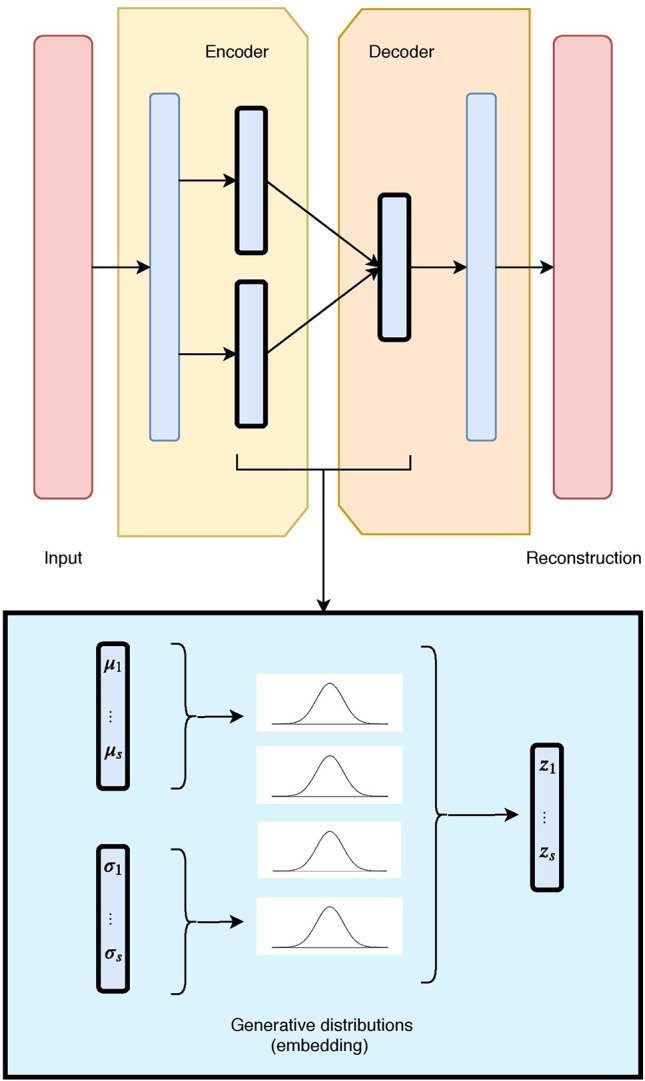
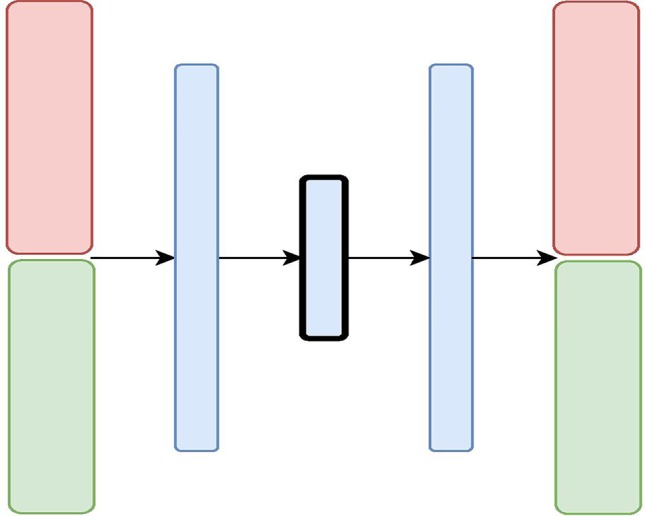
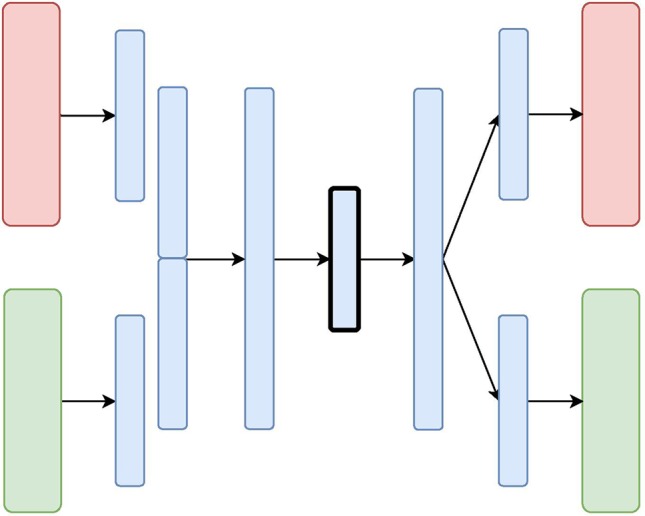
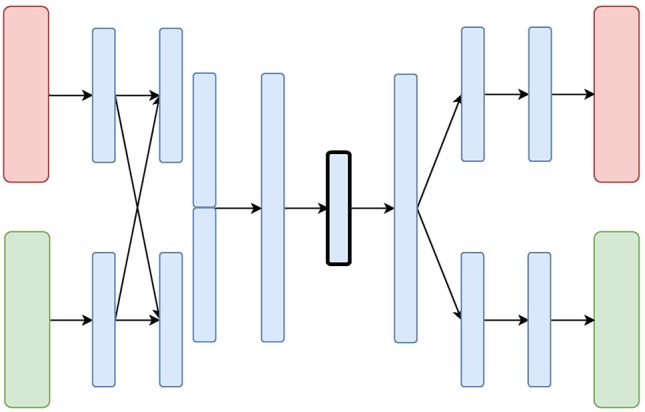
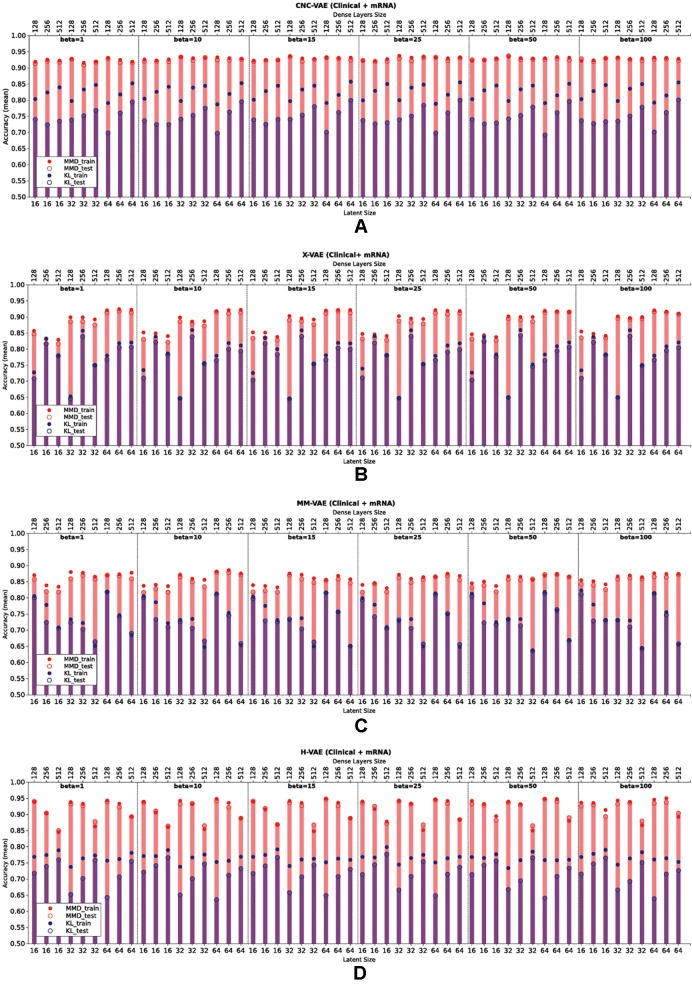
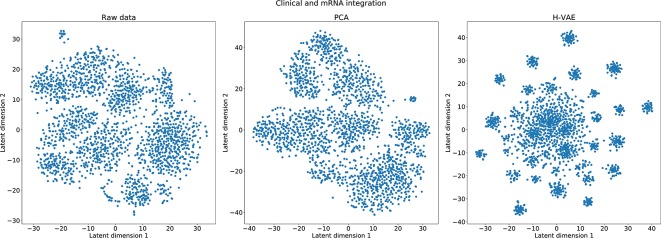
International initiatives such as the Molecular Taxonomy of Breast Cancer International Consortium are collecting multiple data sets at different genome-scales with the aim to identify novel cancer bio-markers and predict patient survival. To analyze such data, several machine learning, bioinformatics, and statistical methods have been applied, among them neural networks such as autoencoders. Although these models provide a good statistical learning framework to analyze multi-omic and/or clinical data, there is a distinct lack of work on how to integrate diverse patient data and identify the optimal design best suited to the available data.In this paper, we investigate several autoencoder architectures that integrate a variety of cancer patient data types (e.g., multi-omics and clinical data). We perform extensive analyses of these approaches and provide a clear methodological and computational framework for designing systems that enable clinicians to investigate cancer traits and translate the results into clinical applications. We demonstrate how these networks can be designed, built, and, in particular, applied to tasks of integrative analyses of heterogeneous breast cancer data. The results show that these approaches yield relevant data representations that, in turn, lead to accurate and stable diagnosis.

Keywords: artificial intelligence; bioinformactics; cancer–breast cancer; deep learning; integrative data analyses; machine learning; multi-omic analysis; variational autoencoder.


Figures

Figure 1
Figure 1
The unimodal Variational Autoencoder (VAE) architecture and latent embedding: the red layers correspond to the input and reconstructed data, given and generated by the model. The hidden layers are in blue, with the embedding framed in black. Each latent component is made of two nodes (mean and standard deviation), which define a Gaussian distribution. The combination of all Gaussian constitutes the VAE generative embedding.
Figure 2
Figure 2
The Variational Autoencoder with Concatenated Inputs (CNC-VAE) Architecture: the red and green layers on the left correspond to two inputs from different data sources. The blue layers are shared, with the embedding being framed in black.
Figure 3
Figure 3
The X-shaped Variational Autoencoder (X-VAE) Architecture: the red and green layers on the left correspond to two inputs from different data sources. The blue layers are shared, with the embedding being framed in black.
Figure 4
Figure 4
The Mixed-Modal Variational Autoencoder (MM-VAE) Architecture: the red and green layers on the left correspond to two inputs from different data sources. The blue layers are shared, with the embedding being framed in black.
Figure 5
Figure 5
The Hierarchical Variational Autoencoder (H-VAE) Architecture: the red and green layers on the left correspond to two inputs from different data sources. The blue layers are shared, with the embedding being framed in black.
Figure 6
Figure 6
Comparison of the downstream performance on the IHC classification tasks of a predictive model trained on the representations produced by integrating clinical and mRNA data using (A) CNC-VAE, (B) X-VAE, (C) MM-VAE, and (D) H-VAE. Full circles denote the training accuracy, while empty circles and bars denote the test accuracy averaged over five-fold cross-validation. Red and blue colors denote the configurations when Maximum Mean Discrepancy (MMD) and Kullback–Leibler (KL) are employed, respectively. Bottom x-axis depicts the size of the latent dimension, while the top x-axis the size of the dense layers of each configuration.
Figure 7
Figure 7
Qualitative comparison of the learned representations with H-VAE, raw data, and PCA-transformed data when integrating clinical and mRNA data.

References

    1. Amin S. B., Yip W.-K., Minvielle S., Broyl A., Li Y., Hanlon B., et al. (2014). Gene expression profile alone is inadequate in predicting complete response in multiple myeloma. Leukemia 28, 2229–2234. 10.1038/leu.2014.140 - DOI - PMC - PubMed
    1. Ardila D., Kiraly A. P., Bharadwaj S., Choi B., Reicher J. J., Peng L., et al. (2019). End-to-end lung cancer screening with three-dimensional deep learning on low-dose chest computed tomography. Nat. Med. 25, 954–961. 10.1038/s41591-019-0447-x - DOI - PubMed
    1. Belkin M., Niyogi P. (2003). Laplacian eigenmaps for dimensionality reduction and data representation. Neural Comput. 15, 1373–1396. 10.1162/089976603321780317 - DOI
    1. Bengio Y., Courville A., Vincent P. (2013). Representation learning: a review and new perspectives. IEEE Trans. Pattern Anal. Mach. Intell. 35, 1798–1828. 10.1109/TPAMI.2013.50 - DOI - PubMed
    1. Bignell G. R., Greenman C. D., Davies H., Butler A. P., Edkins S., Andrews J. M., et al. (2010). Signatures of mutation and selection in the cancer genome. Nature 463, 893. 10.1038/nature08768 - DOI - PMC - PubMed