. 2019 Dec 11:10:1253.
doi: 10.3389/fgene.2019.01253. eCollection 2019.

Benchmark and Parameter Sensitivity Analysis of Single-Cell RNA Sequencing Clustering Methods

Affiliations

Benchmark and Parameter Sensitivity Analysis of Single-Cell RNA Sequencing Clustering Methods

Monika Krzak et al. Front Genet. .

Abstract

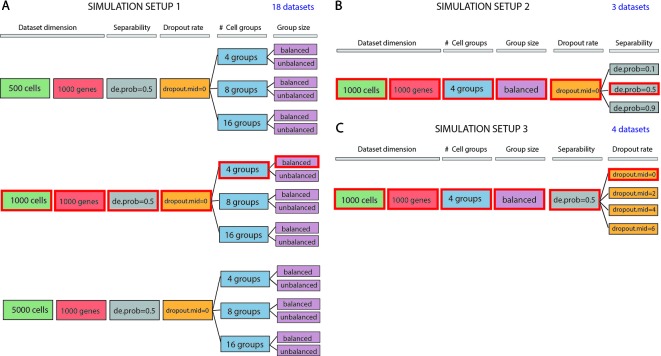
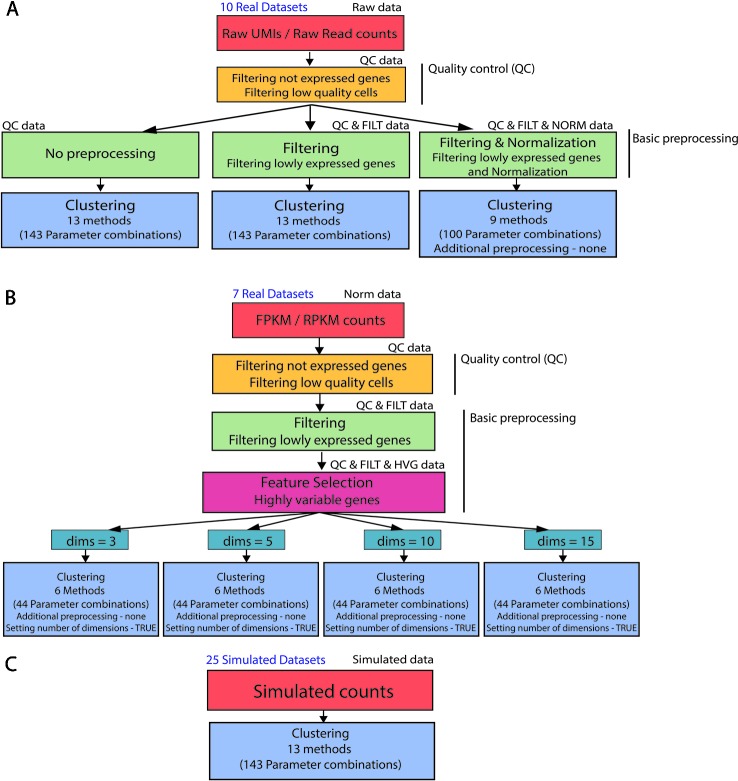
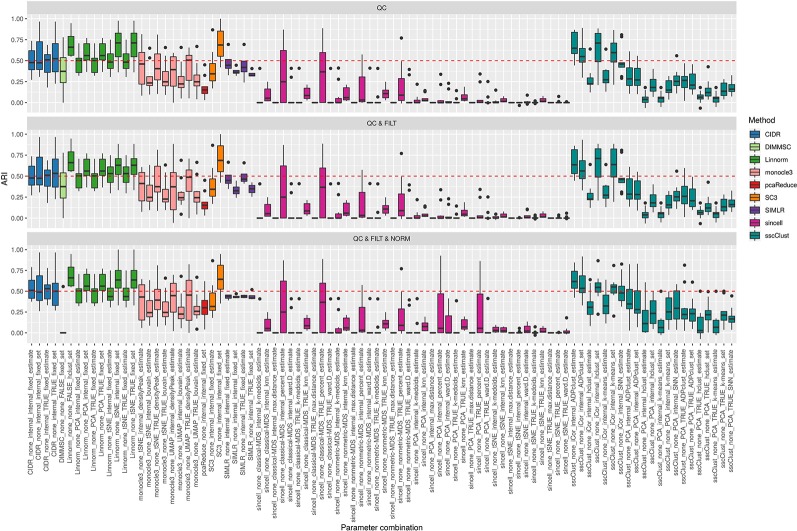
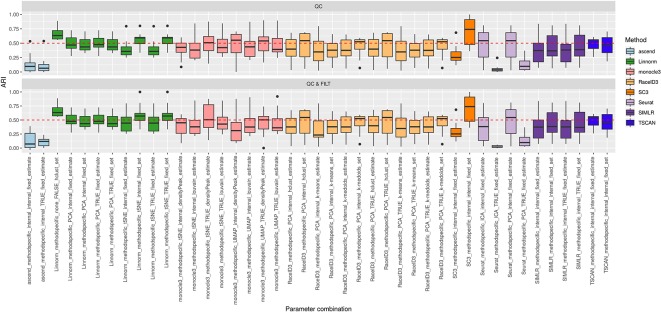
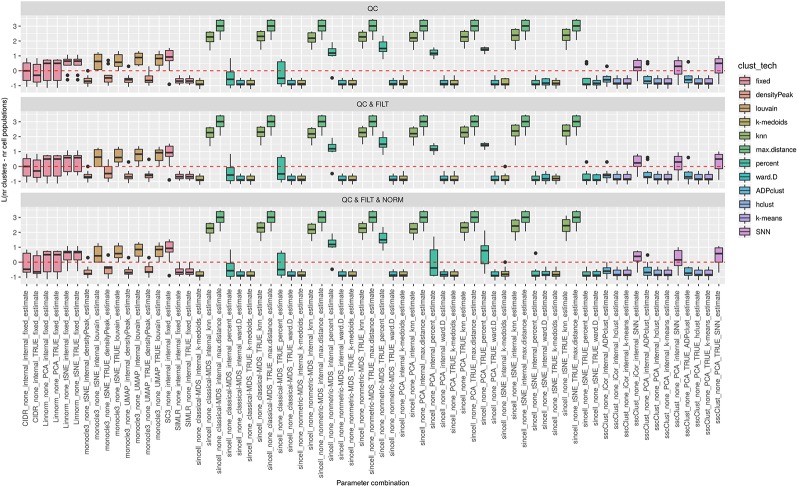
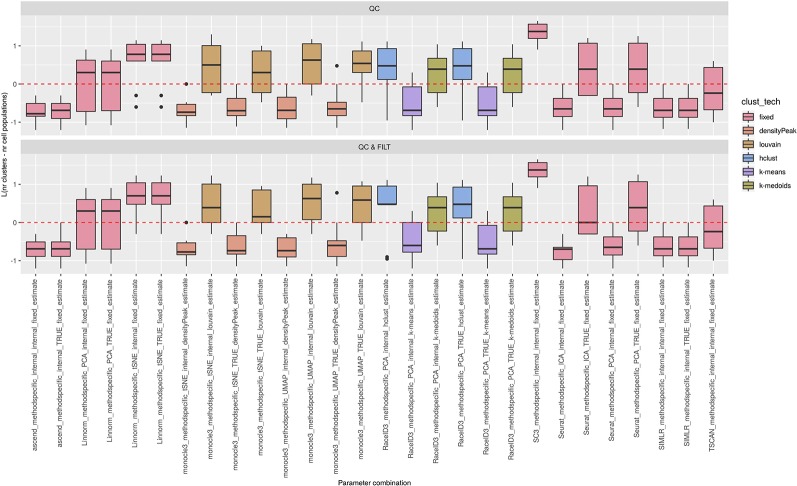
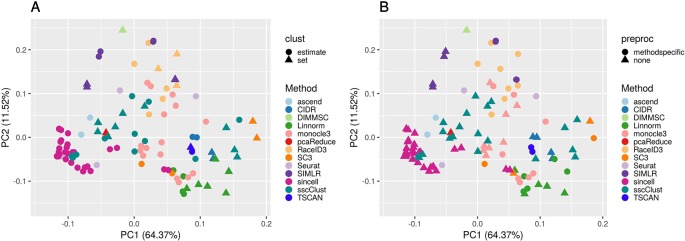
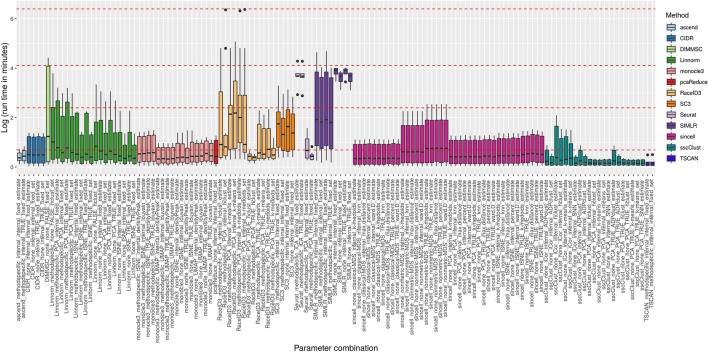
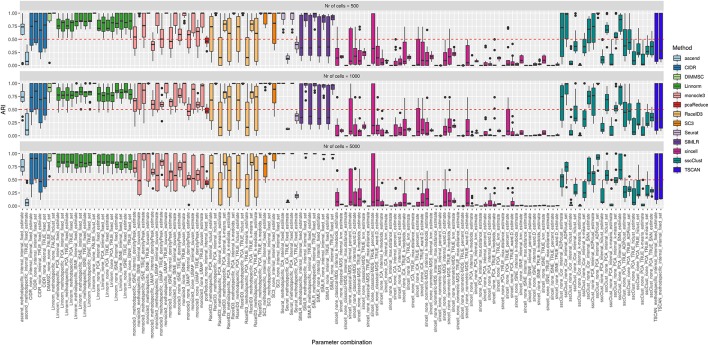
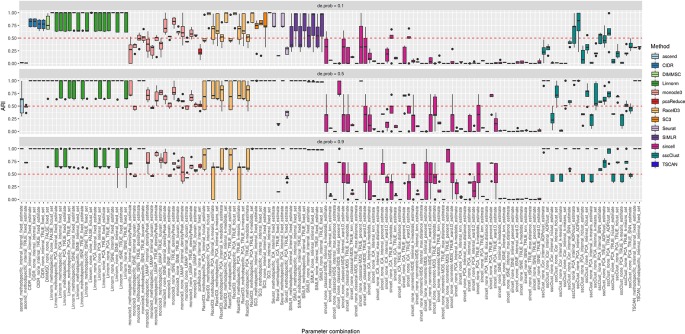
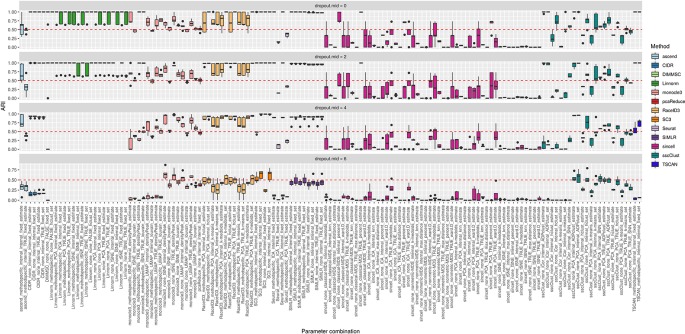
Single-cell RNA-seq (scRNAseq) is a powerful tool to study heterogeneity of cells. Recently, several clustering based methods have been proposed to identify distinct cell populations. These methods are based on different statistical models and usually require to perform several additional steps, such as preprocessing or dimension reduction, before applying the clustering algorithm. Individual steps are often controlled by method-specific parameters, permitting the method to be used in different modes on the same datasets, depending on the user choices. The large number of possibilities that these methods provide can intimidate non-expert users, since the available choices are not always clearly documented. In addition, to date, no large studies have invistigated the role and the impact that these choices can have in different experimental contexts. This work aims to provide new insights into the advantages and drawbacks of scRNAseq clustering methods and describe the ranges of possibilities that are offered to users. In particular, we provide an extensive evaluation of several methods with respect to different modes of usage and parameter settings by applying them to real and simulated datasets that vary in terms of dimensionality, number of cell populations or levels of noise. Remarkably, the results presented here show that great variability in the performance of the models is strongly attributed to the choice of the user-specific parameter settings. We describe several tendencies in the performance attributed to their modes of usage and different types of datasets, and identify which methods are strongly affected by data dimensionality in terms of computational time. Finally, we highlight some open challenges in scRNAseq data clustering, such as those related to the identification of the number of clusters.

Keywords: benchmark; clustering methods; high-dimensional data analysis; parameter sensitivity analysis; single-cell RNA-seq.


Figures

Figure 1
Figure 1
Data simulation scheme. (A) Simulation of 18 datasets using Setup 1. Simulated datasets are of various dimensions (number of cells), number of cell groups and proportion of cells within each group (balance or unbalance group sizes). (B) Simulation of 3 datasets using Setup 2. Simulated datasets vary in terms of separability between the groups (from poorly to well separable). This feature has been controlled by setting the de.prob parameter of Splatter simulation function to three values: 0.1, 0.5 and 0.9. (C) Simulation of 4 datasets using Setup 3. In this simulation setup, we used one dataset to create 3 others by placing an increasing number of zeros (controlled by dropout.mid parameter) on the count matrix. We highlighted by red color three identical datasets across all simulated setups. Each simulation setup has been repeated with 5 different values of the seed.
Figure 2
Figure 2
Clustering analysis pipeline. (A) (B) Real data analysis is divided into three steps: Quality control, basic preprocessing and clustering. (C) Clustering is directly applied to simulated datasets. Note that not all the parameter combinations have been applied to each dataset type. For filtered and normalized raw counts we excluded parameter combinations that use an additional method specific preprocessing. For FPKM/RPKM counts we used only those methods that do not allow for additional preprocessing (none) and provide option to set the number of reduced dimensions (TRUE).
Figure 3
Figure 3
Overall accuracy of methods applied to Raw counts. ARI accuracy for 9 methods with 90 parameter combinations out of 100, independently applied to the 10 raw datasets after the three basic preprocessing types (QC, QC & FILT, QC & FILT & NORM). Box colors distinguish the different methods, although applied with different parameter combinations. Superimposed as reference, a red dashed line at ARI = 0.5.
Figure 4
Figure 4
Overall accuracy of methods applied to Raw counts. ARI accuracy for remaining 8 methods with 43 parameter combinations, independently applied to the 10 raw datasets after two basic preprocessing types (QC, QC & FILT). Box colors distinguish the different methods, although applied with different parameter combinations. Superimposed as reference, a red dashed line at ARI = 0.5.
Figure 5
Figure 5
Estimation of the number of clusters for methods applied to Raw counts. Boxplots of L in Eq. 1 for the subset of methods (i.e., 69 parameter combinations) that allows to estimate the number of clusters (and with none preprocessing). Superimposed as a reference, a red dashed line at L = 0. Parameter combinations with difference below or above 0 resulted into under or overestimation of the number of clusters, respectively.
Figure 6
Figure 6
Estimation of the number of clusters for methods applied to Raw counts. Boxplots of L in Eq. 1 for the subset of methods for the remaining methods (28 parameter combinations) with method specific preprocessing that allows to estimate number of clusters. Superimposed as reference, a red dashed line at L = 0. Parameter combinations with difference below or above 0 resulted into under or overestimation of the number of clusters, respectively.
Figure 7
Figure 7
PCA plots of methods applied to QC & FILT Raw counts. Two identical PCA projections based on the performance measured in ARI of 13 methods with 133 parameter combinations out of 143, applied to 10 quality controlled and filtered (QC & FILT) raw datasets. Parameter combinations were colored by the method and shaped by the parameter options: (A) way of selecting number of clusters (clust), (B) additional preprocesing (preproc).
Figure 8
Figure 8
Computational time of methods applied to QC & FILT Raw counts. Log of run times in minutes of 13 methods with 133 parameter combinations applied to QC & FILT preprocessed raw datasets. We superimposed as reference red dashed lines at log of 1 min, 10 min, 1 h and 10 h.
Figure 9
Figure 9
Overall accuracy of the methods on simulated datasets from Setup1 with balanced group sizes. Performance of 143 parameter combinations on Setup 1 simulated data. Selected results are across all runs.
Figure 10
Figure 10
Overall accuracy of the methods on simulated datasets from Setup 2. Performance of 143 parameter combinations on simulated data. Selected results are across all runs.
Figure 11
Figure 11
Overall accuracy of the methods on simulated datasets from Setup 3. Performance of 143 parameter combinations on simulated data. Selected results are across all runs.

References

    1. Andrews T. S., Hemberg M. (2018). Identifying cell populations with scRNASeq. Mol. Asp. Med. 59, 114–122. 10.1016/j.mam.2017.07.002 - DOI - PubMed
    1. Baron M., Veres A., Wolock S. L., Faust A. L., Gaujoux R., Vetere A., et al. (2016). A single-cell transcriptomic map of the human and mouse pancreas reveals inter- and intra-cell population structure. Cell Syst. 3 (4), 346–360. 10.1016/j.cels.2016.08.011 - DOI - PMC - PubMed
    1. Benjamini Y., Hochberg Y. (1995). Controlling the false discovery rate: a practical and powerful approach to multiple testing. J. R. Stat. Soc. Ser. B. (Methodological) 57 (1), 289–300. 10.1111/j.2517-6161.1995.tb02031.x - DOI
    1. Biase F. H., Cao X., Zhong S. (2014). Cell fate inclination within 2-cell and 4-cell mouse embryos revealed by single-cell RNA sequencing. Genome Res. 24 (11), 1787–1796. 10.1101/gr.177725.114 - DOI - PMC - PubMed
    1. Chen G., Ning B., Shi T. (2019). Single-Cell RNA-Seq technologies and related computational data analysis. Front. Genet. 10, 317. 10.3389/fgene.2019.00317 - DOI - PMC - PubMed