. 2019 Nov 25;7(1):1901992.
doi: 10.1002/advs.201901992. eCollection 2020 Jan.

A Tailored Multifunctional Anticancer Nanodelivery System for Ruthenium-Based Photosensitizers: Tumor Microenvironment Adaption and Remodeling

Affiliations

A Tailored Multifunctional Anticancer Nanodelivery System for Ruthenium-Based Photosensitizers: Tumor Microenvironment Adaption and Remodeling

Jin-Hao Liang et al. Adv Sci (Weinh). .

Abstract

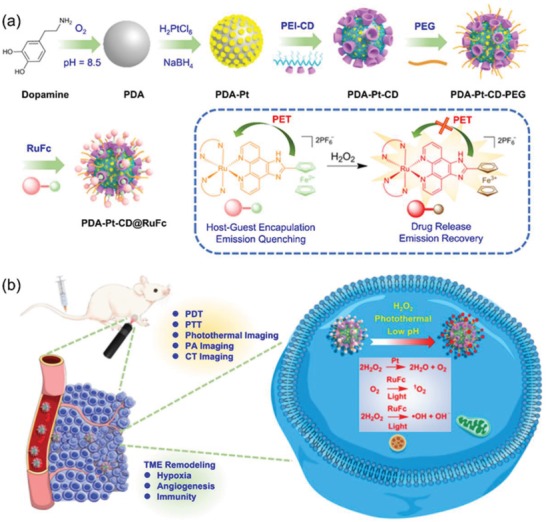
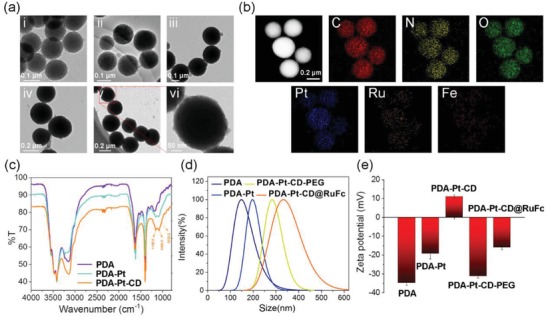
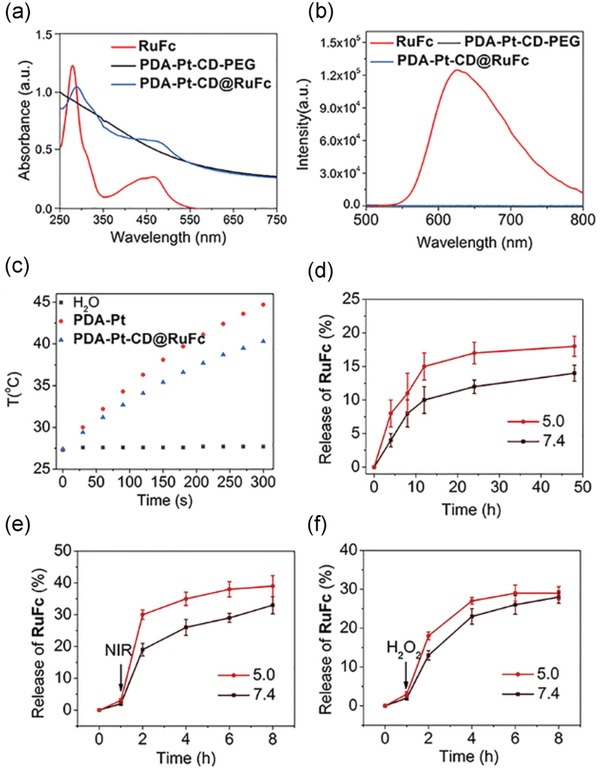
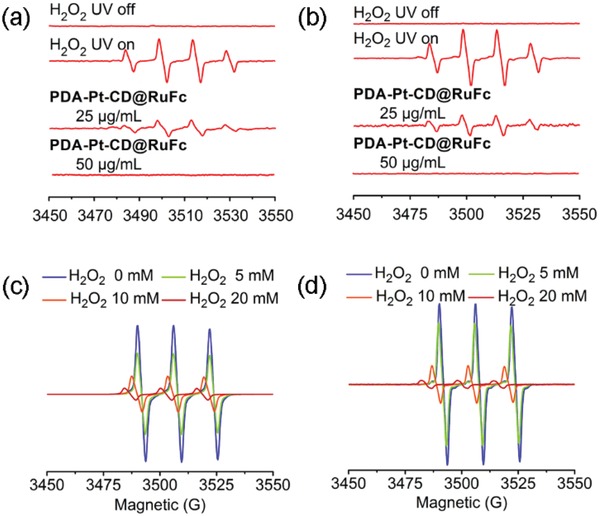
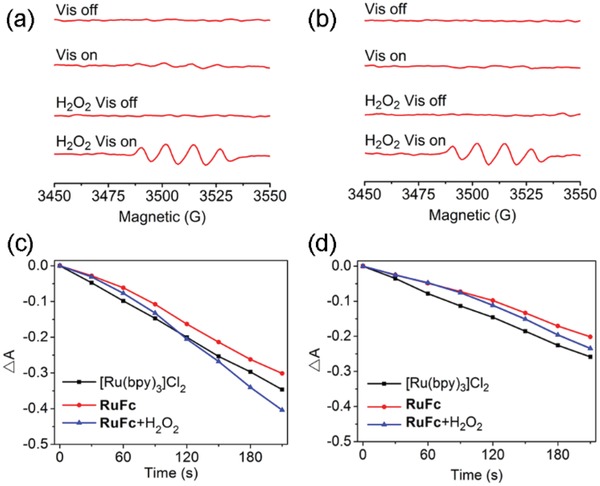
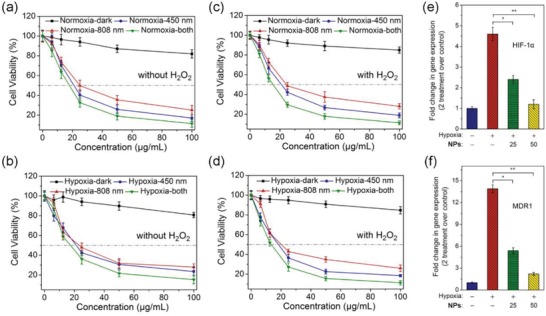
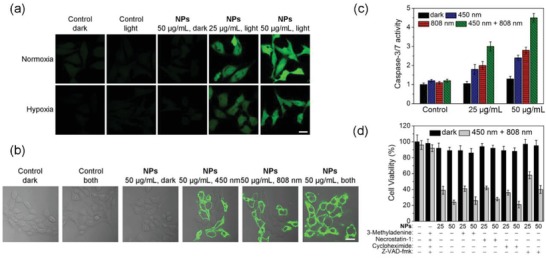
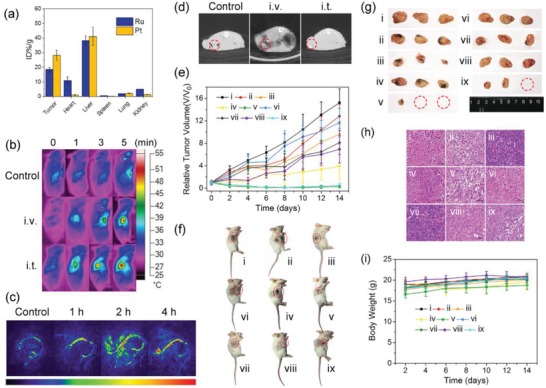
Ruthenium complexes are promising photosensitizers (PSs), but their clinical applications have many limitations. Here, a multifunctional nano-platform PDA-Pt-CD@RuFc formed by platinum-decorated and cyclodextrin (CD)-modified polydopamine (PDA) nanoparticles (NPs) loaded with a ferrocene-appended ruthenium complex (RuFc) is reported. The NPs can successfully deliver RuFc to the tumor sites. The release of RuFc from the NPs can be triggered by low pH, photothermal heating, and H2O2. The combined photodynamic and photothermal therapy (PDT-PTT) mediated by PDA-Pt-CD@RuFc NPs can overcome the hypoxic environment of tumors from several aspects. First, the platinum NPs can catalyze H2O2 to produce O2. Second, vasodilation caused by photothermal heating can sustain the oxygen supplement. Third, PDT exerted by RuFc can also occur through the non-oxygen-dependent Fenton reaction. Due to the presence of PDA, platinum NPs, and RuFc, the nanosystem can be used in multimodal imaging including photothermal, photoacoustic, and computed tomography imaging. The NPs can be excited by the near-infrared two-photon light source. Moreover, the combined treatment can improve the tumor microenvironments to obtain an optimized combined therapeutic effect. In summary, this study presents a tumor-microenvironment-adaptive strategy to optimize the potential of ruthenium complexes as PSs from multiple aspects.

Keywords: drug delivery; multimodal imaging; photodynamic therapy; ruthenium; tumor microenvironment.


Conflict of interest statement

The authors declare no conflict of interest.

Figures

Scheme 1
Scheme 1
a) The construction of PDA‐Pt‐CD@RuFc NPs. Drug release and fluorescence recovery due to oxidation of the ferrocene group in RuFc by H2O2 are shown in the frame. b) Purposed action mechanisms of PDA‐Pt‐CD@RuFc NPs.
Figure 1
Figure 1
a) TEM image of: i) PDA, ii) PDA‐Pt, iii) PDA‐Pt‐CD, iv) PDA‐Pt‐CD‐PEG, and v) PDA‐Pt‐CD@RuFc NPs. vi) The detailed picture of (v). b) TEM elemental mapping of PDA‐Pt‐CD@RuFc NPs. c) The IR spectra of PDA, PDA‐Pt, and PDA‐Pt‐CD NPs. d) The particle size distributions of PDA, PDA‐Pt, PDA‐Pt‐CD‐PEG, and PDA‐Pt‐CD@RuFc NPs. e) The zeta‐potentials of PDA, PDA‐Pt, PDA‐Pt‐CD, PDA‐Pt‐CD‐PEG, and PDA‐Pt‐CD@RuFc NPs.
Figure 2
Figure 2
a) UV/vis spectra and b) fluorescence emission of RuFc (10 × 10−6 m), PDA‐Pt‐CD‐PEG (30 µg mL−1), and PDA‐Pt‐CD@RuFc (30 µg mL−1) NPs. c) The temperature changes of the PDA‐Pt (100 µg mL−1) and PDA‐Pt‐CD@RuFc (100 µg mL−1) upon irradiation at 808 nm (1 W cm−2) for different periods of time. d–f) In vitro pH‐dependent (d), photothermal‐triggered (e), and H2O2‐responsive (f) release of RuFc from PDA‐Pt‐CD@RuFc NPs at pH 5.0 and 7.4. The samples were irradiated with an 808 nm laser irradiation (1 W cm−2) or mixed with 100 µL H2O2 (100 × 10−3 m) at 1 h.
Figure 3
Figure 3
a,b) Effect of PDA‐Pt‐CD@RuFc NPs on •OH production in the H2O2/UV system at pH 6.5 (a) and pH 7.4 (b). c,d) Detection of the O2 (EPR spin label oximetry) produced by reaction catalyzed by PDA‐Pt‐CD@RuFc NPs (50 µg mL−1) at pH 6.5 (c) and pH 7.4 (d).
Figure 4
Figure 4
a,b) Production of •OH through photo‐Fenton reaction catalyzed by RuFc (50 × 10−6 m) at pH 6.5 (a) and pH 7.4 (b). Irradiation conditions: 450 nm, 20 mW cm−2, 3 min. c,d) Determination of the 1O2 by RuFc using ABDA (100 × 10−6 m) as the probe under visible light irradiation in the absence or presence of H2O2 (100 × 10−6 m) at pH 6.5 (c) and pH 7.4 (d). The solutions were irradiated with a 450 nm laser (20 W cm−2) for different time periods.
Figure 5
Figure 5
In vitro combined PDT‐PTT activities of PDA‐Pt‐CD@RuFc NPs measured on 4T1 cells. Cells were cultured under hypoxia (1% O2) or normoxia (21% O2) in the absence or presence of H2O2. a) Normoxia; H2O2 (0 × 10−6 m). b) Hypoxia; H2O2 (0 × 10−6 m). c) Normoxia; H2O2 (3 × 10⁻³ m). d) Hypoxia, H2O2 (3 × 10⁻³ m). Irradiation conditions: 450 nm, 17 mW cm−2, 1 min; 808 nm, 1 W cm−2, 10 min. e,f) The expression of HIF‐1α (e) and MDR1 (f) genes in 4T1 cells treated with PDA‐Pt‐CD@RuFc (25 or 50 µg mL−1) under hypoxia (1%) or normoxia (21%). Incubation time: 6 h. Statistical p‐value: *p < 0.05, **p < 0.01.
Figure 6
Figure 6
a) Intracellular ROS levels detected by H2DCFDA staining in 4T1 cells treated with PDA‐Pt‐CD@RuFc NPs in combination with light irradiation. Cells were cultured under hypoxia (1% O2) or normoxia (21% O2) atmosphere and treated with the NPs. Irradiation conditions: 450 nm, 17 mW cm−2, 1 min. b) Detection of apoptosis by Annexin V staining in 4T1 cells with PDT‐PTT combined treatment mediated by PDA‐Pt‐CD@RuFc. c) Detection of caspase‐3/7 activity in 4T1 cells with PDT‐PTT combined treatment mediated by PDA‐Pt‐CD@RuFc. d) The impact of different inhibitors on the viability of 4T1 cells with PDT‐PTT combined treatment mediated by PDA‐Pt‐CD@RuFc. Irradiation conditions for (b), (c), and (d): 450 nm, 17 mW cm−2, 1 min; 808 nm, 1 W cm−2, 10 min.
Figure 7
Figure 7
a) Biodistribution of Ru and Pt elements in different organs 24 h after i.v. injection of PDA‐Pt‐CD@RuFc NPs. The values are presented as the percentage of injected dose per g of the collected organs based on three mice per group. b) Thermal images of 4T1‐tumor‐bearing mice treated with PDA‐Pt‐CD@RuFc NPs (200 µL, 1 mg mL−1, 4 h) and exposed to an 808 nm laser (1 W cm−2) for 0, 1, 3, and 5 min. c) In vivo PA imaging of 4T1‐tumor‐bearing mice i.v. injected with PDA‐Pt‐CD@RuFc NPs (200 µL, 1 mg mL−1) for different time intervals. d) In vivo CT imaging of 4T1‐tumor‐bearing mice treated with PDA‐Pt‐CD@RuFc NPs (100 µL, 5 mg mL−1). The images were taken 30 min after i.t. injection and 2 h after i.v. injection. e) Tumor growth curves of different groups of mice (5 mice per group). f) Representative photos of different groups of mice after various treatments were taken at day 14. The tumor sites were marked with red dashed circles. g) Representative photos of tumors collected from different groups of mice at the end of treatment. The red dashed circles represent tumors that completely disappear. h) H&E staining of 4T1 tumor tissues of different groups of mice. i) Body weight curves of different groups of mice. The mice in (e)–(i) are divided into nine groups: i) control; ii) dark, i.t.; iii) 450 nm, i.t.; iv) 808 nm, i.t.; v) 808 nm + 450 nm, i.t.; vi) dark, i.v.; vii) 450 nm, i.v.; viii) 808 nm, i.v.; ix) 808 nm + 450 nm, i.v. Irradiation conditions: 450 nm, 12 W cm−2, 5 min; 808 nm, 1 W cm−2, 3 min.
Figure 8
Figure 8
a) TNF‐a and b) IL‐6 level in 4T1 cells after various treatments. Raw 264.7 cells were treated with the supernate of 4T1 cells exposed to different treatments. c) TNF‐a and d) IL‐6 level in sera of mice after various treatments. e,f) Immunofluorescence images of HIF‐1α (e) and VEGF (f) of tumors after treatment with PDA‐Pt‐CD@RuFc. The mice are divided into five groups: i) control; ii) dark; iii) 450 nm; iv) 808 nm; v) 808 nm + 450 nm. Irradiation conditions: 450 nm, 12 W cm−2, 5 min; 808 nm, 1 W cm−2, 3 min.

References

    1. Dolmans D. E., Fukumura D., Jain R. K., Nat. Rev. Cancer 2003, 3, 380. - PubMed
    1. Lucky S. S., Soo K. C., Zhang Y., Chem. Rev. 2015, 115, 1990. - PubMed
    1. a) Monro S., Colon K. L., Yin H., Roque J. III, Konda P., Gujar S., Thummel R. P., Lilge L., Cameron C. G., McFarland S. A., Chem. Rev. 2019, 119, 797; - PMC - PubMed
    2. b) Mari C., Pierroz V., Ferrari S., Gasser G., Chem. Sci. 2015, 6, 2660. - PMC - PubMed
    1. a) Huang H., Yu B., Zhang P., Huang J., Chen Y., Gasser G., Ji L., Chao H., Angew. Chem., Int. Ed. 2015, 54, 14049; - PubMed
    2. b) Liu J., Chen Y., Li G., Zhang P., Jin C., Zeng L., Ji L., Chao H., Biomaterials 2015, 56, 140. - PubMed
    1. Chakrabortty S., Agrawalla B. K., Stumper A., Vegi N. M., Fischer S., Reichardt C., Kogler M., Dietzek B., Feuring‐Buske M., Buske C., Rau S., Weil T., J. Am. Chem. Soc. 2017, 139, 2512. - PMC - PubMed

LinkOut - more resources