. 2019 Dec 4:9:1302.
doi: 10.3389/fonc.2019.01302. eCollection 2019.

Spheroid-Derived Cells From Renal Adenocarcinoma Have Low Telomerase Activity and High Stem-Like and Invasive Characteristics

Affiliations

Spheroid-Derived Cells From Renal Adenocarcinoma Have Low Telomerase Activity and High Stem-Like and Invasive Characteristics

Leili Saeednejad Zanjani et al. Front Oncol. .

Abstract

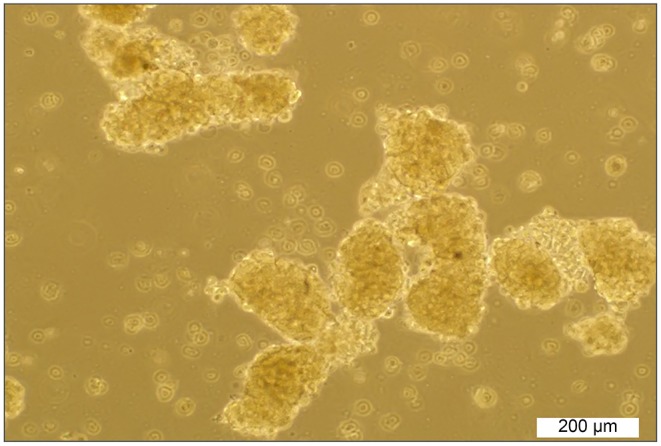
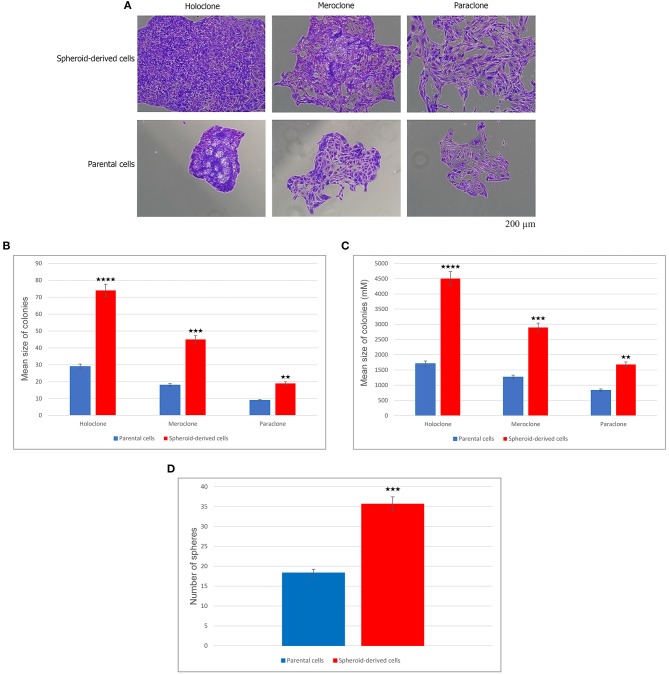
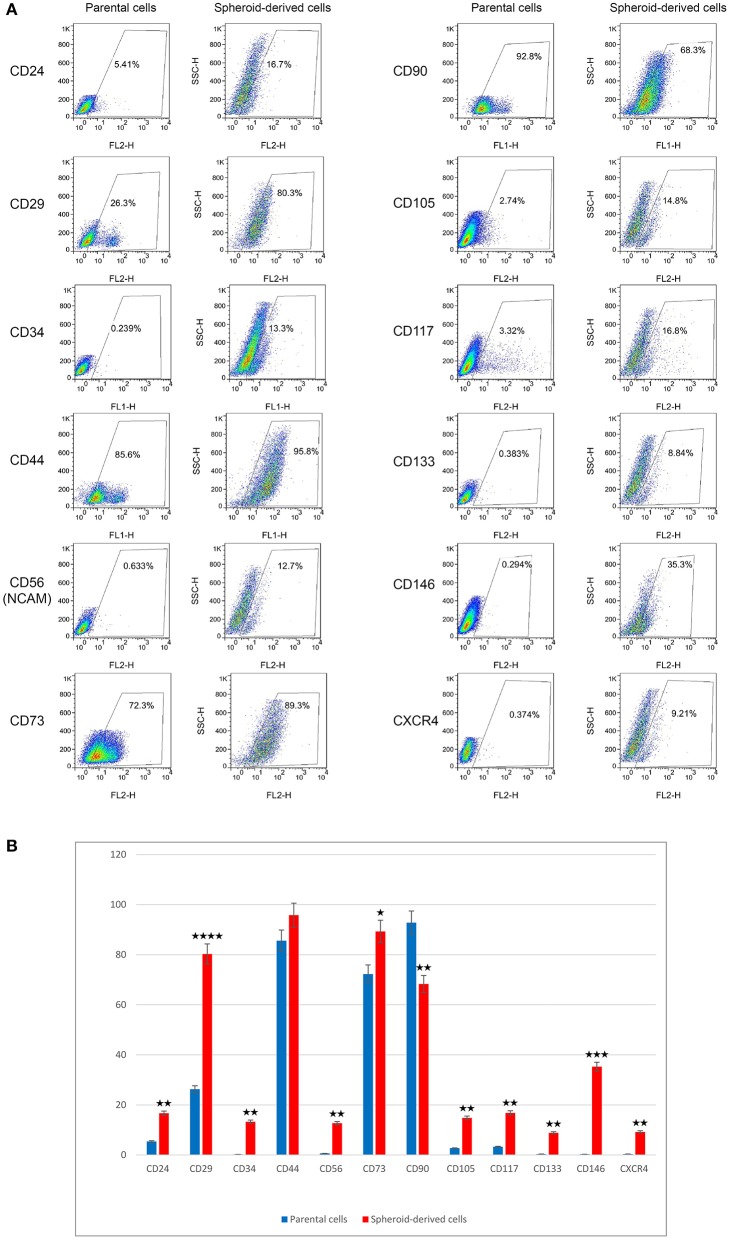
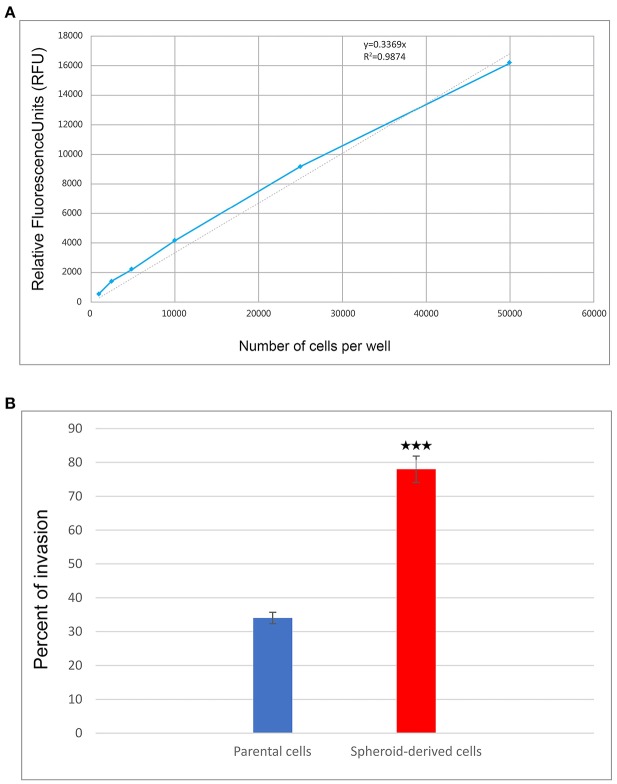
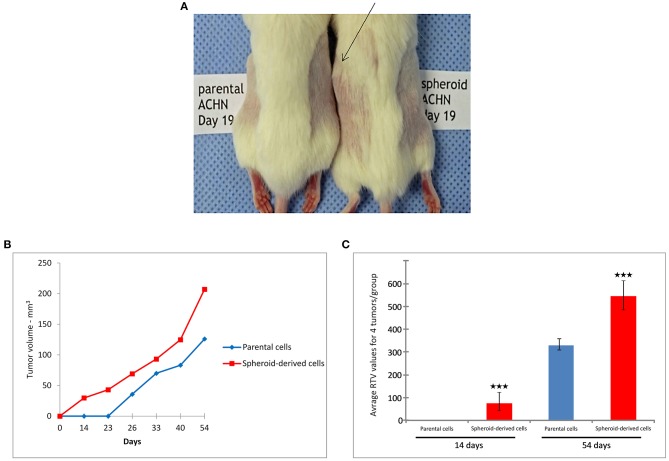
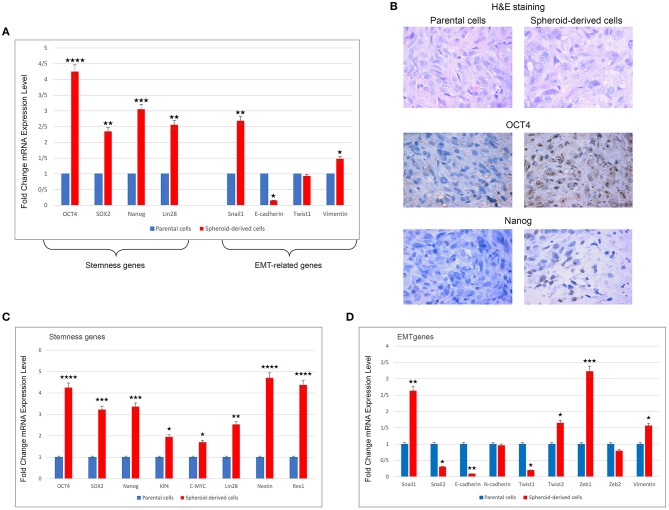
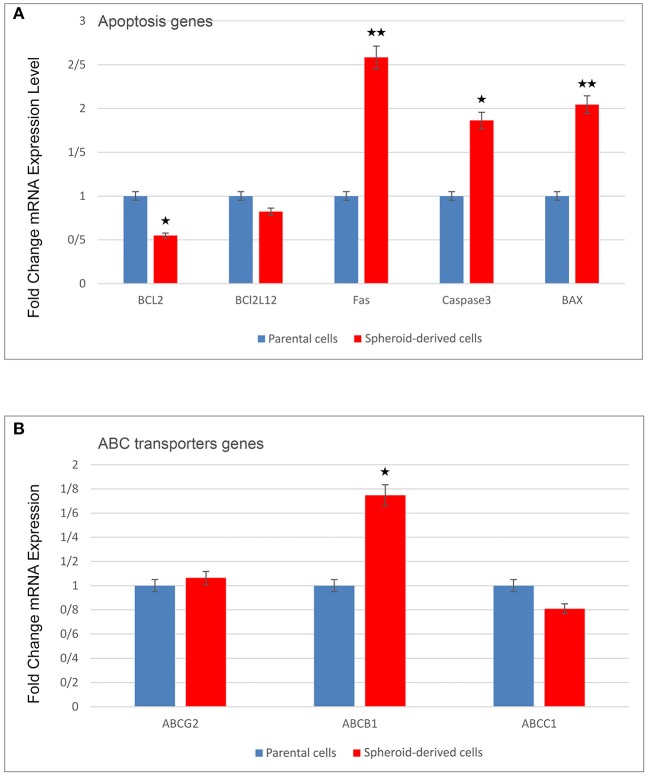
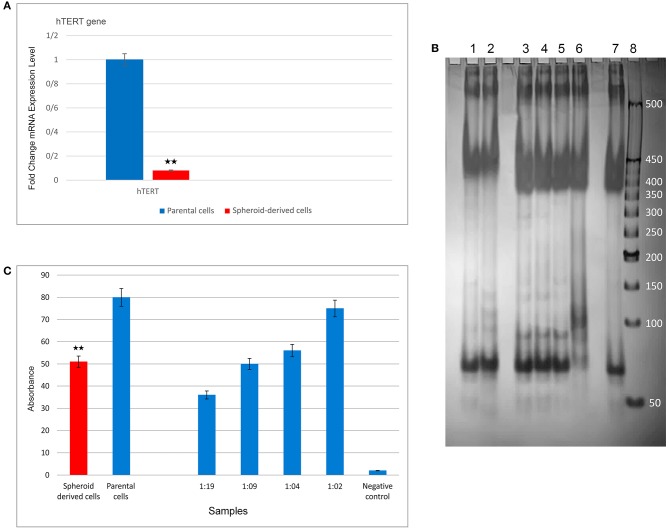
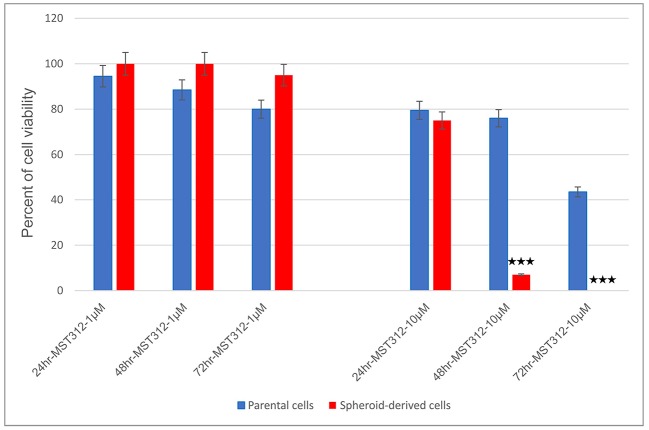
Cancer stem cells (CSCs) are a theorized small subpopulation of cells within tumors thought to be responsible for metastasis, tumor development, disease progression, treatment-resistance, and recurrence. The identification, isolation, and biological characterization of CSCs may therefore facilitate the development of efficient therapeutic strategies targeting CSCs. This study aims to compare the biology and telomerase activity of CSCs to parental cells (PCs) in renal cancer. Renal CSCs were enriched from the ACHN cell line using a sphere culture system. Spheroid-derived cells (SDCs) and their adherent counterparts were compared with respect to their colony and sphere formation, expression of putative CSC markers, tumorigenicity in non-obese diabetic/severe combined immunodeficiency (NOD/SCID) mice, and invasiveness. The expression of genes associated with CSCs, stemness, EMT, apoptosis, and ABC transporters was also compared between the two populations using quantitative real-time PCR (qRT-PCR). Finally, telomerase activity, hTERT expression, and sensitivity to MST-312, a telomerase inhibitor, was investigated between the two populations. We demonstrated that a subpopulation of ACHN cells was capable of growing as spheroids with many properties similar to CSCs, including higher clonogenicity, superior colony- and sphere-forming ability, and stronger tumorigenicity and invasiveness. In addition, SDCs demonstrated a higher expression of markers for CSCs, stemness, EMT, apoptosis, and ABC transporter genes compared to PCs. The expression of hTERT and telomerase activity in SDCs was significantly lower than PCs; however, the SDC population was more sensitive to MST-312 compared to PCs. These findings indicate that the SDC population exhibits stem-like potential and invasive characteristics. Moreover, the reduced expression of hTERT and telomerase activity in SDCs demonstrated that the expressions of hTERT and telomerase activity are not always higher in CSCs. Our results also showed that MST-312 treatment inhibited SDCs more strongly than PCs and may therefore be useful as a complementary targeted therapy against renal CSCs in the future.

Keywords: MST-312; cancer stem cells; hTERT; renal cell carcinoma; telomerase activity.


Figures

Figure 1
Figure 1
Sphere formation by ACHN cells. Spheroids derived from parental ACHN cells cultured in anchorage-independent conditions formed typical spheroids in the presence of growth factors at the second passage.
Figure 2
Figure 2
Clonogenicity and sphere-forming potential of parental cells (PCs) and spheroid-derived cells (SDCs). (A) Three types of colonies termed holo, mero, and paraclones were identified during the colony-formation assay in both PCs and SDCs. (B) The potential of clonogenicity was significantly higher in SDCs than in PCs. (C) The size of colonies was significantly larger in SDCs. (D) Results show a higher self-renewing capacity by SDCs compared to PCs. The colony number was counted under a dissection microscope. Data are represented as mean ± SD (n = 3 each). **P < 0.01, ***P < 0.001, and ****P < 0.0001.
Figure 3
Figure 3
Expression levels of putative CSC markers in parental cells (PCs) and spheroid-derived cells (SDCs) using flow cytometry. The results of (A,B) show higher expression in CD29 and reduced expression of CD90 in SDCs compared with PCs. Other markers, except CD44, showed higher expression in SDCs than in PCs. Data are represented as mean ± SD (n = 3 each). *P < 0.05, **P < 0.01, ***P < 0.001, and ****P < 0.0001.
Figure 4
Figure 4
The results of cell invasion by parental cells (PCs) and spheroid-derived cells (SDCs). (A) The graph shows a cell invasion standard curve. ACHN cells were harvested, diluted, incubated for 1 hour with Calcein-AM, and assayed for fluorescence. The trend line and line equation were included on the graph. (B) The final results of cell invasion assay showed that SDCs are significantly more invasive (2.3-fold) than PCs. Data are represented as mean ± SD (n = 3 each). ***P < 0.001.
Figure 5
Figure 5
Tumorigenicity in non-obese diabetic/severe combined immunodeficiency (NOD/SCID) mice. (A) Tumors derived from spheroid-derived cells (SDCs) were observed in NOD/SCID mice 19 days after injection, whereas no tumors were apparent in mice xenografted with parental cells (PCs) over the same time frame. (B) Tumor volume curves and (C) relative tumor volume (RTV) of PCs and SDCs. We observed a significantly earlier tumor onset and higher tumor volume in mice xenografted with SDCs compared to PCs. (Number of mice = 4). Data are represented as mean ± SD (n = 3 each). ***P < 0.001.
Figure 6
Figure 6
Expression levels of stemness and EMT genes using qRT-PCR, H&E, and immunohistochemical staining in xenograft tumors derived from parental cells (PCs) and spheroid-derived cells (SDCs) and expression levels of stemness and EMT genes in PCs of ACHN cell line and their SDCs by qRT-PCR. (A) Expression of all stemness genes and some EMT-related genes were higher in SDCs from xenograft tumors compared to PCs. (B) Results of H&E staining showed a clear cell RCC morphology. Immunohistochemical staining indicated increased expression of OCT4 and Nanog in tumors from SDCs compared to PCs. (C) SDCs showed significantly higher mRNA levels of all stemness genes compared to PCs. (D) In EMT-related genes, significantly higher levels of Snail1, Twist2, Zeb1, and Vimentin mRNA and significantly lower levels of Snail2, E-cadherin, and Twist1 mRNA were observed in SDCs compared to PCs. There were no significant differences in mRNA expressions of N-cadherin and Zeb2 in the two cell populations. Data are represented as mean ± SD (n = 3 each). *P < 0.05, **P < 0.01, ***P < 0.001, and ****P < 0.0001.
Figure 7
Figure 7
A comparison of pro- and anti-apoptotic genes as well as ABC transporters genes expression in parental cells (PCs) and spheroid-derived cells (SDCs) by qRT-PCR. (A) Anti-apoptotic gene BCL2 was lower and pro-apoptotic genes, including Fas and casapase-3, and Bax were higher in SDCs compered to PCs. (B) ABCB1 was expressed higher in SDCs than in PCs among ABC transporter genes examined. Data are represented as mean ± SD (n = 3 each). *P < 0.05, **P < 0.01.
Figure 8
Figure 8
Expression levels of hTERT and telomerase activity using qRT-PCR and TRAP assay (PCR and ELISA) in parental cells (PCs) and spheroid-derived cells (SDCs), respectively. (A) Expression of hTERT was lower in SDCs than PCs. (B) PCR products were electrophoresed on a 10% polyacrylamide gel to evaluate the telomerase activity. Lane 1: SDCs, lane 2: PCs, lanes 3– 6: positive controls diluted: 1:19, 1: 09, 1: 04, and 1: 02, respectively, lane 7: heat-treated cell extract (negative control), and lane 8: 50 bp DNA Ladder. Positive controls (lanes 3–6) exhibited a strong band 90 bp indicative of telomerase activity, and the negative control (lane 7) did not exhibit this telomerase-specific band. The telomerase activity in lane 2, containing PCs, demonstrated more strong banding compared to the SDCs in lane 1. (C) The results of telomerase activity using ELISA showed reduced telomerase activity in SDCs compared to the PCs. Also, we observed that increased expression of telomerase activity in control samples from 1:19 to 1:02. Data are represented as mean ± SD (n = 3 each). **P < 0.01.
Figure 9
Figure 9
Telomerase inhibition with MST-312 in parental cells (PCs) and spheroid-derived cells (SDCs). The PCs and SDCs were treated with MST-312 at 1 μM (left) and 10 μM (right) for 24, 48, and 72 h. After 48 and 72 h of 10 μM MST-312 treatment, there was a greater decrease in cell viability of SDCs compared to PCs. Data are represented as mean ± SD (n = 3 each). ***P < 0.001.

Similar articles

Cited by

References

    1. Bhatt JR, Finelli A. Landmarks in the diagnosis and treatment of renal cell carcinoma. Nat Rev Urol. (2014) 11:517. 10.1038/nrurol.2014.194 - DOI - PubMed
    1. Motzer RJ, Jonasch E, Agarwal N, Beard C, Bhayani S, Bolger GB, et al. . Kidney cancer, version 3.2015. J Natl Comprehens Cancer Netw. (2015) 13:151–9. 10.6004/jnccn.2015.0022 - DOI - PubMed
    1. Siegel RL, Miller KD, Jemal A. Cancer statistics, 2018. CA Cancer J Clin. (2018) 68:7–30. 10.3322/caac.21442 - DOI - PubMed
    1. Flanigan RC, Campbell SC, Clark JI, Picken MM. Metastatic renal cell carcinoma. Curr Treat Options Oncol. (2003) 4:385–90. 10.1007/s11864-003-0039-2 - DOI - PubMed
    1. Bitting RL, Healy P, Creel PA, Turnbull J, Morris K, Wood SY, et al. . A phase Ib study of combined VEGFR and mTOR inhibition with vatalanib and everolimus in patients with advanced renal cell carcinoma. Clin Genitourin Cancer. (2014) 12:241–50. 10.1016/j.clgc.2013.11.020 - DOI - PMC - PubMed

LinkOut - more resources