. 2019 Dec 19:9:1363.
doi: 10.3389/fonc.2019.01363. eCollection 2019.

Expression and Function of the Endocannabinoid Modulating Enzymes Fatty Acid Amide Hydrolase and N-Acylphosphatidylethanolamine-Specific Phospholipase D in Endometrial Carcinoma

Affiliations

Expression and Function of the Endocannabinoid Modulating Enzymes Fatty Acid Amide Hydrolase and N-Acylphosphatidylethanolamine-Specific Phospholipase D in Endometrial Carcinoma

Thangesweran Ayakannu et al. Front Oncol. .

Abstract

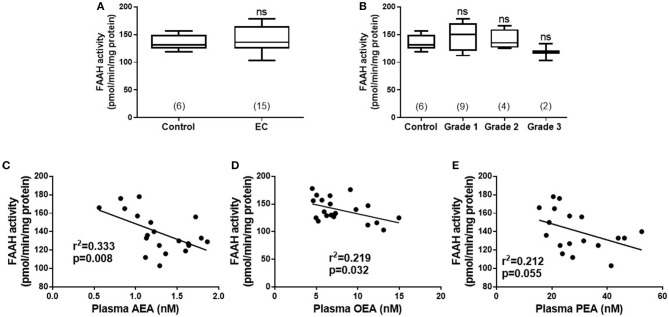
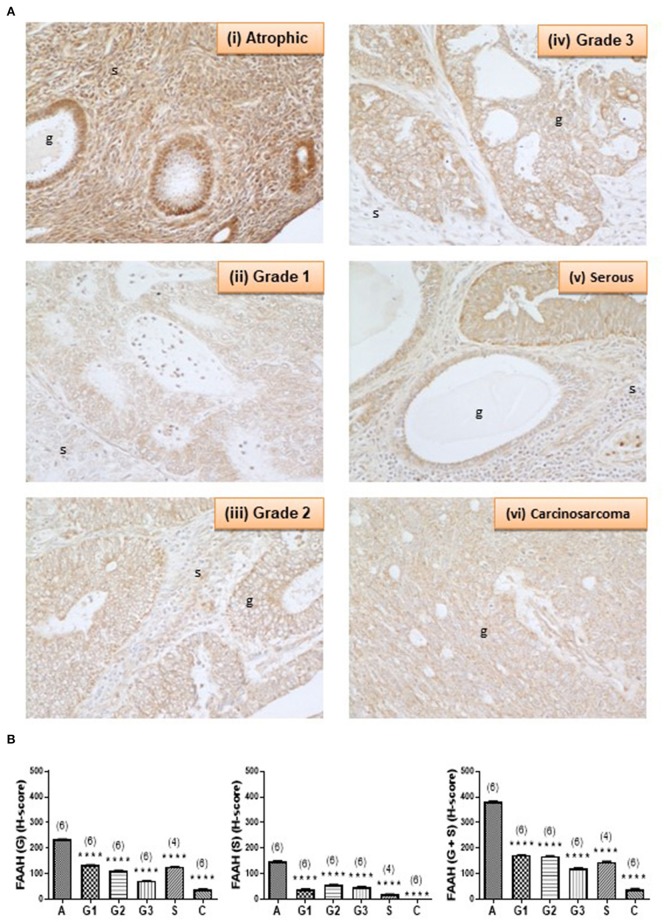
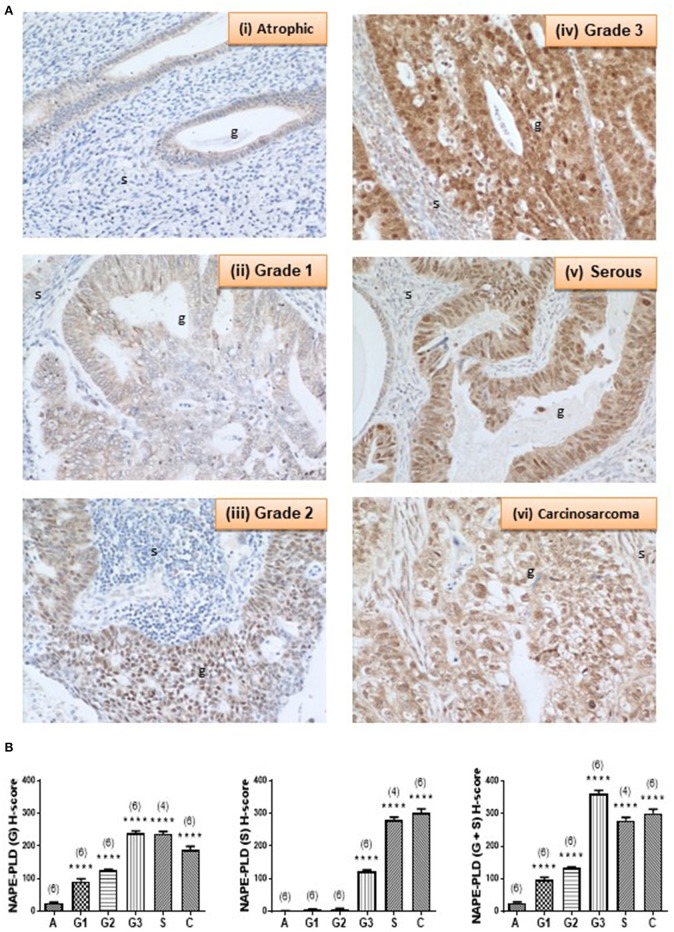
Background: The concentrations of three N-acylethanolamines (NAEs), anandamide (AEA), N-oleoylethanolamide (OEA), and N-palmitylethanolamide (PEA) are increased in the endometria of women with endometrial cancer (EC). It is widely accepted that plasma levels of these three NAEs are regulated by the actions of the rate-limiting enzymes N-acylphoshatidylethanolamine-specific phospholipase D (NAPE-PLD) and fatty acid amide hydrolase (FAAH), which are synthesizing and degradative, respectively. The expression and activity of these enzymes have not previously been studied in EC. Methods: FAAH activity in peripheral blood lymphocytes, and transcript and protein expression for FAAH and NAPE-PLD in EC tissues were measured using enzyme, quantitative RT-PCR, and histomorphometry (of immunoreactive tissue sections), respectively. Samples were from 6 post-menopausal women with atrophic endometria (controls) and 34 women with histologically diagnosed EC. Concentrations of the three NAEs also measured in plasma and tissues were correlated with lymphocytic FAAH activity and the NAPE-PLD and FAAH transcript and protein levels. Results: Peripheral lymphocyte FAAH activity was unaffected in women with EC compared to controls. The FAAH transcript expression level was significantly (p < 0.0001) 75% lower in EC whilst NAPE-PLD levels were not significantly (p = 0.798) increased. In line with the transcript data, a significant (p < 0.0001) tumor type-dependent 70-90% decrease in FAAH protein and significant 4- to 14-fold increase in NAPE-PLD protein (p < 0.0001) was observed in the malignant tissue with more advanced disease having lower FAAH and higher NAPE-PLD expression than less advanced disease. Correlation analyses also confirmed that tissue NAE concentrations were inversely related to FAAH expression and directly correlated to NAPE-PLD expression and the NAPE-PLD/FAAH ratio. Conclusion: These data support our previous observation of tissue levels of AEA, OEA, and PEA and a role for NAE metabolism in the pathogenesis of EC.

Keywords: N-acylphoshatidylethanolmine-specific phospholipase D; endocannabinoids; endometrial cancer; fatty acid amide hydrolase; gene expression; immunohistochemistry.


Figures

Figure 1
Figure 1
FAAH activity in peripheral blood lymphocyte membranes and relationship to plasma endocannabinoid concentrations. (A) Shows the FAAH activities [presented as median (IQR and range)] in lymphocyte membranes isolated from women with type 1 endometrial cancer (EC; n = 6) compared to that of post-menopausal women with atrophic endometria (control; n = 15). The EC group was subsequently divided into the different grades of type 1 EC (B) with (n = 6; control group), grade 1 (n = 9), grade 2 (n = 4), and grade 3 (n = 2). Spearman correlation analyses between lymphocytic FAAH activity and plasma AEA concentrations (C; n = 19), OEA concentrations (D; n = 21), and PEA concentrations (E; n = 18) are shown together with the Spearman's coefficient (r2) and p-value. Differences in FAAH activities (A) were examined by Mann-Whitney U-test and by Kruskal-Wallis one-way ANOVA with Dunn's multiple comparisons test (B); ns, not significantly different. The numbers in parentheses represent the number of samples tested in each group.
Figure 2
Figure 2
Relative expression of NAPE-PLD and FAAH transcript levels via qRT-PCR. The expression of NAPE-PLD transcripts (A) and FAAH transcripts (B) relative to the geometric mean of three housekeeping genes (IPO8, MRPL19, and PPIA) are shown for control (atrophic) endometria (A; n = 6), grade 1 (G1; n = 6), grade 2 (G2; n = 6), and grade 3 (G3, n = 3) type 1 EC tissue and serous (S, n = 3), and carcinosarcoma (C, n = 3) type 2 EC tissue. Data are presented as median (IQR). P-values were obtained using Kruskal-Wallis one ANOVA with Dunn's multiple comparisons test (**p = 0.0044; ***p = 0.0009). The numbers in parentheses represent the number of samples tested in each group.
Figure 3
Figure 3
FAAH immunoreactivity decreases in endometrial cancer. (A) Shows representative photomicrographs of immunoreactive FAAH staining in atrophic endometria and grade 1, 2, 3 type 1 EC, and serous and carcinosarcoma type 2 EC. Note the gradual change of staining in the glandular epithelial cells (g) from less to more advanced malignancy. Also note that FAAH immunoreactivity is higher in stromal cells of the atrophic endometrium than in any of the EC tissues, and the presence of cystic glands and normal glands in the serous EC samples. (B) Shows data from the histomorphometric analyses of the glands alone (G, left panel) and stromal tissue alone (S, middle panel) and for the entire tissue (G + S, right panel). The H-scores for FAAH staining was statistically significantly decreased in all the EC when compared to the atrophic endometria. The results are presented as means ± SD, with one way analysis of variance with Dunnett's ad hoc post-test analysis used to determine the p-values; ****p < 0.0001 compared to atrophic; n = 6 in all cases except for serous EC (where n = 4) and numbers are shown in parentheses above each bar. Error bars are not shown when encompassed by the data.
Figure 4
Figure 4
NAPE-PLD immunoreactivity increases in endometrial cancer. (A) Shows representative photomicrographs of immunoreactive NAPE-PLD staining in atrophic endometria and grade 1, 2, 3 type 1 EC, and serous and carcinosarcoma type 2 EC. Note the gradual change of staining in glandular epithelial cells (g) from the less to more advanced malignancy. Also note the apparent lack of staining in the stromal cells of the atrophic endometria. (B) Shows data from the histomorphometric analyses of the glands alone (G, left panel) and stromal tissue alone (S, middle panel) and for the entire tissue (G + S, right panel). NAPE-PLD staining was statistically significantly increased in all the EC when compared to the atrophic endometria. The results are presented as means ± SD. Statistical significance was determined using one way analysis of variance with Dunnett's ad hoc post-test analysis; ****p < 0.0001 compared to atrophic; n = 6 in all cases except for serous EC (where n = 4). The sample numbers are shown in parentheses above each bar.
Figure 5
Figure 5
Comparison of the relative levels of transcripts for NAPE-PLD and FAAH with H-scores for the presence of protein. (A,B) Show the relative expressions of NAPE-PLD transcripts and protein, respectively in the atrophic tissue (atrophic control, n = 6) and the EC cohort (n = 21 for qRT-PCR and n = 28 for IHC). The data show similar patterns of expression with NAPE-PLD transcripts and protein increased in the EC group. Similarly, (C,D) show the relative expressions of FAAH transcript and protein in the same groups and show decreased transcript and protein expression in the EC group. (E) Shows that the expression of NAPE-PLD transcript does not correlate with FAAH transcript levels, but there is a good inverse correlation between NAPE-PLD and FAAH protein (F). The qRT-PCR data (A,C) are presented as median (IQR) and analyzed using Mann-Whitney U-test, whilst the H-score data (B,D) are presented as mean ± SEM and analyzed by unpaired Student's t-test; ***p < 0.001; ****p < 0.0001. The number of samples analyzed is shown in parentheses above each group. Correlation was determined by Spearman correlation with the calculated coefficients and p-values indicated on the graphs. Error bars are not shown when encompassed by the data. The NAPE-PLD: FAAH ratios for transcript (G) and protein (H) were determined for the atrophic (control, n = 6) tissue and for EC (n = 28) tissue and the results plotted for each individual patient recruited. The longer horizontal bar indicates the mean for the data whilst the shorter horizontal bar indicates the SD for the group. The p-values for the transcript ratio difference (*p = 0.0208) and the protein ratio difference (****p < 0.0001) were calculated using Welch's correction for Student's two sided unpaired t-test for unequal variances. Error bars are not shown when encompassed by the data. The number of samples assayed is shown in parentheses above each bar.
Figure 6
Figure 6
Working hypothesis on how FAAH and NAPE-PLD expression and other components of the endocannabinoid system affects NAE levels in endometrial cancer. In this figure, we depict the endocannabinoid system in normal endometrium, in type 1 EC and in type 2 EC. In the normal situation (left), endometrial tissue growth is controlled by a balance between apoptosis and cell proliferation resulting in no net gain of tissue. Relatively high levels of FAAH protein and low levels of NAPE-PLD protein keep the destruction and production of the NAEs, AEA, OEA, and PEA in the normal range within the tissue. Plasma AEA, OEA, and PEA levels are also modulated by the actions of NAPE-PLD in endothelial cells and FAAH activities in T-lymphocytes to keep plasma NAE concentrations within the normal range. The presence of excess estrogen (E2) results in malignant transformation of the endometrium into type 1 EC tissue (middle). Concomitant with that transformation is an increase in the expression of NAPE-PLD in the tissue and a loss of FAAH, cannabinoid receptor 1 (CBR1) and 2 (CB2R) (23). This allows the NAEs to bind to and activate GPR55 receptors, which may increase cellular proliferation such that it exceeds the apoptosis effect of AEA binding to the TRPV1 receptor (24). The lack of CBR1 and CBR2 receptor turnover and the increased synthesis and reduced degradation of NAEs in the tumor, results in excess release of the NAEs into the blood, where OEA is preferentially degraded by lymphocytic FAAH resulting in the “entourage effect” and the observed higher AEA and PEA concentrations seen in these patients. Less is known about the role of the endocannabinoid system in type 2 EC (right), but higher NAPE-PLD and lower FAAH, CBR1, and CBR2 expression values also results in nascent NAE production and release into the blood and similar FAAH degradation of the NAEs as found in type 1 EC. Whether the loss of CBR1 and CBR2 in type 2 EC releases the TRPV1 and GPR55 receptors to respond to the remaining NAE (or other ligands) to affect apoptosis or cell proliferation is currently unknown, as is the primary initiating factor (black X) or the factor involved in E2 desensitization (white X) that allows drug-resistant forms of type 1 EC to convert to type 2 EC. In all cases, the synthesis and degradation of the NAEs by endothelial cells and T-lymphocytes, respectively, seems to be unaffected.

Similar articles

Cited by

References

    1. Ayakannu T, Taylor AH, Marczylo TH, Maccarrone M, Konje JC. Identification of novel predictive biomarkers for endometrial malignancies: N-acylethanolamines. Front Oncol. (2019) 9:430. 10.3389/fonc.2019.00430 - DOI - PMC - PubMed
    1. Taylor AH, Abbas MS, Habiba MA, Konje JC. Histomorphometric evaluation of cannabinoid receptor and anandamide modulating enzyme expression in the human endometrium through the menstrual cycle. Histochem. Cell Biol. (2010) 133:557–65. 10.1007/s00418-010-0695-9 - DOI - PubMed
    1. Gebeh AK, Willets JM, Marczylo EL, Taylor AH, Konje JC. Ectopic pregnancy is associated with high anandamide levels and aberrant expression of FAAH and CB1 in fallopian tubes. J. Clin. Endocrinol. Metab. (2012) 97:2827–35. 10.1210/jc.2012-1780 - DOI - PubMed
    1. Scotchie JG, Savaris RF, Martin CE, Young SL. Endocannabinoid regulation in human endometrium across the menstrual cycle. Reprod. Sci. (2015) 22:113–23. 10.1177/1933719114533730 - DOI - PMC - PubMed
    1. Matias I, Di Marzo V. Endocannabinoid synthesis and degradation, and their regulation in the framework of energy balance. J Endocrinol Invest. (2006) 29:15–26. - PubMed

LinkOut - more resources