Review
. 2019 Dec 11:7:395.
doi: 10.3389/fbioe.2019.00395. eCollection 2019.

Technology Advancements in Blood Coagulation Measurements for Point-of-Care Diagnostic Testing

Affiliations
Review

Technology Advancements in Blood Coagulation Measurements for Point-of-Care Diagnostic Testing

Mohammad Mohammadi Aria et al. Front Bioeng Biotechnol. .

Abstract

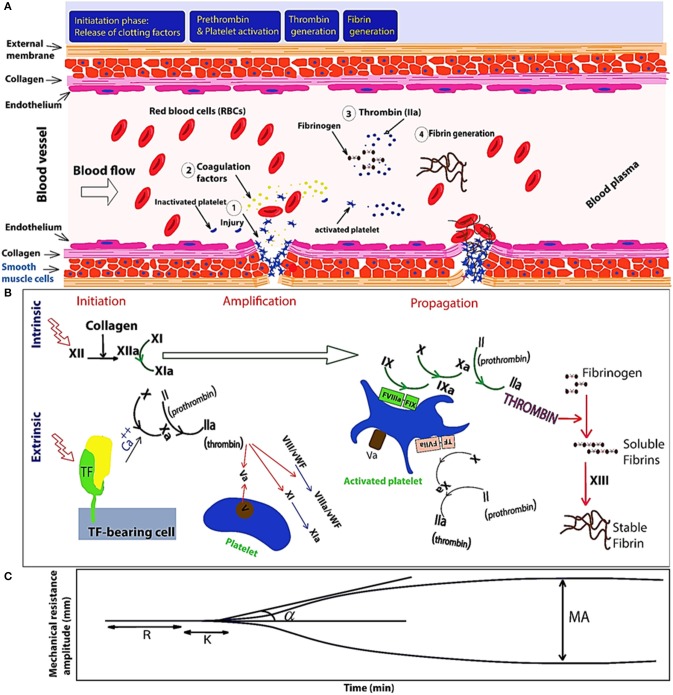
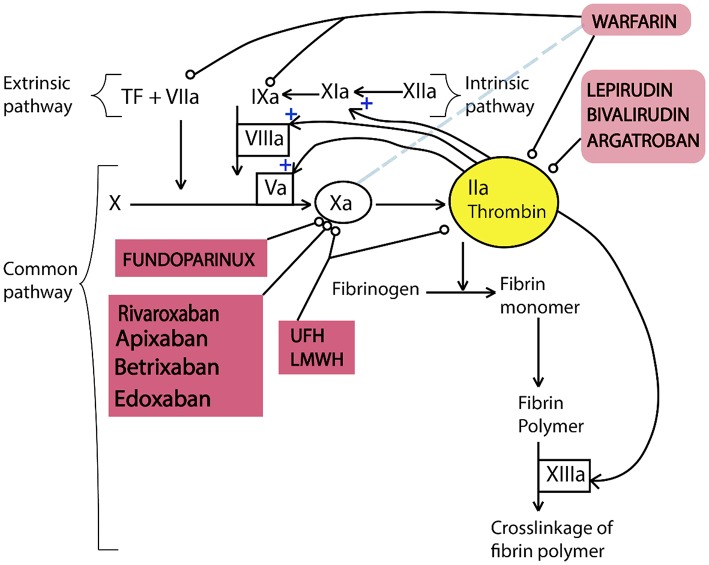
In recent years, blood coagulation monitoring has become crucial to diagnosing causes of hemorrhages, developing anticoagulant drugs, assessing bleeding risk in extensive surgery procedures and dialysis, and investigating the efficacy of hemostatic therapies. In this regard, advanced technologies such as microfluidics, fluorescent microscopy, electrochemical sensing, photoacoustic detection, and micro/nano electromechanical systems (MEMS/NEMS) have been employed to develop highly accurate, robust, and cost-effective point of care (POC) devices. These devices measure electrochemical, optical, and mechanical parameters of clotting blood. Which can be correlated to light transmission/scattering, electrical impedance, and viscoelastic properties. In this regard, this paper discusses the working principles of blood coagulation monitoring, physical and sensing parameters in different technologies. In addition, we discussed the recent progress in developing nanomaterials for blood coagulation detection and treatments which opens up new area of controlling and monitoring of coagulation at the same time in the future. Moreover, commercial products, future trends/challenges in blood coagulation monitoring including novel anticoagulant therapies, multiplexed sensing platforms, and the application of artificial intelligence in diagnosis and monitoring have been included.

Keywords: MEMS; POC devices; blood coagulation; electrochemical sensing; fluorescent microscopy; microfluidics; nanomaterials; photoacoustic detection.


Figures

Figure 1
Figure 1
Schematic of the primary and secondary phases of hemostasis. (A) Initiation of hemostasis by an injury to a blood vessel. (B) Illustrates three phases of initiation, amplification (platelet activation happens during the initiation phase, and is probably mediated through multiple platelet signaling pathways and thrombin), and propagation triggered by extrinsic and intrinsic pathways. Extrinsic pathway is triggered by tissue factor (TF)-activated coagulation factor VII (fVIIa) and consequently TF-fVIIa complex triggers Ca++ (calcium) ion-dependent enzymatic reactions in response to injury of blood vessels composed of endothelial cells and the vessel wall. Intrinsic pathway also is initiated by contact with collagen and XII will be activated as XIIa (a = activated). When XIIa is present, factor XI will be activated. Then, XIa will activate factor IX. Also, factor Xia together with factor VIII will convert factor X into Xa. Finally, Xa will activate the Prothrombin-activator; triggering the Common Coagulation Pathway. Von Willebrand factors (vWFs) bind factor VIII, which is a key clotting protein, and it helps in forming a platelet plug during the clotting process. (C) TEG signal at the bottom shows the changes in the viscoelastic properties vs. time. Reaction time (R) represents delay time from test initiation until beginning of fibrin formation, measured as an increase in amplitude of 2 mm. The clotting time (K) is the time to clot formation, measured from the end of R until an amplitude of 20 mm is reached. The angle (a) represents the kinetic of fibrin accumulation and bonding. Maximum amplitude (MA) represents clot strength.
Figure 2
Figure 2
Schematic of microfluidic viscometer based blood coagulation monitoring devices. (A) Shear gradient-activated microfluidic device consisting of a syringe pump generates blood flow and an inline pressure sensor that is connected to the device via tubing measures the pressure to determine micro-clotting time. Fluorescence microscopy of fibrinogen and platelets also enables monitoring of thrombus formation at the same time (Jain et al., 2016a). (B) Schematic of the blood coagulation measurement system including a peristaltic pump, a microfluidic device, and a flow stabilizer. As the pressure and blood viscosity is correlated to the interfacial changes, an interfacial line between the PBS solution and blood sample is induced by closing the outlet of the PBS flow (Yeom et al., 2016). (C) Schematic of the micropillar arrays and microclot formation under platelet flow. Right-top shows the SEM image of two pillars and the microclot which formed between them (with 200 μm scale bar). Right-bottom shows micropillar deflection and tensile force to measure clot contractile force and stiffness, respectively (Chen et al., 2019).
Figure 3
Figure 3
Illustrates different applications of nanomaterials. (A) Application of nanomaterials in wound healing. (B) Targeted drug delivery system utilizing polyelectrolyte multilayer capsule (Muthiah Pillai et al., 2019). (C) Platelet-hybridized system for targeted delivery of hemostatic agents utilizing polyelectrolyte multilayer capsules (Hansen et al., 2017). (D) APTT test based on Silica nanoparticles and photoacoustic detection technology (Wang et al., 2016).
Figure 4
Figure 4
Two commercial devices for viscoelastic (TEG-6S system) and thrombodynamic analysis (Thrombodynamics Analyzer System). (A) Image of TEG® 6s system TEG-6S analyzer and (B) microfluidic TEG6s cartridge (images courtesy of Haemonetics Corporation, USA). (C) Thrombodynamics® Analyzer, schematic of a plastic cuvette, and an inserted activator for Thrombodynamic measurement, (D) the images from growth of a clot initiated with the activator, and spontaneous clots in the bulk of the sample (images courtesy of Hemacore Corporation, Russia).
Figure 5
Figure 5
Simplified diagram illustrating the function of anticoagulants in the coagulation cascade. Coagulation cascade includes three pathways of intrinsic, extrinsic, and common pathways. In this diagram, thrombin has positive effect on the further activation of the intrinsic and common pathways. All anticoagulants affect factors of the intrinsic and common pathways except warfarin which reduces the rate of hepatic synthesis of factor VII. This figure is reproduced from American Journal of Neuroradiology, 2012 (Hussein et al., 2012).

References

    1. Andersson M., Andersson J., Sellborn A., Berglin M., Nilsson B., Elwing H. (2005). Quartz crystal microbalance-with dissipation monitoring (Qcm-D) for real time measurements of blood coagulation density and immune complement activation on artificial surfaces. Biosens. Bioelectron. 21, 79–86. 10.1016/j.bios.2004.09.026 - DOI - PubMed
    1. Aria M. M., Irajizad A., Astaraei F. R., Shariatpanahi S. P., Sarvari R. (2016). Ethanol sensing properties of Pvp electrospun membranes studied by quartz crystal microbalance. Measurement 78, 283–288. 10.1016/j.measurement.2015.10.018 - DOI
    1. Baryshnikova E., Di Dedda U., Ranucci M. (2019). A comparative study of seer sonorheometry versus standard coagulation tests, rotational thromboelastometry, and multiple electrode aggregometry in cardiac surgery. J. Cardiothorac. Vasc. Anesth. 33, 1590–1598. 10.1053/j.jvca.2019.01.011 - DOI - PubMed
    1. Berney H., O'Riordan J. J. (2008). Impedance measurement monitors blood coagulation. Anal. Dial. 42, 42–08.
    1. Bernhardt I., Wesseling M. C., Nguyen D. B., Kaestner L. (2019). Red blood cells actively contribute to blood coagulation and thrombus formation. Erythrocyte. Intechopen. 10.5772/intechopen.86152 - DOI

LinkOut - more resources