. 2019 Dec 6:7:399.
doi: 10.3389/fbioe.2019.00399. eCollection 2019.

Analysis of the Effectiveness of Sub-sensory Electrical Noise Stimulation During Visuomotor Adaptations in Different Visual Feedback Conditions

Affiliations

Analysis of the Effectiveness of Sub-sensory Electrical Noise Stimulation During Visuomotor Adaptations in Different Visual Feedback Conditions

Anna Margherita Castronovo et al. Front Bioeng Biotechnol. .

Abstract

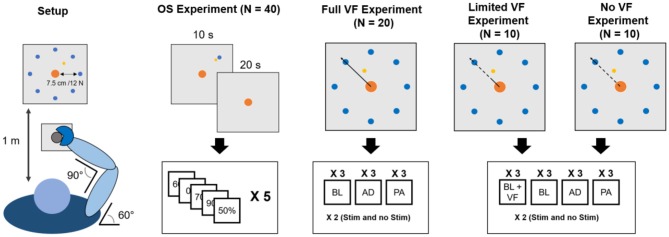
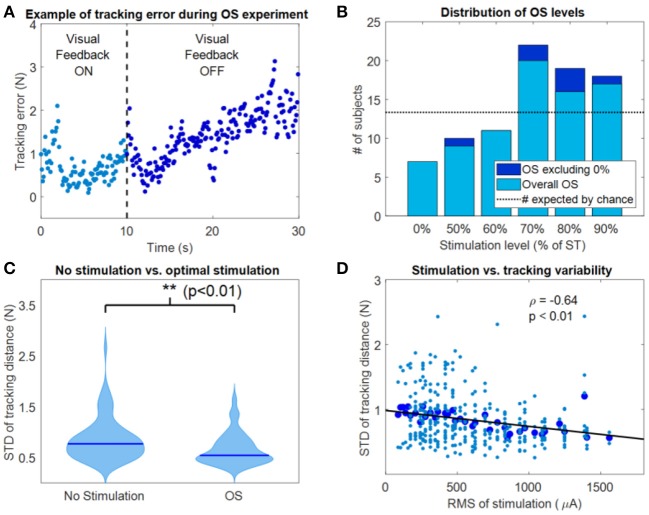
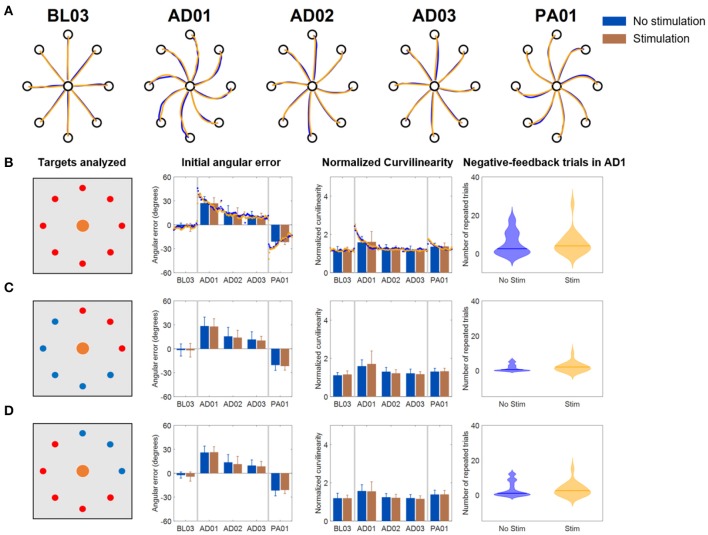
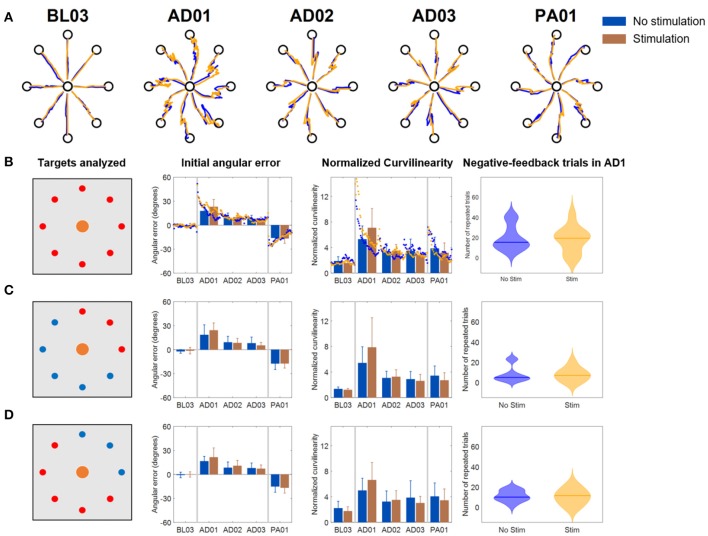
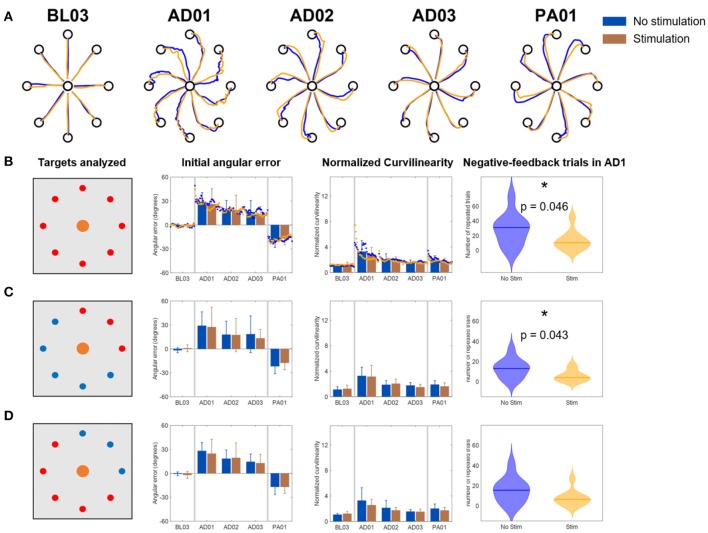
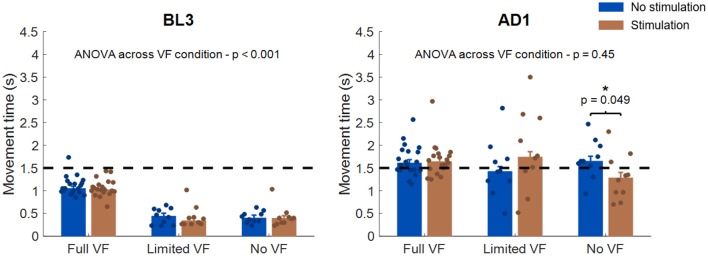
Sub-sensory electrical noise stimulation has been shown to improve motor performance in tasks that mainly rely on proprioceptive feedback. During the execution of movements such as reaching, proprioceptive feedback combines dynamically with visual feedback. It is still unclear whether boosting proprioceptive information in tasks where proprioception mixes with vision can influence motor performance. To better understand this point, we tested the effect of electrical noise stimulation applied superficially to the muscle spindles during four different experiments consisting of isometric reaching tasks under different visual feedback conditions. The first experiment (n = 40) consisted of a reach-and-hold task where subjects had to hold a cursor on a target for 30 s and had visual feedback removed 10 s into the task. Subjects performed 30 repetitions of this task with different stimulation levels, including no stimulation. We observed that trials in which the stimulation was present displayed smaller movement variability. Moreover, we observed a positive correlation between the level of stimulation and task performance. The other three experiments consisted of three versions of an isometric visuomotor adaptation task where subjects were asked to reach to random targets in <1.5 s (otherwise incurring in negative feedback) while overcoming a 45° clockwise rotation in the mapping between the force exerted and the movement of the cursor. The three experiments differed in the visual feedback presented to the subjects, with one group (n = 20) performing the experiment with full visual feedback, one (n = 10) with visual feedback restricted only to the beginning of the trajectory, and one (n = 10) without visual feedback of the trajectory. All subjects performed their experiment twice, with and without stimulation. We did not observe substantial effects of the stimulation when visual feedback was present (either completely or partially). We observed a limited effect of the stimulation in the absence of visual feedback consisting in a significant smaller number of negative-feedback trials and a significant smaller movement time in the first block of the adaptation phase. Our results suggest that sub-sensory stimulation can be beneficial when proprioception is the main feedback modality but mostly ineffective in tasks where visual feedback is actively employed.

Keywords: motor control; proprioception; stochastic resonance; visual feedback; visuomotor adaptation.


Figures

Figure 1
Figure 1
Experimental setup. Subjects maintained the same position (leftmost panel) through all the experiments. During the OS experiment subjects had visual feedback during the reaching part of the trial and the first 10 s of holding and no visual feedback for the remaining 20 s. In the VMA experiments, visual feedback (bold line marks when it is present, dashed line when it is absent) changed across the different versions of the experiment. In the Full VF version feedback was always present. In the Limited VF version feedback was present only in a 2 cm radius from the center. In the No VF version feedback was present only for distances longer than that of the target. In total, each subject experienced the OS experiment twice (once per experimental session, each time consisting of 60 30-s reach-and-hold trials) and one of the three versions of the VMA experiment twice (once per experimental session, the same VMA version both times). Each VMA experiment consisted of 9 (for the Full VF) or 12 (for the Limited and No VF) blocks each consisting of a minimum of 40 movements. In each block subjects repeated the reaching trials that took them more than 1.5 s to perform. Thus, in each experimental session subjects performed a minimum of 360–480 reaching movements.
Figure 2
Figure 2
Performance metrics for the VMA experiment. The initial angular error (left) was calculated, for each movement repetition, as the angle between the actual and optima trajectories at 2 cm from the center of the workspace. The normalized curvilinearity (right) was calculated, for each movement repetition, as the ratio between the actual movement path and the ideal one.
Figure 3
Figure 3
Results of the OS experiment. (A) Example of tracking error during a representative instance of the OS experiment. Movement variability around the target position increased as visual feedback was removed. (B) Distribution of the OS values, both including (light blue) and excluding (dark blue) the 0% level. (C) Violin plots of the tracking variability between OS values and 0% (no stimulation) values. **Indicates significant differences (Wilcoxon's signed rank test) with p < 0.01. (D) Correlation between the RMS of stimulation and the STD of the tracking distance during the OS experiment.
Figure 4
Figure 4
Results of the VMA Full VF experiment. (A) Example of force traces to targets for representatives blocks of the experiment. (B) Average, across subjects, performance metrics. The first panel from the left presents the targets analyzed (in red). The second panel presents the initial angular error metric, both as mean ± standard deviation across the first 40 trials of each block (bars and whiskers) and as average (across subject) of the metric extracted for each single reaching movement for the first 40 trials of each block (dots). The third panel presents the normalized curvilinearity metric, in the same notation. The fourth panel presents the violin plots of the number of negative-feedback trials (that had to be repeated) during AD1. (C,D) Present the same results for only the upper right quadrant targets of the workspace (where the muscles stimulated are active) and for the remaining targets. In this case the metric plots are presented only as the mean ± standard deviation across the trials of those targets in each block. In all plots, blue indicates the NoStim condition, Orange the Stim condition.
Figure 5
Figure 5
Results of the VMA Limited VF experiment. (A) Example of force traces to targets for representatives blocks of the experiment. (B) Average, across subjects, performance metrics. The first panel from the left presents the targets analyzed (in red). The second panel presents the initial angular error metric, both as mean ± standard deviation across the first 40 trials of each block (bars and whiskers) and as average (across subject) of the metric extracted for each single reaching movement for the first 40 trials of each block (dots). The third panel presents the normalized curvilinearity metric, in the same notation. The fourth panel presents the violin plots of the number of negative-feedback trials (that had to be repeated) during AD1. (C,D) Present the same results for only the upper right quadrant targets of the workspace (where the muscles stimulated are active) and for the remaining targets. In this case the metric plots are presented only as the mean ± standard deviation across the trials of those targets in each block. In all plots, blue indicates the NoStim condition, Orange the Stim condition.
Figure 6
Figure 6
Results of the VMA No VF experiment. (A) Example of force traces to targets for representatives blocks of the experiment. (B) Average, across subjects, performance metrics. The first panel from the left presents the targets analyzed (in red). The second panel presents the initial angular error metric, both as mean ± standard deviation across the first 40 trials of each block (bars and whiskers) and as average (across subject) of the metric extracted for each single reaching movement for the first 40 trials of each block (dots). The third panel presents the normalized curvilinearity metric, in the same notation. The fourth panel presents the violin plots of the number of negative-feedback trials (that had to be repeated) during AD1. *Indicates significant differences (Wilcoxon's signed rank test) in the number of negative-feedback trials with p < 0.05 [p = 0.046 in (B) and p = 0.043 in (C)]. (C,D) Present the same results for only the upper right quadrant targets of the workspace (where the muscles stimulated are active) and for the remaining targets. In this case the metric plots are presented only as the mean ± standard deviation across the trials of those targets in each block. In all plots, blue indicates the NoStim condition, Orange the Stim condition.
Figure 7
Figure 7
Analysis of movement time across VF and stimulation conditions. The left panel presents the results for BL3, the right panel for AD1. In each panel, each bar represents the median and standard error of the median movement time for each stimulation and VF condition. The dots represent the median values for each individual subject. The statistical analysis across VF conditions was based on ANOVA, while the statistical analysis between stimulation conditions was performed independently for each VF condition using Wilcoxon's signed rank test. *p < 0.05. The dotted black line in each panel represents the 1.5 s threshold that was set to mark negative-feedback trials.

Similar articles

Cited by

References

    1. Bates B. T. (1996). Single-subject methodology: an alternative approach. Med. Sci. Sports Exerc. 28, 631–638. 10.1249/00005768-199605000-00016 - DOI - PubMed
    1. Bernier P. M., Burle B., Vidal F., Hasbroucq T., Blouin J. (2009). Direct evidence for cortical suppression of somatosensory afferents during visuomotor adaptation. Cereb. Cortex 19, 2106–2113. 10.1093/cercor/bhn233 - DOI - PubMed
    1. Collins A., Blackburn T., Olcott C., Jordan J. M., Yu B., Weinhold P. (2014). A kinetic and kinematic analysis of the effect of stochastic resonance electrical stimulation and knee sleeve during gait in osteoarthritis of the knee. J. Appl. Biomech. 30, 104–112. 10.1123/jab.2012-0257 - DOI - PubMed
    1. Collins J. J., Chow C. C., Imhoff T. T. (1995). Aperiodic stochastic resonance in excitable systems. Phys. Rev. E Stat. Phys. Plasmas Fluids Relat. Interdiscip. Topics 52, R3321–R3324. 10.1103/PhysRevE.52.R3321 - DOI - PubMed
    1. Collins J. J., Priplata A. A., Gravelle D. C., Niemi J., Harry J., Lipsitz L. A. (2003). Noise-enhanced human sensorimotor function. IEEE Eng. Med. Biol. Mag. 22, 76–83. 10.1109/MEMB.2003.1195700 - DOI - PubMed

LinkOut - more resources