. 2020 Feb;53(2):e12758.
doi: 10.1111/cpr.12758. Epub 2020 Jan 10.

The role and potential mechanism of p75NTR in mineralization via in vivo p75NTR knockout mice and in vitro ectomesenchymal stem cells

Affiliations

The role and potential mechanism of p75NTR in mineralization via in vivo p75NTR knockout mice and in vitro ectomesenchymal stem cells

Manzhu Zhao et al. Cell Prolif. 2020 Feb.

Abstract

Objective: The aim of this study is to investigate the role and potential mechanism of p75NTR in mineralization in vivo using p75NTR-knockout mice and in vitro using ectomesenchymal stem cells (EMSCs).

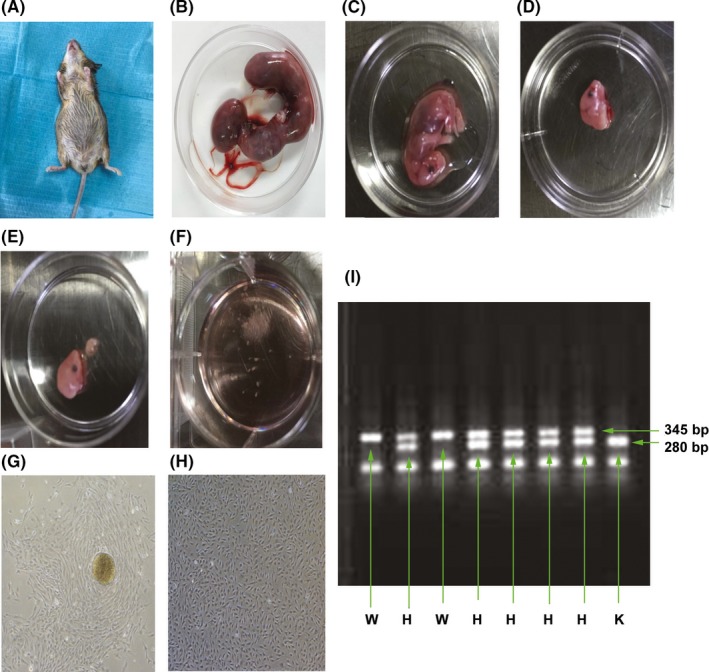
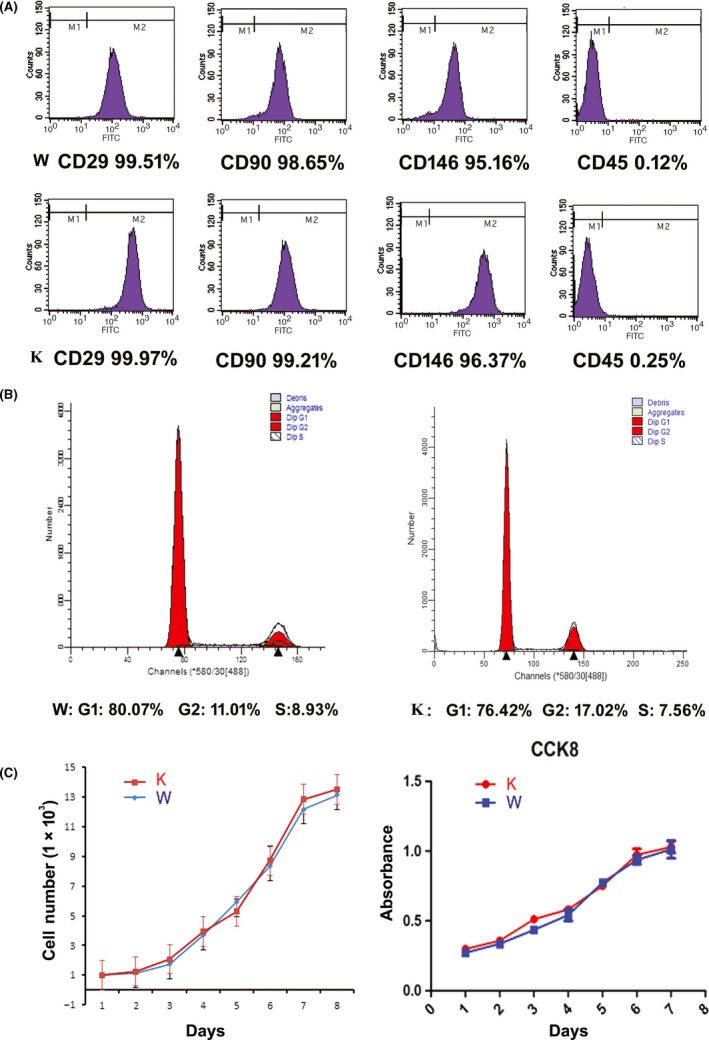
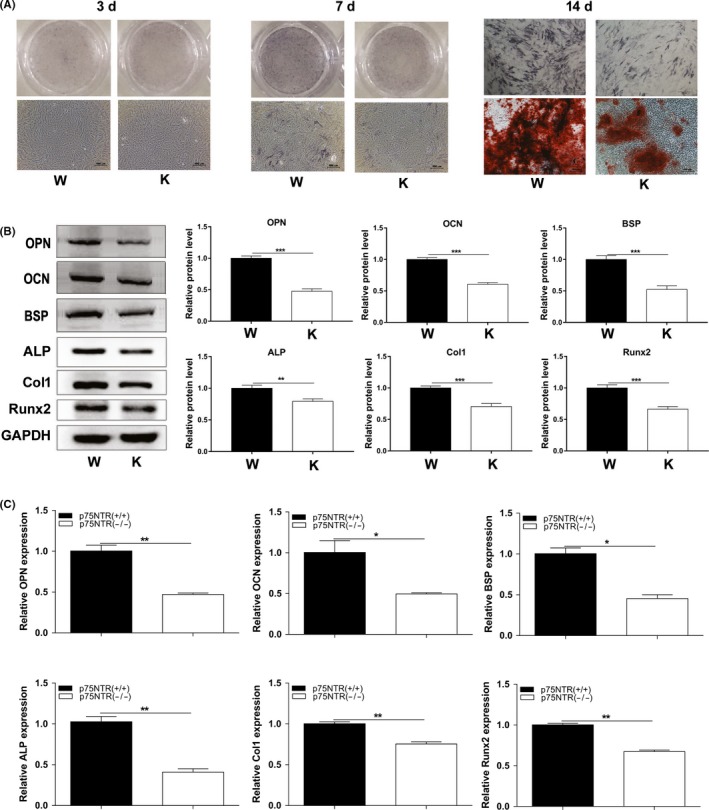
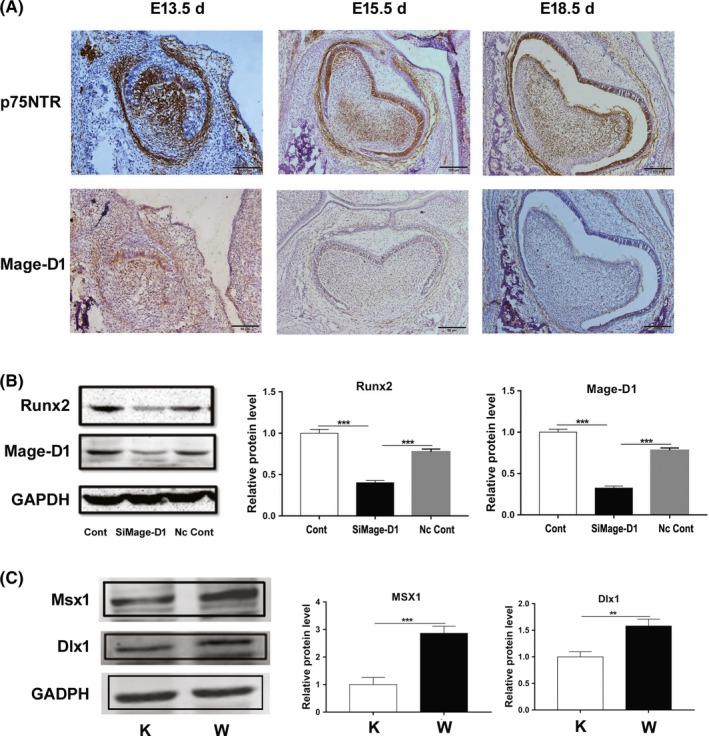
Materials and methods: Femur bone mass and daily incisor mineralization speed were assessed in an in vivo p75NTR-knockout mouse model. The molecular signatures alkaline phosphatase (ALP), collagen type 1 (Col1), melanoma-associated antigen (Mage)-D1, bone sialoprotein (BSP), osteocalcin (OCN), osteopontin (OPN), distal-less homeobox 1 (Dlx1) and Msh homeobox 1 (Msx1) were examined in vitro in EMSCs isolated from p75NTR+/+ and p75NTRExIII-/- mice.

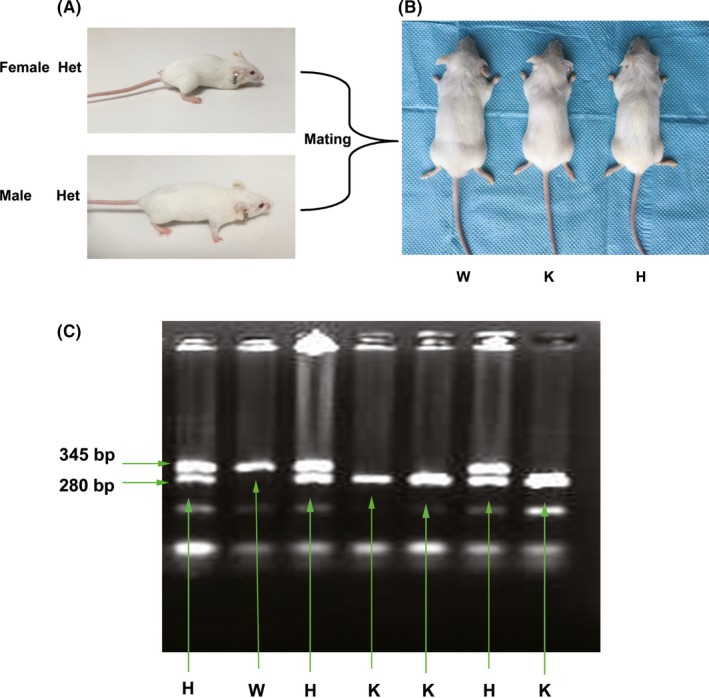
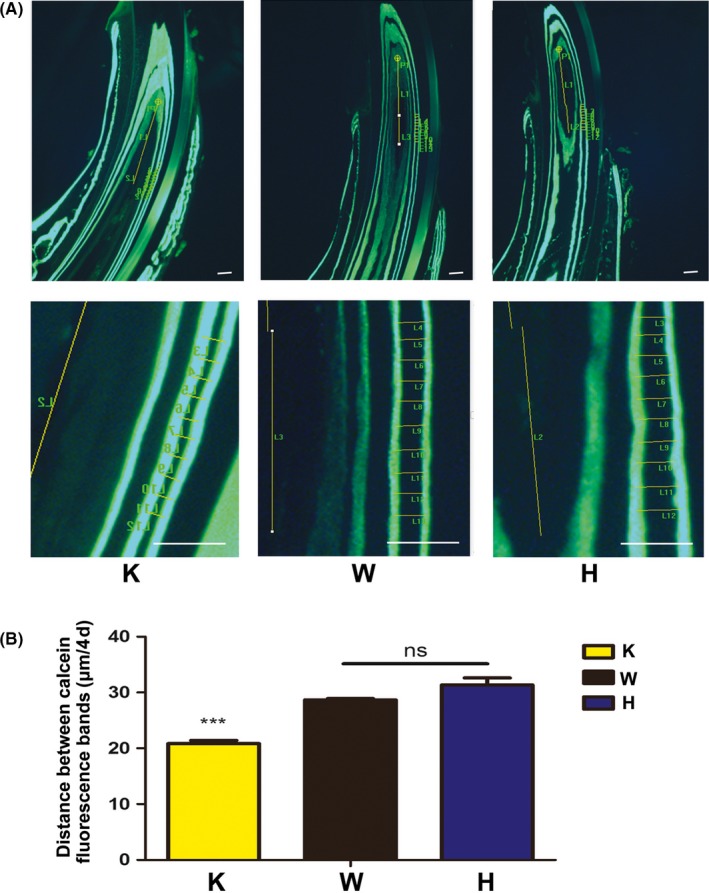
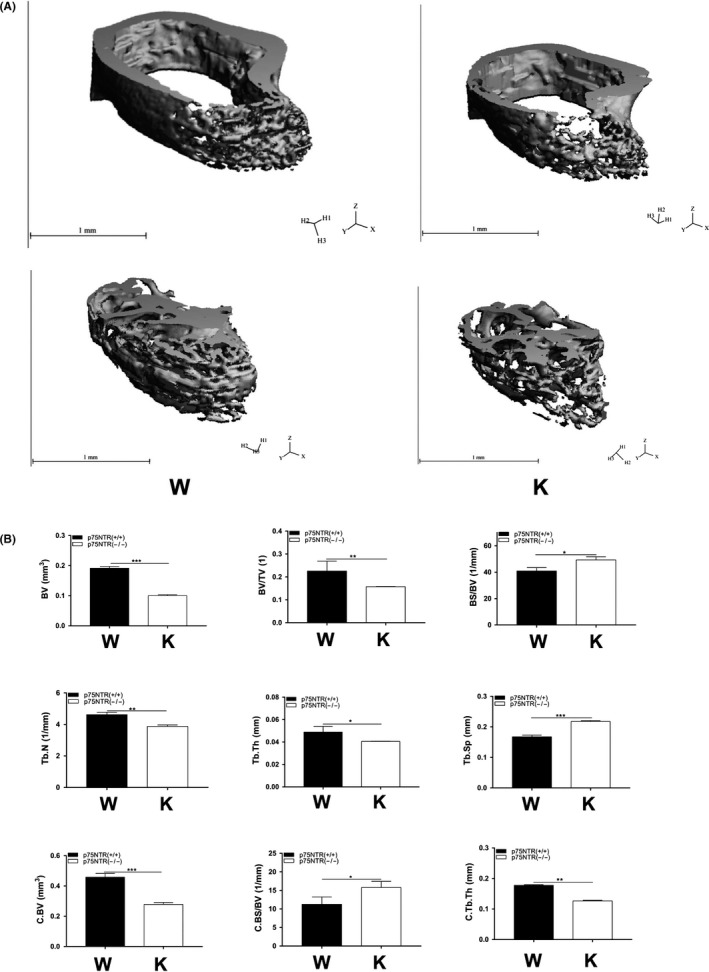
Results: p75NTR-knockout mice were smaller in body size than heterozygous and wild-type mice. Micro-computed tomography and structural quantification showed that the osteogenic ability of p75NTRExIII -knockout mice was significantly decreased compared with that of wild-type mice (P < .05). Weaker ALP and alizarin red staining and reduced expression of ALP, Col1, Runx2, BSP, OCN and OPN were also observed in p75NTRExIII-/- EMSCs. Moreover, the distance between calcein fluorescence bands in p75NTRExIII -knockout mice was significantly smaller than that in wild type and heterozygous mice (P < .05), indicating the lower daily mineralization speed of incisors in p75NTRExIII -knockout mice. Further investigation revealed a positive correlation between p75NTR and Mage-D1, Dlx1, and Msx1.

Conclusion: p75NTR not only promotes osteogenic differentiation and tissue mineralization, but also shows a possible relationship with the circadian rhythm of dental hard tissue formation.

Keywords: ectomesenchymal stem cells; knockout mice; mineralization; p75 neurotrophin receptor; tooth.


Conflict of interest statement

All authors declare that they have no competing interests.

Figures

Figure 1
Figure 1
Generation and genotyping of p75NTR‐knockout mice. Heterozygous female and male (A) were mated to generate the three types of littermates: p75NTR‐knockout, wild type and heterozygous (B). The littermates with bands detected at both 280 bp and 345 bp were identified as heterozygous mice, and those with one band detected at 280 bp or 345 bp only were identified as p75NTRExIII−/−‐knockout or wild‐type (p75NTR+/+) mice, respectively (C). Abbreviations: H, heterozygous; K, knockout; W, wild type
Figure 2
Figure 2
Results of calcein fluorescence assay. Fluorescence microscopic observation showed that the distance between the calcein fluorescence bands in p75NTR‐knockout mice was distinctly shorter than that in wild‐type and heterozygous mice (A).The distance of every fifth day in p75NTR‐knockout mice was 20.84 μm, which was significantly lower than that of 28.72 μm in wild‐type and 31.60 μm in heterozygous mice (P < .01) (B). No significance was found between wild‐type and heterozygous mice (P > .05). Scale bar represents 50 μm. Abbreviations: H, heterozygous; K, knockout; W, wild type
Figure 3
Figure 3
Micro‐computed tomography observation and structural parameter quantification. The size and thickness of cortical bone, as well the size and density of trabecular bone in p75NTR‐knockout mice were significantly smaller than those in wild‐type mice (A). Quantification of the structural parameters (B) showed that BV, BV/TV, Tb.N, Tb.Th, Ct.BV and Ct.Th were significantly lower in the p75NTR‐knockout mice compared with those in wild‐type mice (P < .05), and conversely, BS/BV, Ct.BS/BV and Tb.Sp were significantly higher (P < .05). Abbreviations: K, knockout; W, wild type
Figure 4
Figure 4
Isolation and genotypic identification of mouse embryonic EMSCs. E13.5 heterozygous mice were selected and each embryo was separated (A, B). The embryonic maxillofacial processes were dissected and minced into fine pieces for the culture of EMSCs (C‐F). EMSCs exhibited a fibroblast‐like morphology (G, H). Genotypic identification was shown for each embryo used to isolate EMSCs (I). Scale bar represents 50 μm. Abbreviations: H, heterozygous; K, knockout; W, wild type
Figure 5
Figure 5
Characterization of p75NTR+/+ and p75NTRExIII−/− EMSCs. The MSC markers CD29, CD90 and CD146 were highly expressed in both p75NTRExIII−/− and p75NTR+/+ EMSCs, while the hematopoietic marker CD45 was hardly detected (A). Cell cycle assay showed no significant difference between p75NTR+/+ and p75NTRExIII−/− EMSCs in proliferation ability (B). Growth curves and CCK‐8 assay (C) showed that both cell populations began to grow exponentially on day 2 and the population doubling times were 29.17 h for p75NTRExIII−/− EMSCs and 28.92 h for p75NTR+/+ EMSCs, calculated by the formula PDT = T × log2/ (logNt – logN0), T: day of culture, Nt: number of cells on day T, N0: number of cells on day 0. Abbreviations: K, knockout; W, wild type
Figure 6
Figure 6
Mineralization assay. After three days of osteogenic induction, ALP staining was hardly detected in both p75NTR+/+ and p75NTRExIII−/− EMSCs (A), but on day 7, more abundant and deeper ALP staining was present in p75NTR+/+ EMSCs compared with that in p75NTRExIII−/− EMSCs. On day 14, this difference became more prominent in not only ALP but also alizarin red staining. ALP staining was deeper and the mineralized nodules of alizarin red staining were larger in p75NTR+/+ EMSCs. Western blot on day 14 showed increased expression of the mineralization‐related markers ALP, Col1, Runx2, BSP, OCN and OPN in p75NTR+/+ EMSCs (B). Similar results were obtained by RT‐PCR on day 14 (C). The mRNA expression of ALP, Col‐1, Runx2, BSP, OCN and OPN in p75NTR+/+ EMSCs was significantly higher than that in p75NTRExIII−/− EMSCs. Scale bar represents 100 μm. Abbreviations: K, knockout (p75NTRExIII−/−); W, wild type (p75NTR+/+)
Figure 7
Figure 7
Investigations revealing the potential mechanism of p75NTR in mineralization. Immunohistochemistry showed similar expression patterns for p75NTR and Mage‐D1 (A). They were strongly expressed in the same areas at the cap stage (E13.5 d), but their expression became weak at the bell stage (E15.5 d) and at the beginning of dental hard tissue formation (E18.5 d). Western blot showed that Runx2 was significantly decreased when Mage‐D1 was down‐regulated by siRNA transfection (B). The homeobox genes Dlx1 and Msx1 were both weakly expressed in p75NTRExIII−/− EMSCs but strongly expressed in p75NTR+/+ EMSCs (C). Abbreviations: K, knockout; W, wild type

References

    1. Barker PA. p75NTR is positively promiscuous: novel partners and new insights. Neuron. 2004;42:529‐533. - PubMed
    1. Nalbandian A, Pang AL, Rennert OM, Chan WY, Ravindranath N, Djakiew D. A novel function of differentiation revealed by cDNA microarray profiling of p75NTR‐regulated gene expression. Differentiation. 2005;73:385‐396. - PubMed
    1. Nie X, Xing Y, Deng M, et al. Ecto‐mesenchymal stem cells from facial process: potential for muscle regeneration. Cell Biochem Biophys. 2014;70:615‐622. - PubMed
    1. Sachs BD, Baillie GS, McCall JR, et al. p75 neurotrophin receptor regulates tissue fibrosis through inhibition of plasminogen activation via a PDE4/cAMP/PKA pathway. J Cell Biol. 2007;177:1119‐1132. - PMC - PubMed
    1. Baeza‐Raja B, Li P, Le Moan N, et al. p75 neurotrophin receptor regulates glucose homeostasis and insulin sensitivity. Proc Natl Acad Sci U S A. 2012;109:5838‐5843. - PMC - PubMed

Associated data