. 2020 Jan 10:9:e50631.
doi: 10.7554/eLife.50631.

Metabolic signature in nucleus accumbens for anti-depressant-like effects of acetyl-L-carnitine

Affiliations

Metabolic signature in nucleus accumbens for anti-depressant-like effects of acetyl-L-carnitine

Antoine Cherix et al. Elife. .

Abstract

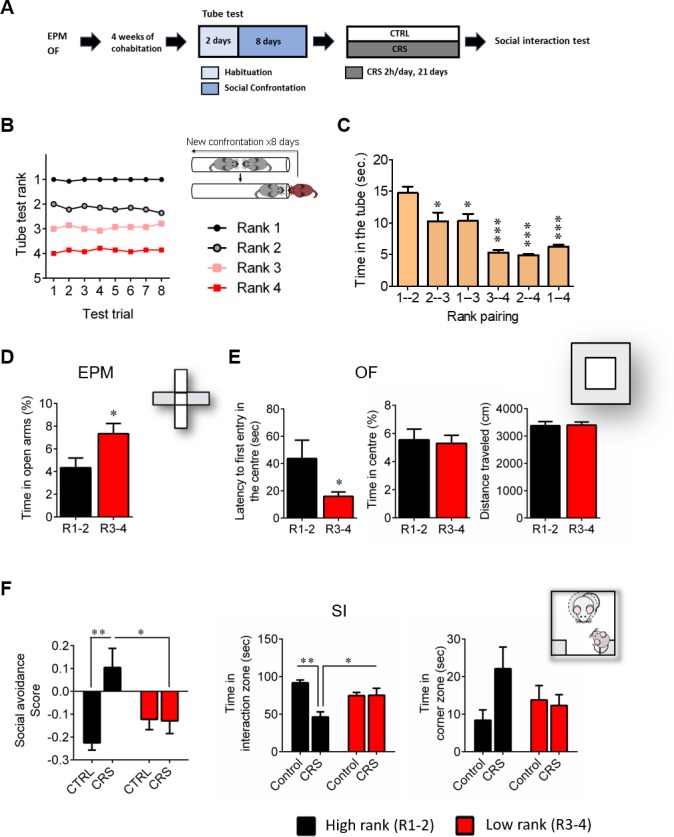
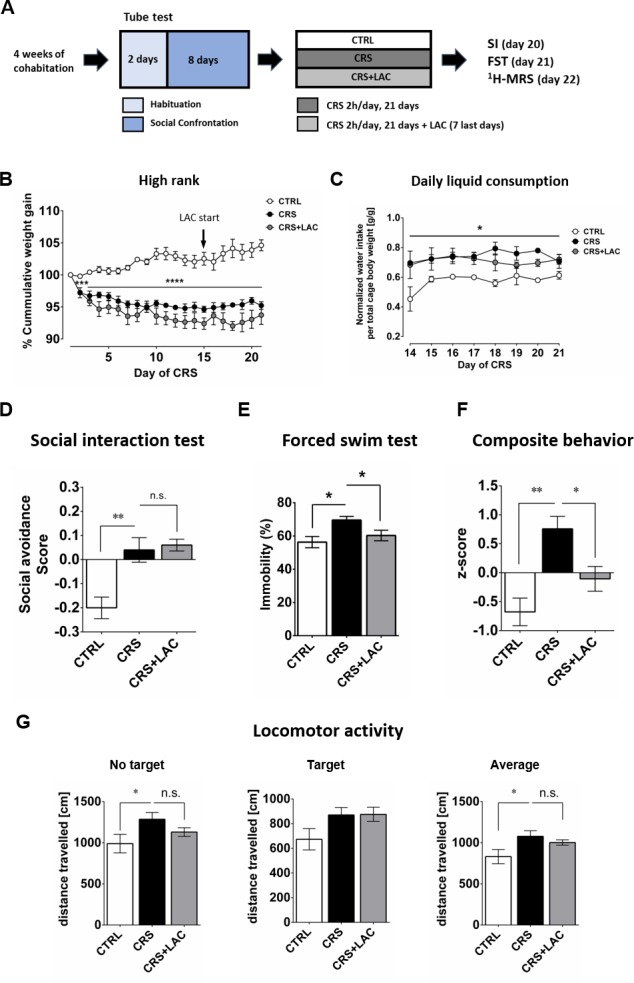
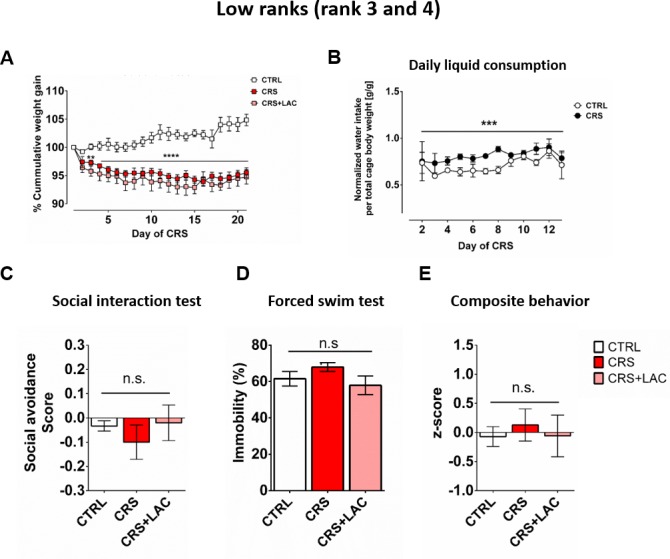
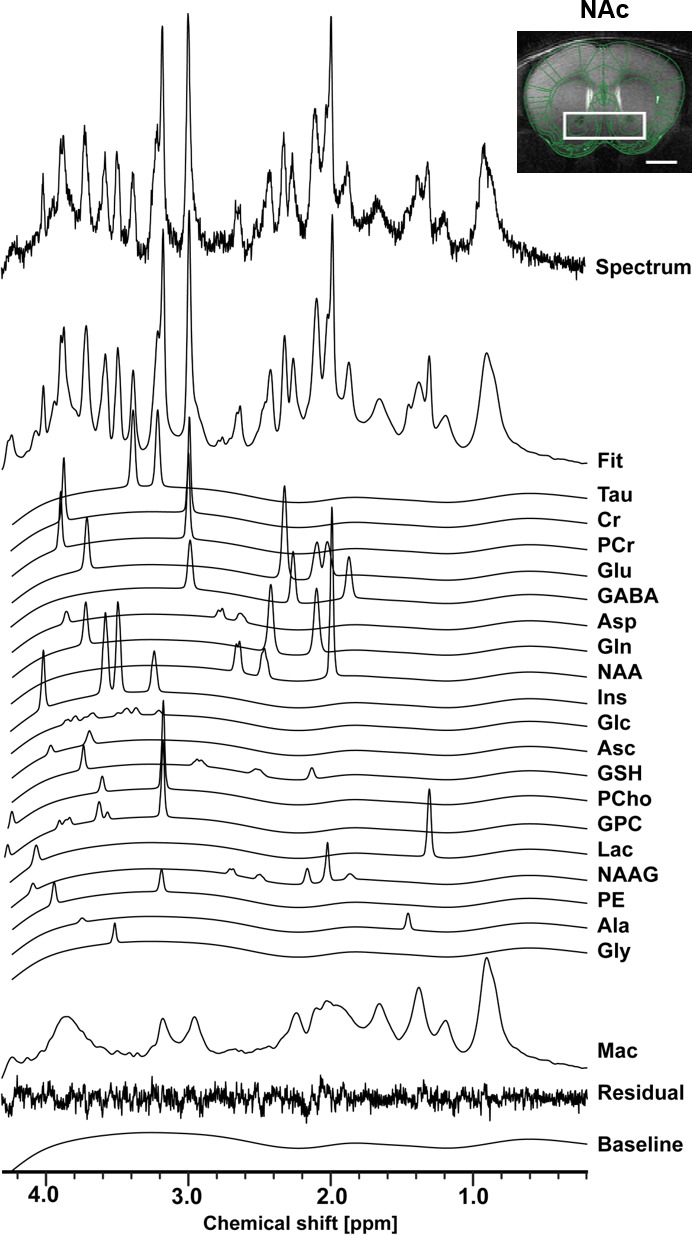
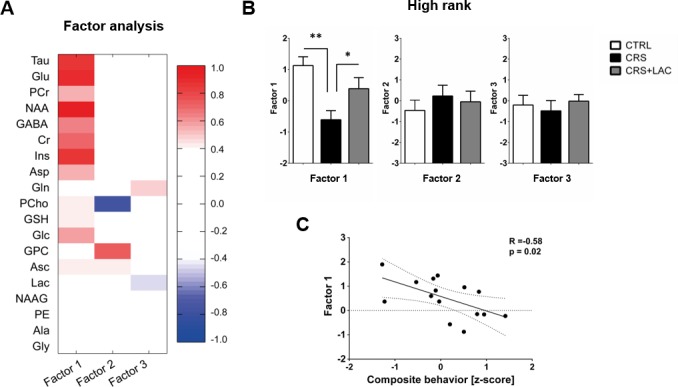
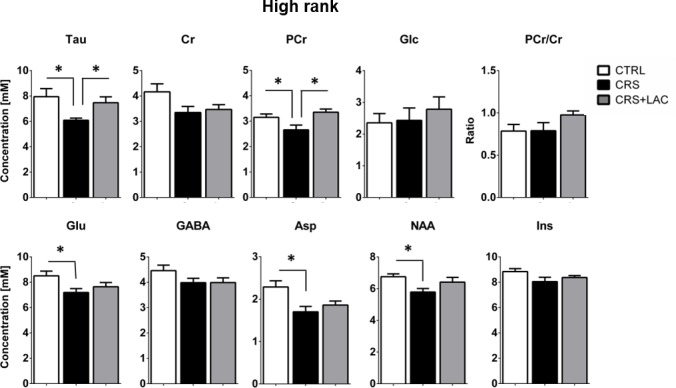
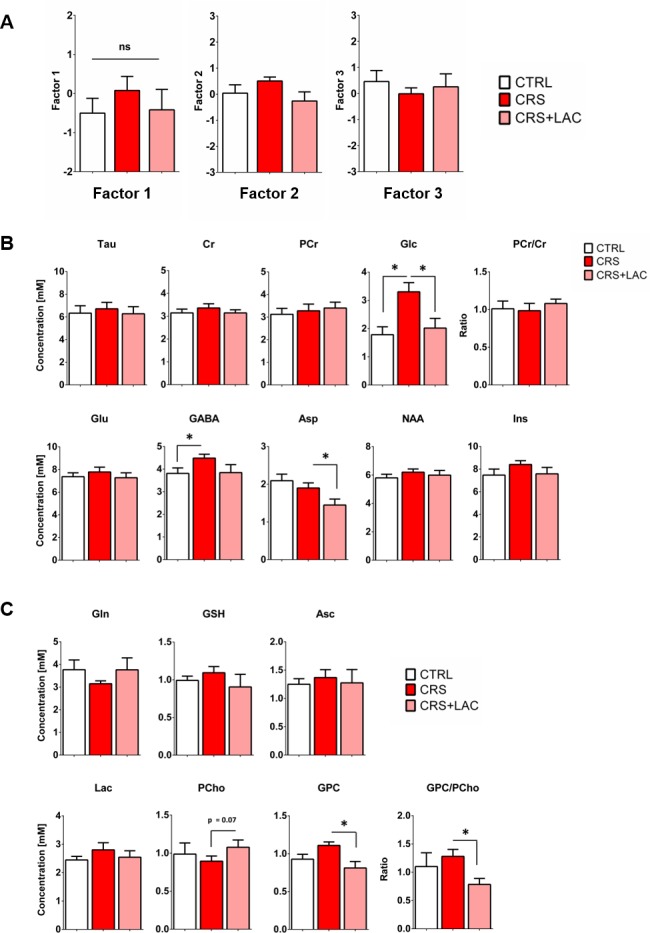
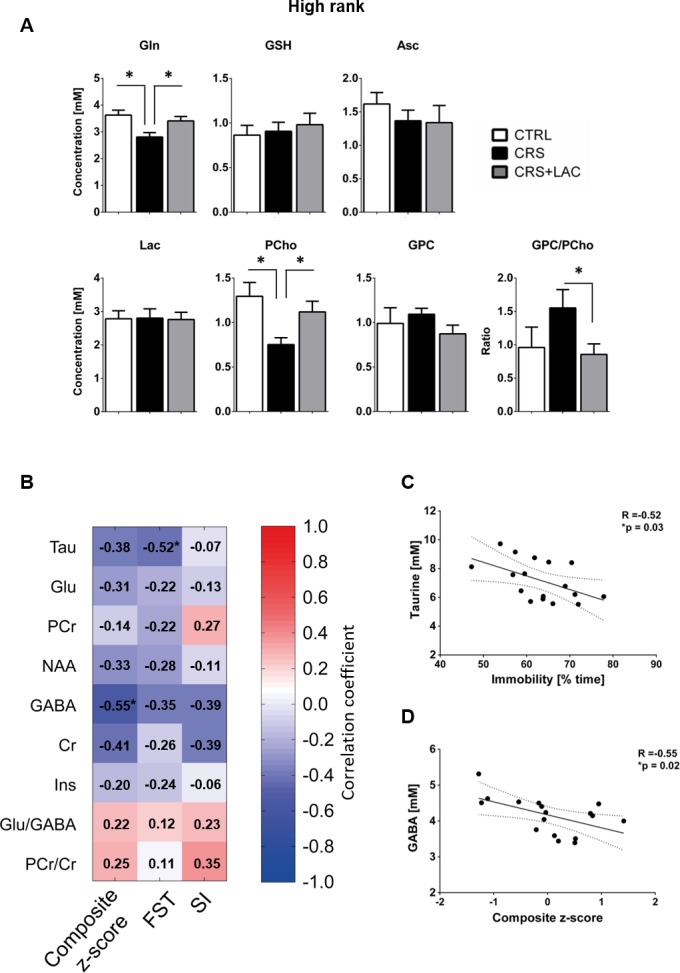
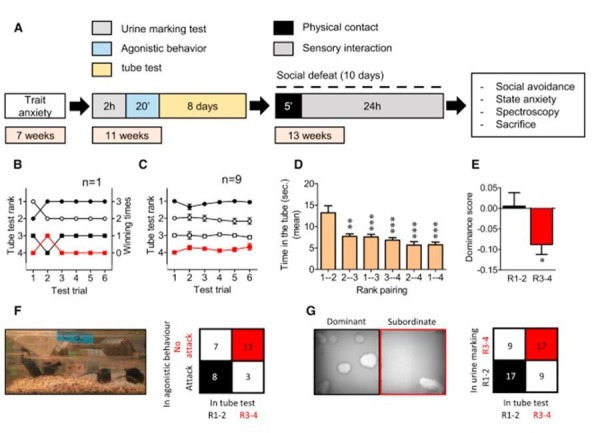
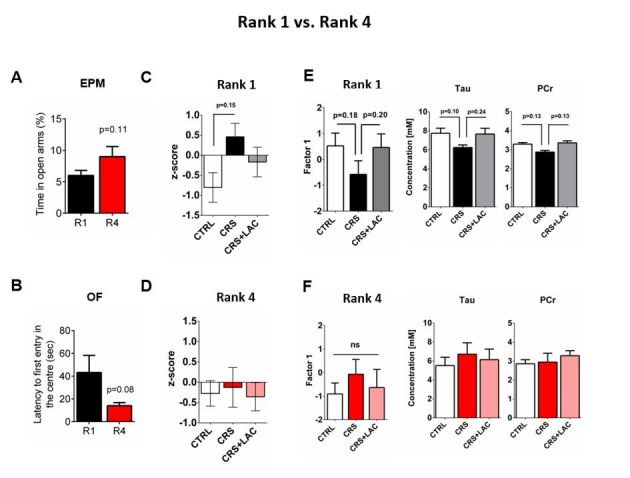
Emerging evidence suggests that hierarchical status provides vulnerability to develop stress-induced depression. Energy metabolic changes in the nucleus accumbens (NAc) were recently related to hierarchical status and vulnerability to develop depression-like behavior. Acetyl-L-carnitine (LAC), a mitochondria-boosting supplement, has shown promising antidepressant-like effects opening therapeutic opportunities for restoring energy balance in depressed patients. We investigated the metabolic impact in the NAc of antidepressant LAC treatment in chronically-stressed mice using 1H-magnetic resonance spectroscopy (1H-MRS). High rank, but not low rank, mice, as assessed with the tube test, showed behavioral vulnerability to stress, supporting a higher susceptibility of high social rank mice to develop depressive-like behaviors. High rank mice also showed reduced levels of several energy-related metabolites in the NAc that were counteracted by LAC treatment. Therefore, we reveal a metabolic signature in the NAc for antidepressant-like effects of LAC in vulnerable mice characterized by restoration of stress-induced neuroenergetics alterations and lipid function.

Keywords: 1H-MRS; acetyl-L-carnitine; brain metabolism; depression; mouse; neuroscience; nucleus accumbens; stress.


Conflict of interest statement

AC, TL, JG, JR, BM, CN, RG, CS No competing interests declared

Figures

Figure 1.
Figure 1.. High rank mice exhibit susceptible behavioral phenotype after 21 days of chronic restraint stress.
(A) Experimental design of the restraint stress protocol. (B) Summary of nine cages representing the SCTT ranks and winning times as a function of SCTT trials over the 8 days of test. (C) Time spent in tube as a function of rank pairing (F5,35=18.19, p<0.0001, one-way ANOVA; *p<0.05, ***p<0.001, Bonferroni’s test, n = 7 per rank pairing). (D) Anxiety-like behaviors measured as the percent time spent in the open arms of an elevated plus maze after segregation into high rank vs low rank mice (p*<0.05, unpaired t-test, two-tailed, n = 14 per group). (E) Anxiety-related behaviors measured in the open-field, including latency to first enter the center of the arena (*p<0.05, unpaired t-test, two-tailed n = 14 per group) and time in center zone (n.s. unpaired t-test, two-tailed n = 14 per group). Locomotor activity is measured as the distance travelled in the OF (n.s. unpaired t-test, two-tailed n = 14 per group). (F) Social interaction (SI) test measured after chronic restraint stress protocol in high rank vs low rank animals (Social avoidance score: Interaction: F1,21=7.75, p<0.05; rank effect: F1,21=1.18, p>0.05; stress effect: F1,21=7.15, p<0.05, two-way ANOVA; p*<0.05, **p<0.01, Bonferroni’s test, n = 6–7 per group/Time in interaction zone: Interaction: F1,21=12.80, p<0.005; rank effect: F1,21=0.85, p<0.05; stress effect: F1,21=12.21, p<0.005, two-way ANOVA; p*<0.05, **p<0.005, Bonferroni’s test, n = 6–7 per group/Time in corner zone: Interaction: F1,21=3.29, p>0.05; rank effect: F1,21=0.28, p<0.05; stress effect: F1,21=2.14, p>0.05, two-way ANOVA, n = 6–7 per group). Data are displayed as mean ± SEM.
Figure 2.
Figure 2.. High rank mice respond to acetyl-L-carnitine treatment after chronic restraint stress.
(A) Experimental design of the restraint stress protocol and treatment procedure. (B) High rank mice show a reduction of cumulative weight gain during the restraint stress protocol (Interaction: F20,40=11.5, p<0.0001; stress effect: F2,10 = 45.0, p<0.0001, repeated measures two-way ANOVA; ***p<0.001, ****p<0.0001, Bonferroni’s test, n = 6 per group). The start of LAC treatment during CRS protocol is indicated with an arrow (day 14). (C) Daily water intake during the LAC treatment period (given during the last week of the CRS protocol) normalized by total body weight of the four mice per cage (Group effect: F2,4=17.0, *p<0.05; Interaction: F14,28=0.90, p>0.05; time effect: F7,14=1.24, p>0.05, repeated measures two-way ANOVA; n = 3 cages per group). Thus, water intake data represent the cage average value. Liquid consumption during the first days of the CRS protocol is shown in Figure 2—figure supplement 1B (D) Social avoidance scores measured after chronic restraint stress protocol in high rank mice (F2,15=12.08, p<0.01, one-way ANOVA; **p<0.01, Bonferroni’s test, n = 6 per group). (E) Behavioral despair measured with a forced swim test between high rank mice (F2,15=5.31, p<0.05, one-way ANOVA; *p<0.05, Bonferroni’s test, n = 6 per group). (F) Depressive-like behavior measured as a composite z-score component of social avoidance and immobility time between high rank mice (F2,15=10.31, p<0.005, one-way ANOVA; *p<0.05**p<0.005, Bonferroni’s test, n = 6 per group). (G) Locomotor activity measured during the SI test (No target present: F2,15=2.94, p>0.05, one-way ANOVA; *p<0.05, Bonferroni’s test/Target present: F2,15=2.79, p>0.05, one-way ANOVA;/Average: F2,15=3.67, p<0.05, one-way ANOVA; *p<0.05, Bonferroni’s test, n = 6 per group). Effect of LAC on low rank is shown in Figure 2—figure supplement 1.
Figure 2—figure supplement 1.
Figure 2—figure supplement 1.. Physiological and behavioral readouts following CRS and LAC treatment in low rank mice.
(A) Low rank mice show a reduction of cumulative weight gain during the restraint stress protocol (Interaction: F40,20=8.17, p<0.0001; stress effect: F2,10 = 20.4, p<0.001, repeated measures two-way ANOVA; n = 6 per group). (B) Daily water intake during the first part of the CRS protocol (day 2–13) normalized by mice total body weight per cage (Group effect: F1,2=1367, p<0.001, repeated measures two-way ANOVA; n = 6 per group). This water intake represents an average value over the cage, including both high rank and low rank mice. (C–D) Depressive-like behavior of subordinate mice is not altered by LAC administration. ANOVA for the SI, FST and composite behavioral z-score for the three groups of low rank mice indicated no significant differences (SI: F2,13=0.55, n.s.; FST: F2,15=1.62, n.s.; Composite behavior: F2,15=0.16, n.s. (C) Social avoidance scores measured after chronic restraint stress protocol in low rank animals (F2,15=0.55, p>0.05, one-way ANOVA; n = 6 per group). (D) Behavioral despair measured with a forced swim test between low rank mice (F2,15=1.62, p>0.05, one-way ANOVA; n = 6 per group). (E) Depressive-like behavior measured as a composite z-score component of social avoidance and immobility time between low rank mice (F2,15=0.16, p>0.05, one-way ANOVA; n = 6 per group).
Figure 3.
Figure 3.. The neurochemical profile of the nucleus accumbens measured with in vivo 1H-MRS at 14T.
Spectrum fitting and neuroanatomical image of the NAc with respective voxel position in mouse brain. Spectrum is decomposed into the total fit, the individual metabolite components of the fit, the residual and the baseline, as a result of LCModel analysis. The fitted neurochemical profile included following metabolites: taurine (Tau), creatine (Cr), phosphocreatine (PCr), glutamate (Glu), γ-aminobutyric acid (GABA), aspartate (Asp), glutamine (Gln), N-acetyl-aspartate (NAA), myo-inositol (Ins), glucose (Glc), ascorbate (Asc), glutathione (GSH), phosphorylcholine (PCho), glycerophosphorylcholine (GPC), lactate (Lac), N-acetylaspartyl-glutamate (NAAG), phosphoethanolamine (PE), alanine (Ala), glycine (Gly), as well as macromolecules (Mac).
Figure 4.
Figure 4.. Factor analysis identified one main factor that accounts for treatment-related effects in the metabolic profile of nucleus accumbens in high rank mice.
(A) Metabolites in the nucleus accumbens that load into Factor one, Factor two and Factor three of the factor analysis. The heat map represents the individual loadings of each metabolite into each factor. Factor one represents a linear combination that summarizes neurochemical changes including metabolites with strong contribution (above 0.5: Tau, Cr, PCr, Glc, Glu, GABA, Asp, NAA and Ins.) and moderate (0.4–0.5: GSH and Asc). (B) CRS and LAC treatment in CRS-treated high rank mice impact on Factor one metabolites (F2,13=7.04, p<0.01, one-way ANOVA; *p<0.05, **p<0.01, Fisher LSD test n = 5–6 per group) (C) Factor one correlates with the composite emotional (i.e., depressive-like) behavior in high rank animals (R = −0.58; p<0.05).
Figure 5.
Figure 5.. Effect of CRS and LAC treatment in CRS-treated mice on the accumbal neurochemical profile of high rank mice for metabolites with strong loading on Factor one.
Metabolites from Factor one with strong loading (above 0.5) include Tau, Cr, PCr, Glc, Glu, GABA, Asp, NAA and Ins. The ratio of PCr/Cr is shown as well. CRS induces a drop in Tau, Glu, PCr, Asp and NAA. Only CRS-induced reductions in Tau and PCr are restored by LAC treatment. The neurochemical profile obtained for low rank mice is reported in Figure 5—figure supplement 1. One-way ANOVA followed by LSD Fisher post-hoc test, *p<0.05, n = 5–6 per group.
Figure 5—figure supplement 1.
Figure 5—figure supplement 1.. Effect of LAC on the accumbal neurochemical profile of low rank mice after CRS.
(A) Factor analysis of the metabolic profile of nucleus accumbens of low rank mice after CRS. Factor one represents a linear combination that summarizes neurochemical changes including metabolites with strong (above 0.5: Tau, Cr, PCr, Glc, Glu, GABA, Asp, NAA and Ins.) and moderate (0.4–0.5: GSH and Asc) contribution in low rank mice (F2,15=0.54, p>0.05, one-way ANOVA; Fisher LSD test n = 6 per group). (B) Metabolites from Factor one with strong loading (above 0.5) Tau, Cr, PCr, Glc, Glu, GABA, Asp, NAA and Ins. The ratio of PCr/Cr is shown as well. One-way ANOVA followed by LSD Fisher post-hoc test, n = 5–6 per group. (C) Metabolites with moderate loadings (0.4–0.5) from Factor one and remaining metabolites from Factors two and three included Gln, GSH, Asc, PCho, Lac and GPC. The ratio of GPC/PCho was also reduced upon treatment. One-way ANOVA followed by LSD Fisher post-hoc test, *p<0.05, n = 5–6 per group. Overall, metabolite levels in low rank mice did not show substantial changes, except for Glc that was increased by CRS (p<0.05) and normalized by LAC treatment (p<0.05).
Figure 6.
Figure 6.. Effect of LAC on the accumbal neurochemical profile of high rank mice after CRS for remaining metabolites and associations between behavior and neurochemistry.
(A) Metabolites with moderate loadings (0.4–0.5) from Factor one and remaining metabolites from Factors two and three included Gln, GSH, Asc, Lac, PCho and GPC. The ratio of GPC/PCho is also shown. CRS induces a drop in Gln and PCho, which are both restored after LAC treatment. The GPC/PCho ratio is also lowered after LAC administration. One-way ANOVA followed by LSD Fisher post-hoc test, *p<0.05, n = 5–6 per group. (B) Correlation matrix between behavioral components and main metabolic targets of stress in the nucleus accumbens. Behavior included social interaction (SI) test, forced swim test (FST) and a composite behavior including both behaviors (Composite z-score). Each cell includes the Pearson’s correlation coefficient with the associated color scaling. (C) Scatter plot of behavioral despair and accumbal taurine. (D) Scatter plot of depressive-like behavior and accumbal GABA. *p<0.05, n = 16–18 per group.
Author response image 1.
Author response image 1.. Hierarchical Rank Using a Social Confrontation Tube Test.
(A) Illustration of the general timeline of the study. (B) Example of one cage representing the tube test ranks and winning times as a function of tube test trials. (C) Summary for nine cages over the 6-day test trials. (D) Time spent in the tube (s) as a function of the rank pairing (F5,48 = 9.78, p < 0.001, one-way ANOVA; ∗∗p < 0.01, ∗∗∗p < 0.001, Bonferroni’s test, n = 9 per rank pairing). (E) Dominance score after agonistic behaviors in the homecage (t28 = 2.30, ∗p < 0.05, unpaired t test, two-tailed n = 15 per group). (F) 2 × 2 contingency table for correlation between agonistic behaviors and tube test ranks (Fisher’s exact test, two-tailed, p = 0.050). (G) Left: picture representing typical urine marks profile of dominant and subordinate mice revealed by a UV light source. Right: 2 × 2 contingency table for correlation between urine marking test and tube test ranks (Fisher’s exact test, two-tailed, p = 0.026, n = 26 pairs). From Larrieu et al., 2017, Curr Biol..
Author response image 2.
Author response image 2.. Behavioral and metabolic comparisons between Rank 1 vs Rank 4.
(A) Comparison of trait-anxiety parameters measured with an elevated plus maze when only the highest rank (R1) and lowest rank (R4) are compared. Student’s t-test, n=6-7 per group. (B) Comparison of trait-anxiety parameters measured with an open field when only the highest rank (R1) and lowest rank (R4) are compared. Student’s t-test, n=3 per group. (C) Depressive-like behavior measured as a composite z-score component of social avoidance and immobility time in animals of Rank 1 (F2,6=2.95, P>.05, one-way ANOVA; n=3 per group). (D) Depressive-like behavior measured as a composite z-score component of social avoidance and immobility time in animals of Rank 4 (F2,6=0.07, P>.05, one-way ANOVA; n=3 per group). (E) Accumbal neurochemistry in Rank 1 mice. One-way ANOVA, Bonferroni’s test, n=3 per group. (F) Accumbal neurochemistry in Rank 4 mice. One-way ANOVA, Bonferroni’s test, n=3 per group.

References

    1. Andreazza AC, Nierenberg AA. Mitochondrial dysfunction: at the core of psychiatric disorders? Biological Psychiatry. 2018;83:718–719. doi: 10.1016/j.biopsych.2018.03.004. - DOI - PubMed
    1. Atif F, Yousuf S, Agrawal SK. Restraint stress-induced oxidative damage and its amelioration with selenium. European Journal of Pharmacology. 2008;600:59–63. doi: 10.1016/j.ejphar.2008.09.029. - DOI - PubMed
    1. Aureli T, Miccheli A, Ricciolini R, Di Cocco ME, Ramacci MT, Angelucci L, Ghirardi O, Conti F. Aging brain: effect of acetyl-L-carnitine treatment on rat brain energy and phospholipid metabolism. A study by 31P and 1H NMR spectroscopy. Brain Research. 1990;526:108–112. doi: 10.1016/0006-8993(90)90255-A. - DOI - PubMed
    1. Aureli T, Miccheli A, Di Cocco ME, Ghirardi O, Giuliani A, Ramacci MT, Conti F. Effect of acetyl-L-carnitine on recovery of brain phosphorus metabolites and lactic acid level during reperfusion after cerebral ischemia in the rat--study by 13P- and 1H-NMR spectroscopy. Brain Research. 1994;643:92–99. doi: 10.1016/0006-8993(94)90013-2. - DOI - PubMed
    1. Bak LK, Schousboe A, Waagepetersen HS. The glutamate/GABA-glutamine cycle: aspects of transport, neurotransmitter homeostasis and Ammonia transfer. Journal of Neurochemistry. 2006;98:641–653. doi: 10.1111/j.1471-4159.2006.03913.x. - DOI - PubMed

Publication types