. 2020 Jan 10:9:e50973.
doi: 10.7554/eLife.50973.

Two forms of Opa1 cooperate to complete fusion of the mitochondrial inner-membrane

Affiliations

Two forms of Opa1 cooperate to complete fusion of the mitochondrial inner-membrane

Yifan Ge et al. Elife. .

Abstract

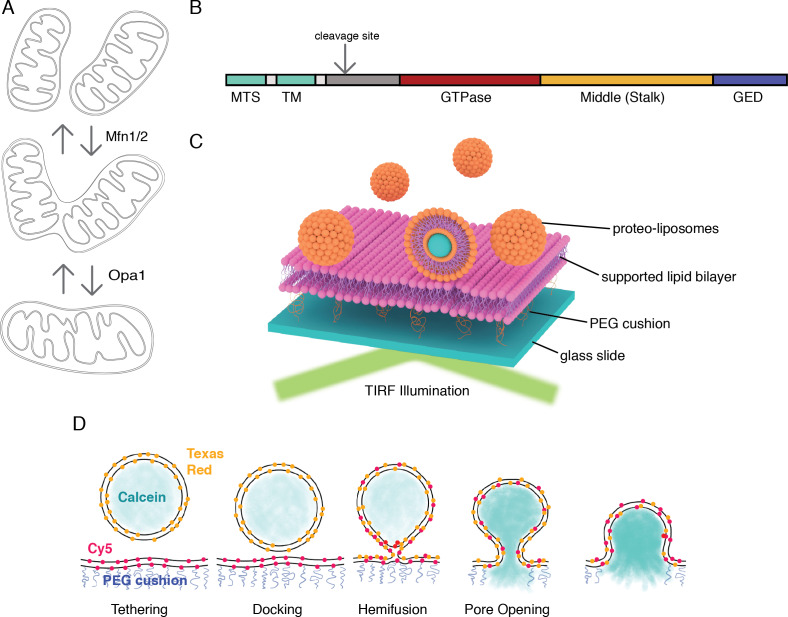
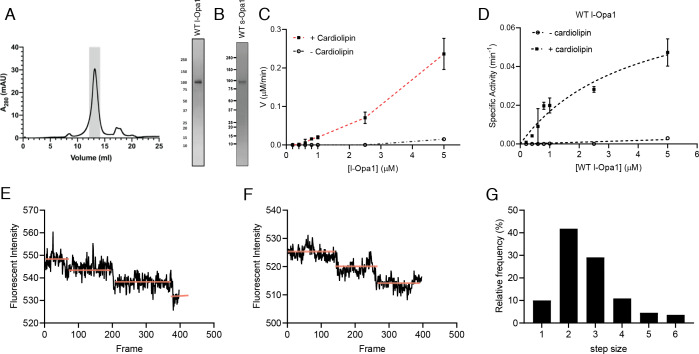
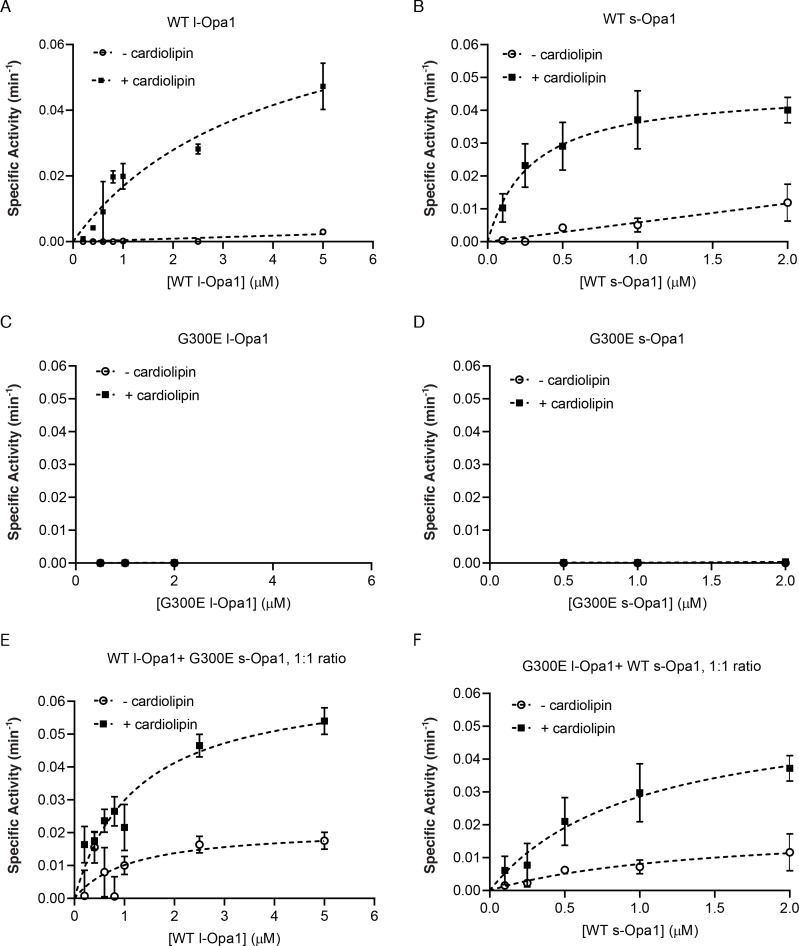
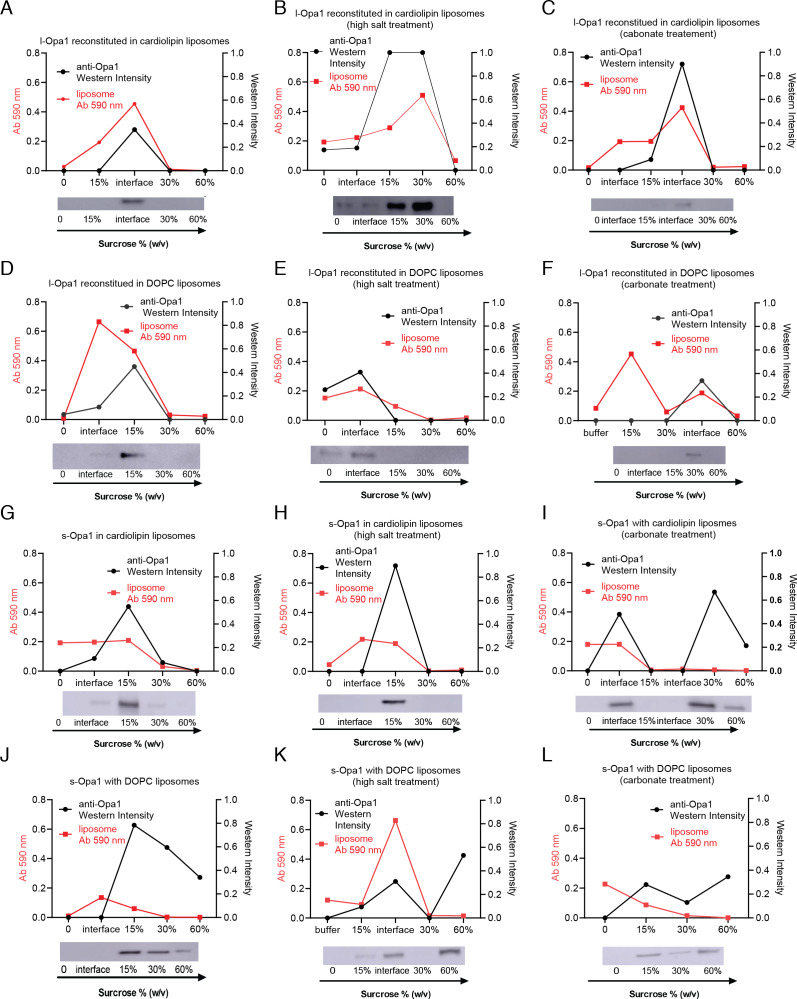
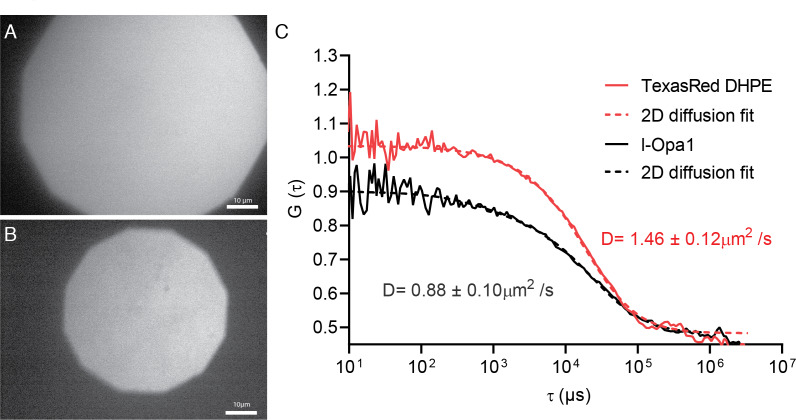
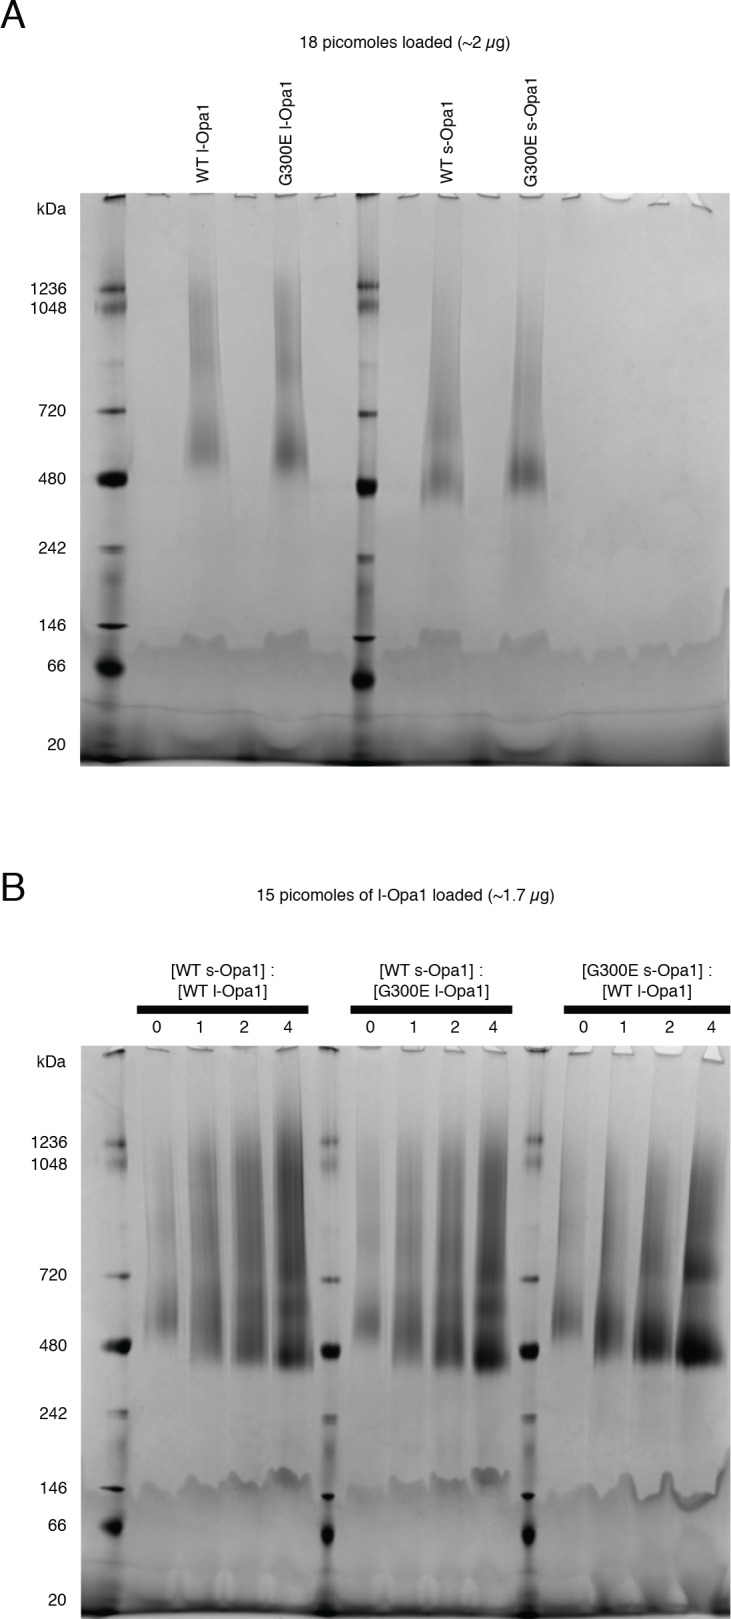
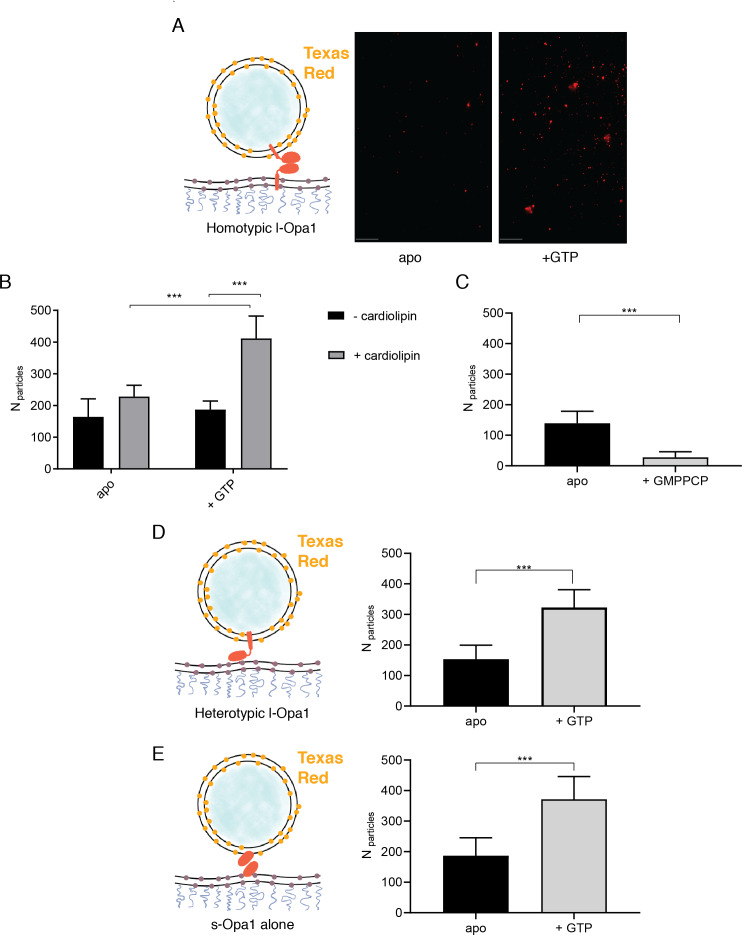
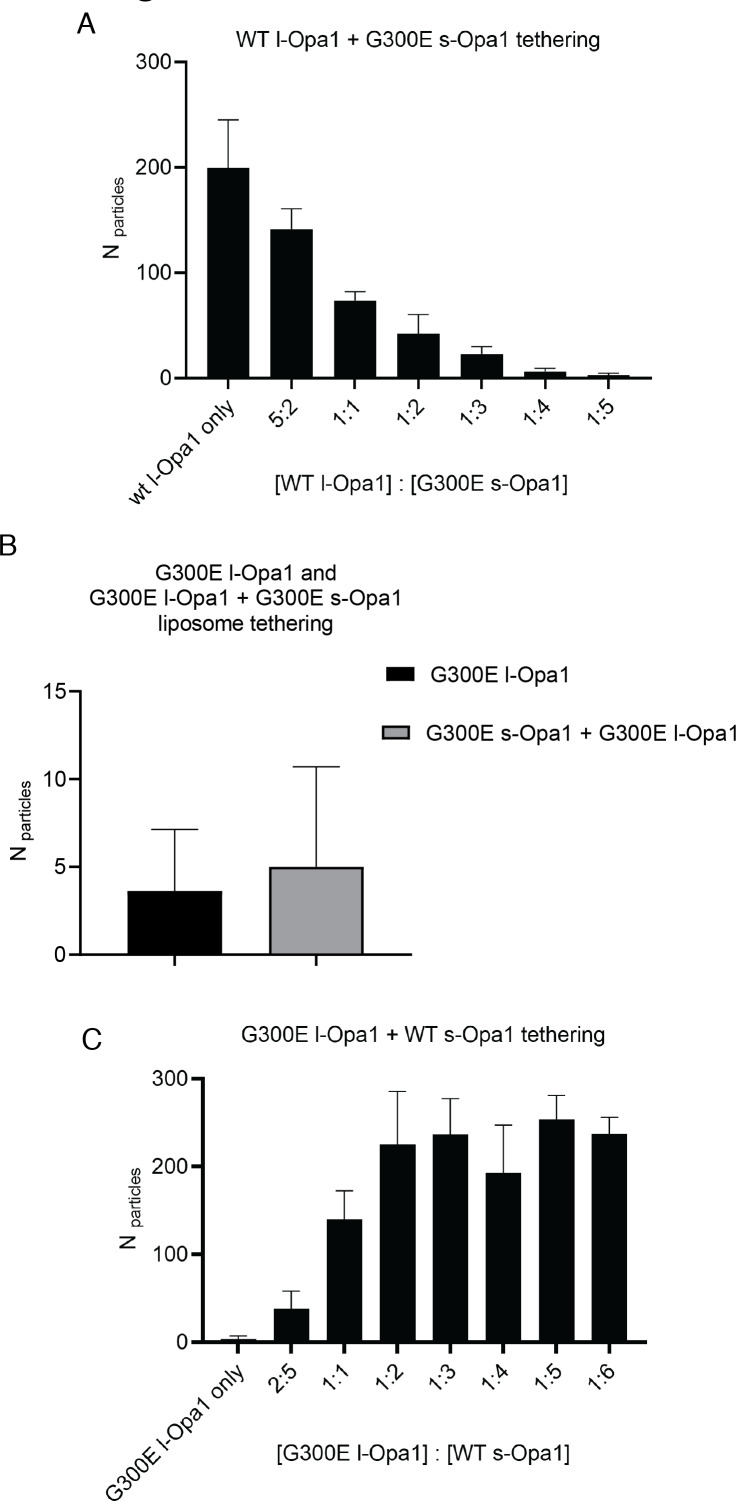
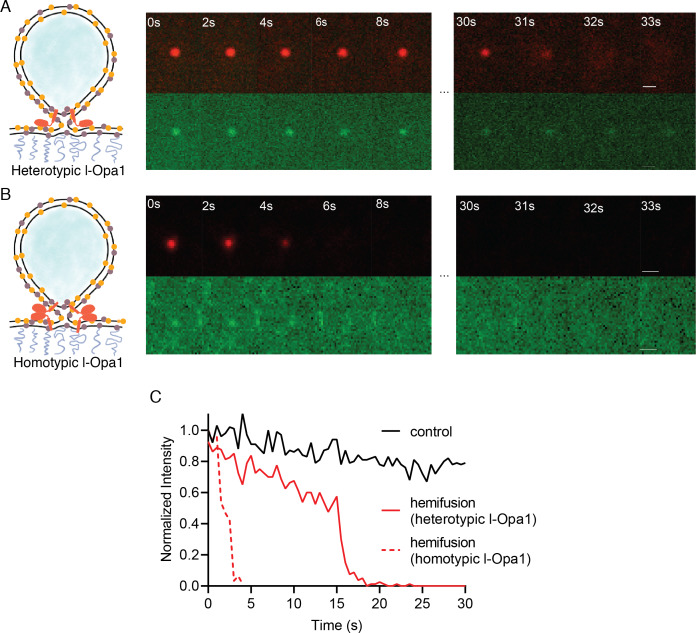
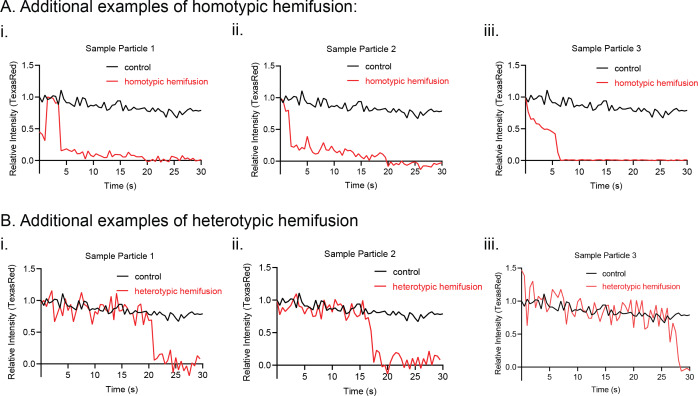
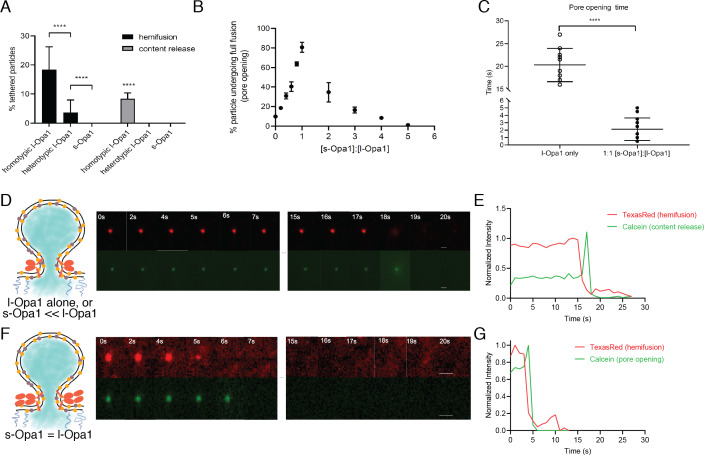
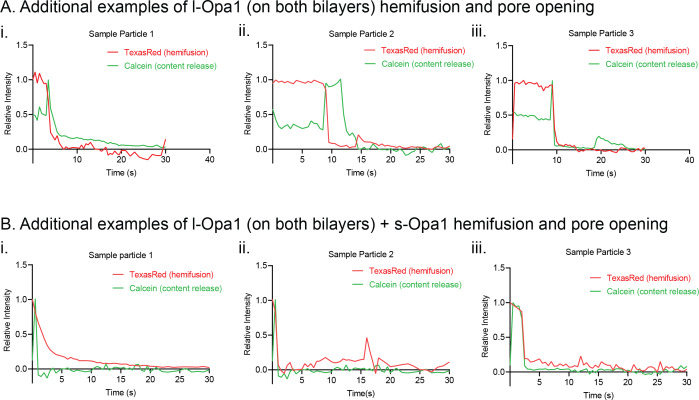
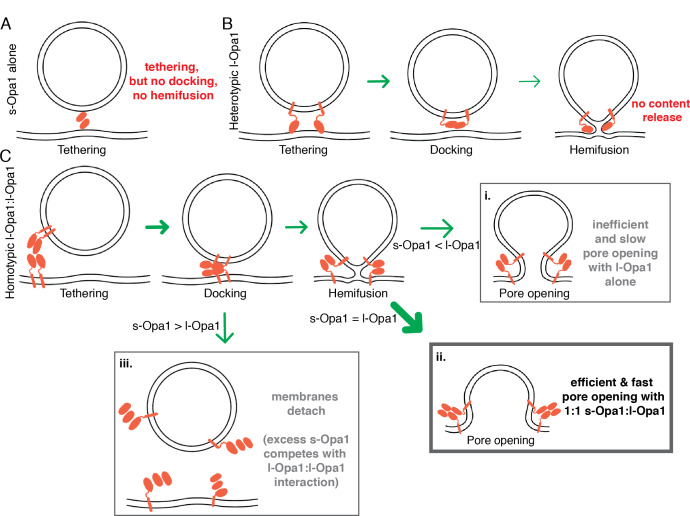
Mitochondrial membrane dynamics is a cellular rheostat that relates metabolic function and organelle morphology. Using an in vitro reconstitution system, we describe a mechanism for how mitochondrial inner-membrane fusion is regulated by the ratio of two forms of Opa1. We found that the long-form of Opa1 (l-Opa1) is sufficient for membrane docking, hemifusion and low levels of content release. However, stoichiometric levels of the processed, short form of Opa1 (s-Opa1) work together with l-Opa1 to mediate efficient and fast membrane pore opening. Additionally, we found that excess levels of s-Opa1 inhibit fusion activity, as seen under conditions of altered proteostasis. These observations describe a mechanism for gating membrane fusion.

Keywords: fusion; in vitro reconstitution; membranes; mitochondria; molecular biophysics; none; structural biology.


Conflict of interest statement

YG, XS, SB, JM, AS, LC No competing interests declared

Figures

Figure 1.
Figure 1.. An in vitro assay for mitochondrial inner-membrane fusion.
(A) Mitochondrial membrane fusion involves sequential outer and inner membrane fusion. The mitofusins (Mfn1/2) catalyze outer membrane fusion. In metazoans, mitochondrial inner-membrane fusion is mediated by Opa1. (B) Linear domain arrangement of l-Opa1. (C) Schema of the experimental setup. (D) Fusion assay. Membrane tethering, docking, lipid mixing, and content release can be distinguished using fluorescent reporters that specifically reflect each transition of the reaction.
Figure 2.
Figure 2.. Reconstitution of l-Opa1.
(A) Representative size-exclusion chromatograph and SDS-PAGE gel of human l-Opa1 purified from P. pastoris. (B) SDS-PAGE gel of human s-Opa1 purified from P. pastoris. l-Opa1 activity, with velocity (C) and specific activity (D) of GTP hydrolysis in the presence and absence of cardiolipin, while varying protein concentration of Opa1. Data are shown as mean ± SD, with error bars from three independent experiments. Representative single-liposome photobleaching steps (E and F) and histogram of step sizes (distribution for 110 liposomes shown) (G).
Figure 2—figure supplement 1.
Figure 2—figure supplement 1.. GTP hydrolysis activity.
GTP hydrolysis (GTPase) activity of l-Opa1 (A) and s-Opa1 (B) in the presence and absence of cardiolipin. Both G300E l-Opa1 and G300E s-Opa1 do not show any GTPase activity (C and D). Mixing G300E s-Opa1 with WT l-Opa1 at 1:1 molar ratio (E) does not alter the GTPase activity of, detergent solubilized, WT l-Opa1 significantly (E and A, p>0.2, t-test). A similar effect is seen upon addition of G300E l-Opa1 to WT s-Opa1 at 1:1 ratio (F). Under these conditions, s-Opa1 GTPase activity is similar to s-Opa1 alone (F and B, p>0.2, t-test). Data shown as mean ± SD, error bars from three experiments.
Figure 2—figure supplement 2.
Figure 2—figure supplement 2.. Liposome co-flotation.
Liposome co-flotation analysis: Reconstituted l-Opa1 co-floats with liposomes both with and without cardiolipin (A and D). Liposomes were labeled with 0.2% (mol) TexasRed-DHPE, and their distribution was confirmed by liposome dye absorbance at 590 nm. Opa1 distribution was analyzed by western blot. Opa1/liposome fractions was mostly found near 15 ~ 30% sucrose. This reconstitution is stable under high salt (B and E) or carbonate conditions (C and F). s-Opa1 interacts with liposomes in a cardiolipin-dependent manner (G-L). This interaction is resistant to high salt (H) but sensitive to carbonate treatment (I), where the protein was found in the bottom fractions lacking liposome (60% sucrose). s-Opa1 does not associate with DOPC liposomes (J-L). These results indicate that l-Opa1 was successfully reconstituted through integral transmembrane region, whereas the s-Opa1 bilayer-association is through a cardiolipin:s-Opa1 peripheral membrane interaction.
Figure 2—figure supplement 3.
Figure 2—figure supplement 3.. Bilayer homogeneity and FCS.
Epifluorescence image of polymer-tethered lipid bilayers before (A) and after Opa1 reconstitution (B), showing a homogeneous lipid bilayer. Scale bar: 10 µm. FCS profiles of TexasRed-PE and TexasRed labeled anti-Opa1 antibody show slower diffusion for reconstituted l-Opa1 (C), indicating successful reconstitution, and that the reconstituted l-Opa1 diffuses freely.
Figure 2—figure supplement 4.
Figure 2—figure supplement 4.. Blue native gels.
(A) Blue native (BN-PAGE) gels show WT l-Opa1 and s-Opa1 can self-assemble as oligomers in DDM. (B) Mixtures of WT l-Opa1 and WT s-Opa1 show a range of species from ~480 KDa - ~ 1 MDa. G300E l-Opa1, in the presence of WT s-Opa1, does not alter this gel migration pattern. In contrast, complexes comprising WT l-Opa1 and G300E s-Opa1 show a slight shift to a population mainly containing a ~ 480 Kda and 720 KDa species.
Figure 2—figure supplement 5.
Figure 2—figure supplement 5.. FCS.
Fluorescence autocorrelation profiles of TexasRed labeled anti-His antibody in the presence of unlabeled liposomes (A), and TexasRed-PE-labeled liposomes (B), showing diffusion coefficients of unbound antibody versus liposomes. FCS profile of reconstituted l-Opa1 (detected with a TexasRed labeled antibody) (C) is similar to that of dye-labeled liposomes (B), indicating successful reconstitution of Opa1.
Figure 3.
Figure 3.. The number of liposomes tethered on the planar bilayers in a homotypic format (l-Opa1 on both bilayers) increases in the presence of GTP, when both bilayers contain cardiolipin.
(A) Representative images of liposomes tethered on lipid bilayer (both containing cardiolipin) before (apo, or nucleotide free) and after GTP addition. Scale bar: 5 µm. (B) Bar graph: In the presence of cardiolipin, addition of GTP doubles the number of liposomes. (***p<0.001, two way ANOVA). (C) Addition of GMPPCP decreases amount of tethered l-Opa1 liposomes (apo, indicating nucleotide free) (p<0.005, two-way ANOVA). (D) l-Opa1 in the liposome bilayer alone is sufficient to tether liposomes to a cardiolipin containing bilayer. Tethering is enhanced in the presence of GTP (apo, indicating nucleotide free) (p<0.005, two-way ANOVA). (E) s-Opa1 tethers liposomes to a cardiolipin-containing bilayer. Number of tethered liposomes when both bilayer and liposomes contain 20% (mol) cardiolipin. Before addition of GTP (apo, indicating nucleotide-free), a moderate amount of liposome tethering was observed. The addition of GTP enhances this tethering effect (p<0.005, two-way ANOVA). Data are shown as mean ± SD. Error bars are from five independent experiments (>10 images across one bilayer per for each experiment).
Figure 3—figure supplement 1.
Figure 3—figure supplement 1.. Effect of s-Opa1 competition on membrane tethering.
Addition of G300E s-Opa1 detaches the l-Opa1 proteoliposomes tethered to l-Opa1-containing supported lipid (A). G300E l-Opa1 does not tether liposomes to a supported bilayer (B). G300E l-Opa1 in the presence of G300E s-Opa1 also does not tether membranes. Addition of WT s-Opa1 to G300E l-Opa1 proteoliposomes and a l-Opa1-containing supported lipid tethers liposomes (A).
Figure 3—figure supplement 2.
Figure 3—figure supplement 2.. Normalized relative and cumulative size distributions show cardiolipin containing proteoliposomes shift to larger sizes 1 hr following GTP addition (green trace), as measured by Nanosight light scattering.
Figure 4.
Figure 4.. Docking.
(A) Homotypic l-Opa1 docks liposomes in a GTP-hydrolysis dependent manner. s-Opa1, alone is insufficient to closely dock liposomes. l-Opa1 in a heterotypic format (on the liposome alone) is competent to closely dock to a bilayer, but this docking is not stimulated by nucleotide. Bar graphs shown as mean ± SD (p<0.0001, one-way ANOVA). Error bars are from 3 to 5 independent experiments (each experiment with >150 particles in a given bilayer). (B) In the presence of cardiolipin on both bilayers, FRET signal reports on close liposome docking mediated by l-Opa1. Left: Green = Cy5 emission signal upon excitation at 543 (TexasRed excitation). Red = Cy5 emission signal in membrane upon excitation at 633 (Cy5 excitation). Right: Green = TexasRed emission upon excitation at 543 nm (TexasRed excitation). Scale bar: 5 µm.
Figure 4—figure supplement 1.
Figure 4—figure supplement 1.. Docking.
(A) Controls for intra-membrane and inter-membrane FRET: When both TexasRed and Cy5 PE are present in the same bilayer, high FRET efficiency is observed. When TexasRed and Cy5 PE are present in two different bilayers, with a ~ 7 nm tethering distance (from bilayer center to bilayer center in the double bilayer stack), FRET efficiency was low (data analyzed from 10 random spots in two bilayers (p<0.0001, t test). Analysis of ~20 particles shows ~40% FRET efficiency for both homotypic and heterotypic tethering. This indicates that l-Opa1 is able to bring the two membranes within close proximity (<7 nm) without mixing the two membranes. (B) Quantification of DOPC liposomes tethered to a DOPC bilayer containing reconstituted l-Opa1. Liposomes do not tether to the supported bilayer, indicating that in the absence of cardiolipin, l-Opa1 does not tether liposomes alone. The lack of liposome docking to exposed regions also argues that few defects were introduced into the bilayer following reconstitution. Data from three different bilayers.
Figure 5.
Figure 5.. Hemifusion.
(A) Heterotypic hemifusion. Top panels: time trace of proteo-liposome lipid dye diffusion (TexasRed). Bottom panels: no content release is observed for this particle (calcein signal remains quenched). Scale bar: 1 µm. (B) Homotypic hemifusion. Top panels: time trace of liposome lipid dye diffusion (TexasRed). Bottom panels: no content release is observed for this particle (calcein signal remains quenched). Scale bar: 1 µm. (C) Representative intensity traces of a control particle not undergoing fusion (black), with heterotypic hemifusion event (solid red), and homotypic hemifusion event (dotted red).
Figure 5—figure supplement 1.
Figure 5—figure supplement 1.. Additional kinetic traces for hemifusion curves under homotypic (A) and heterotypic (B) Opa1 hemifusion conditions.
Control particle trace shown in black. Hemifusion trace shown in red.
Figure 6.
Figure 6.. Hemifusion and full fusion.
(A) Hemifusion (lipid mixing) and full fusion (content release and pore opening) efficiency for homotypic l-Opa1, heterotypic l-Opa1 and s-Opa1 (p<0.001, two-way ANOVA). Bar graphs shown as mean ± SD. Error bars are from five different experiments (50–200 particles were analyzed per bilayer in each experiment). B. Full fusion (pore opening) efficiency at different s-Opa1:l-Opa1 ratios. Data are shown as mean ± SD. Error bars are from 4 to 6 experiments (80–150 particles per bilayer in each experiment). The significance of the data was confirmed using one-way ANOVA (Prism 8.3) where p<0.0001. C. Mean pore opening time in the absence of s-Opa1 and at equimolar s-Opa1. Significance of the difference was confirmed using t-test (Prism 8.3, p<0.0001). D. Representative hemifusion and pore opening fluorescence time series for homotypic l-Opa1 experiment, in the absence of s-Opa1, top and bottom panels, respectively. Scale bar: 1 µm. E: representative traces of TexasRed (liposome signal) and calcein (content signal) intensity for homotypic l-Opa1 experiment. F. Representative hemifusion and pore opening fluorescence traces for a homotypic l-Opa1 experiment in the presence of equimolar s-Opa1. Scale bar: 1 µm. G: Representative trace of TexasRed (liposome signal) and calcein (content signal) intensity for a homotypic l-Opa1 experiment in the presence of equimolar s-Opa1.
Figure 6—figure supplement 1.
Figure 6—figure supplement 1.. Additional kinetic traces for hemifusion and pore opening under homotypic l-Opa1 conditions (A), homotypic l-Opa1, and l-Opa1 + s-Opa1 (1:1) (B) conditions.
Hemifusion (TexasRed) trace show in red. Pore opening (calcein, content release) trace shown in green.
Figure 7.
Figure 7.. Summary model for modes of regulation in Opal-mediated membrane fusion.
(A) s-Opa1 alone is capable of tethering bilayers, but insufficient for close membrane docking and hemifusion. (B) l-Opa1, in a heterotypic arrangement, can tether bilayers, and upon GTP stimulation promote low levels of lipid mixing, but no full fusion, pore opening or content release. (C) Homotypic l-Opa1-l-Opa1 tethered bilayers can mediate full content release (i). This activity is greatly stimulated by the presence of s-Opa1, with peak activity at 1:1 s-Opa1:l-Opa1 (ii). Excess levels of s-Opa1 suppress fusion, likely through competing with the l-Opa1-l-Opa1 homotypic tethering interface (iii).

References

    1. Abutbul-Ionita I, Rujiviphat J, Nir I, McQuibban GA, Danino D. Membrane tethering and Nucleotide-dependent conformational changes drive mitochondrial genome maintenance (Mgm1) Protein-mediated membrane fusion. Journal of Biological Chemistry. 2012;287:36634–36638. doi: 10.1074/jbc.C112.406769. - DOI - PMC - PubMed
    1. Alexander C, Votruba M, Pesch UE, Thiselton DL, Mayer S, Moore A, Rodriguez M, Kellner U, Leo-Kottler B, Auburger G, Bhattacharya SS, Wissinger B. OPA1, encoding a dynamin-related GTPase, is mutated in autosomal dominant optic atrophy linked to chromosome 3q28. Nature Genetics. 2000;26:211–215. doi: 10.1038/79944. - DOI - PubMed
    1. Anand R, Wai T, Baker MJ, Kladt N, Schauss AC, Rugarli E, Langer T. The i-AAA protease YME1L and OMA1 cleave OPA1 to balance mitochondrial fusion and fission. The Journal of Cell Biology. 2014;204:919–929. doi: 10.1083/jcb.201308006. - DOI - PMC - PubMed
    1. Antonny B, Burd C, De Camilli P, Chen E, Daumke O, Faelber K, Ford M, Frolov VA, Frost A, Hinshaw JE, Kirchhausen T, Kozlov MM, Lenz M, Low HH, McMahon H, Merrifield C, Pollard TD, Robinson PJ, Roux A, Schmid S. Membrane fission by dynamin: what we know and what we need to know. The EMBO Journal. 2016;35:2270–2284. doi: 10.15252/embj.201694613. - DOI - PMC - PubMed
    1. Baker MJ, Tatsuta T, Langer T. Quality control of mitochondrial proteostasis. Cold Spring Harbor Perspectives in Biology. 2011;3:a007559. doi: 10.1101/cshperspect.a007559. - DOI - PMC - PubMed

Publication types

MeSH terms