. 2020 Jan 10:9:e53199.
doi: 10.7554/eLife.53199.

Structural basis for COMPASS recognition of an H2B-ubiquitinated nucleosome

Affiliations

Structural basis for COMPASS recognition of an H2B-ubiquitinated nucleosome

Evan J Worden et al. Elife. .

Abstract

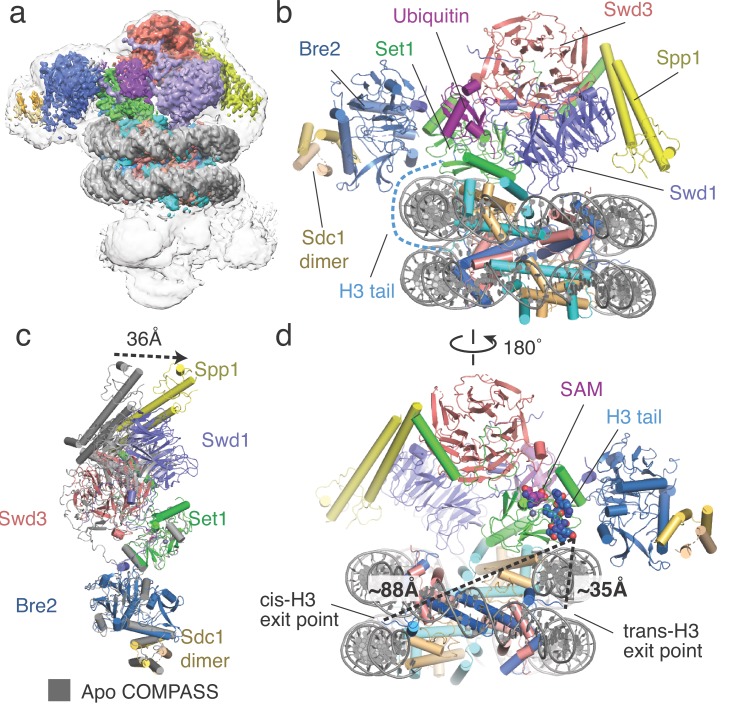
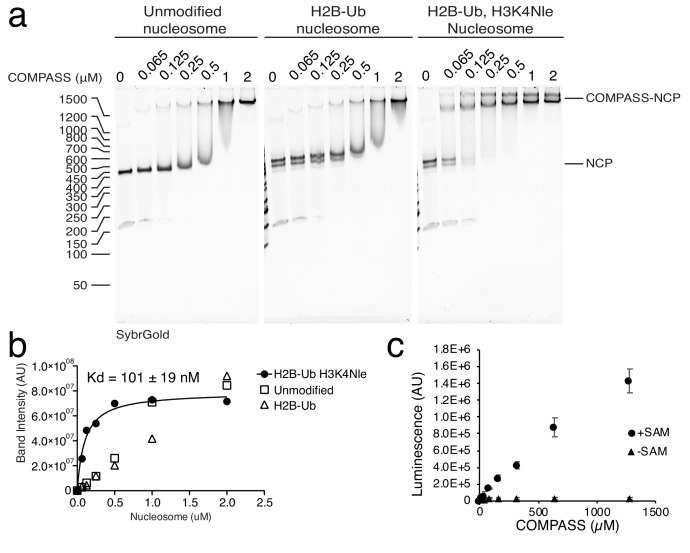
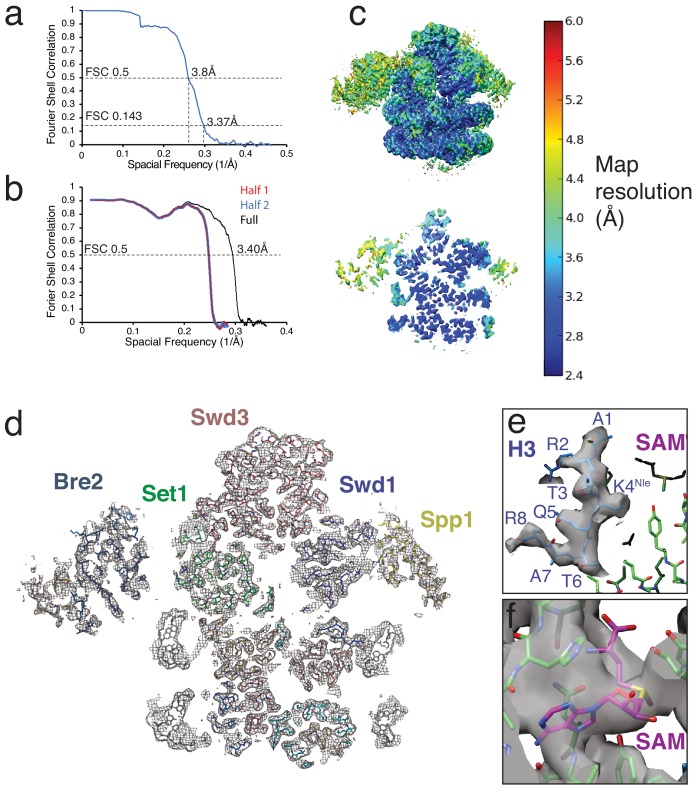
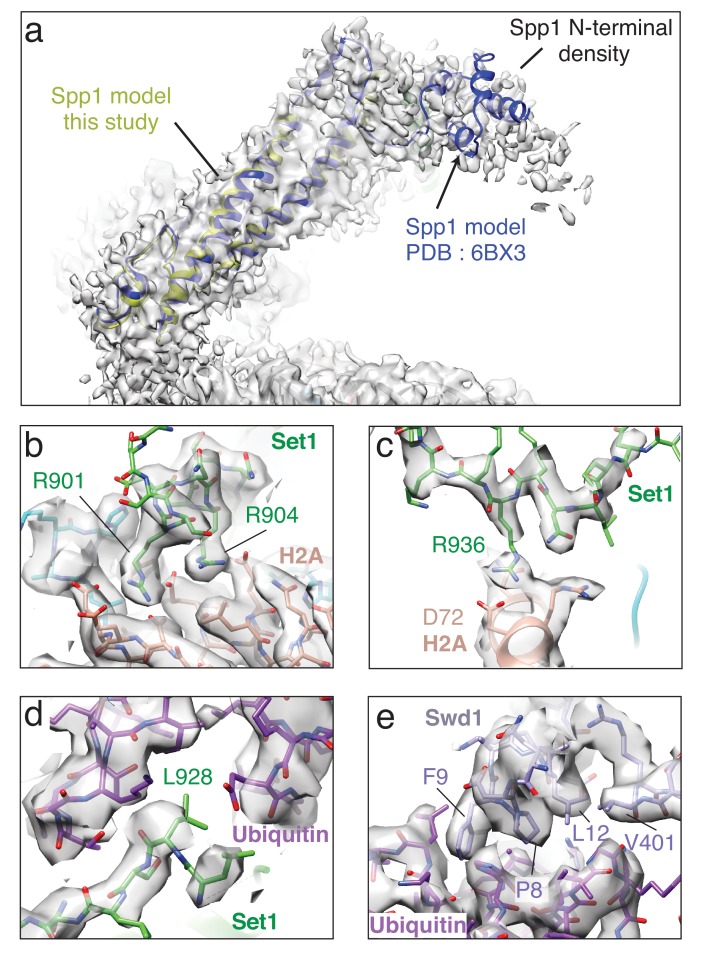
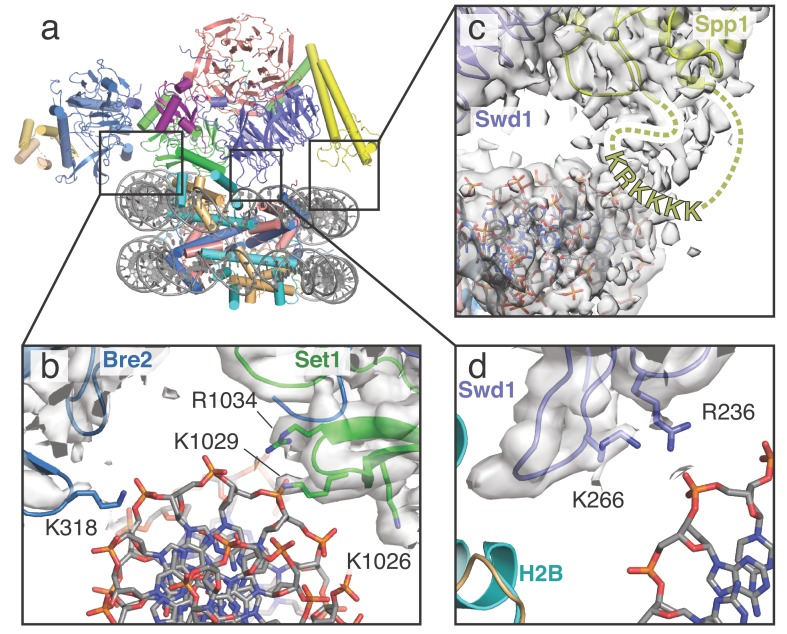
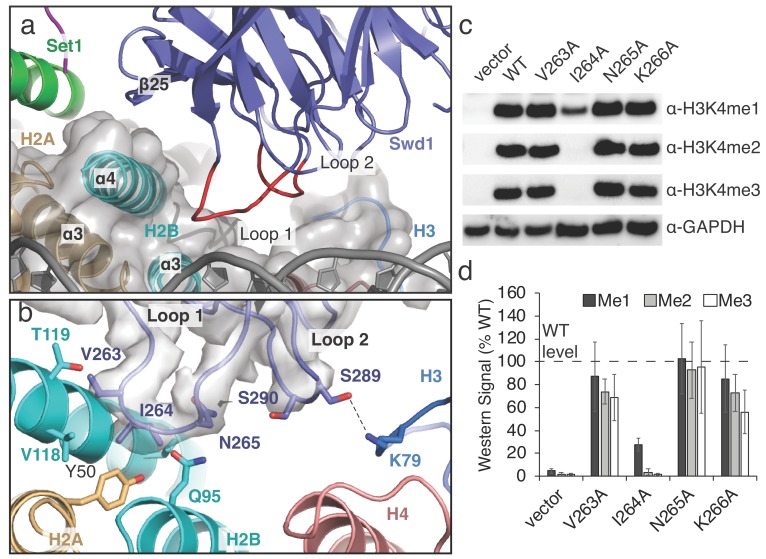
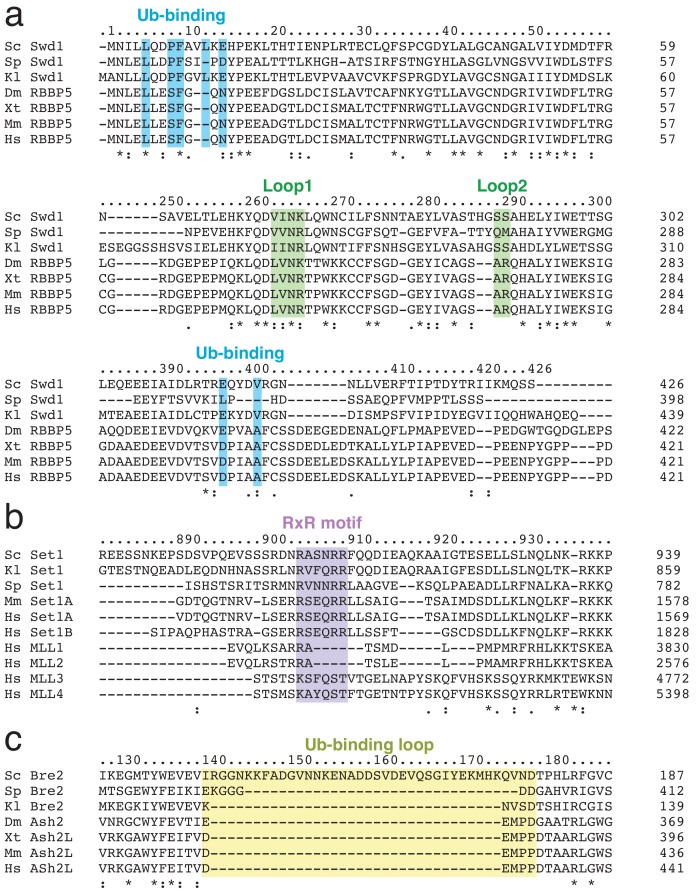
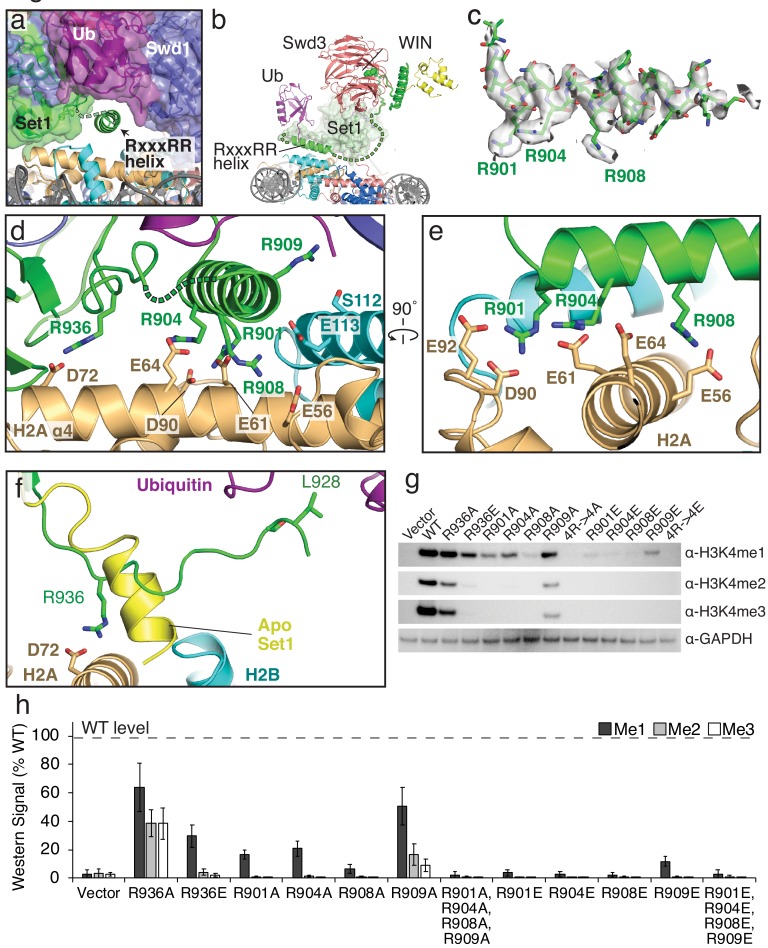
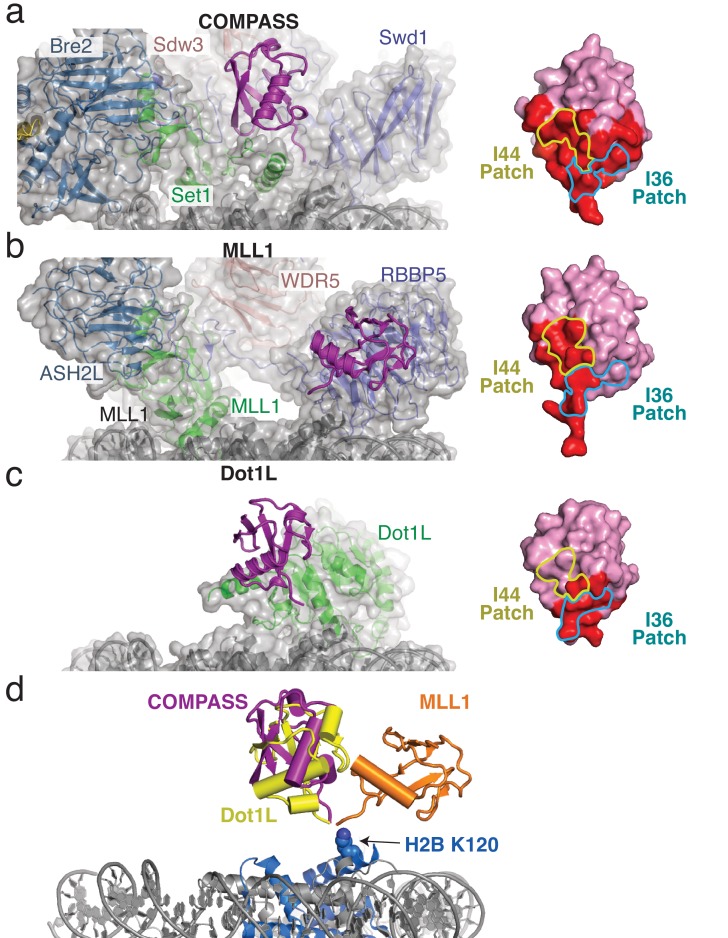
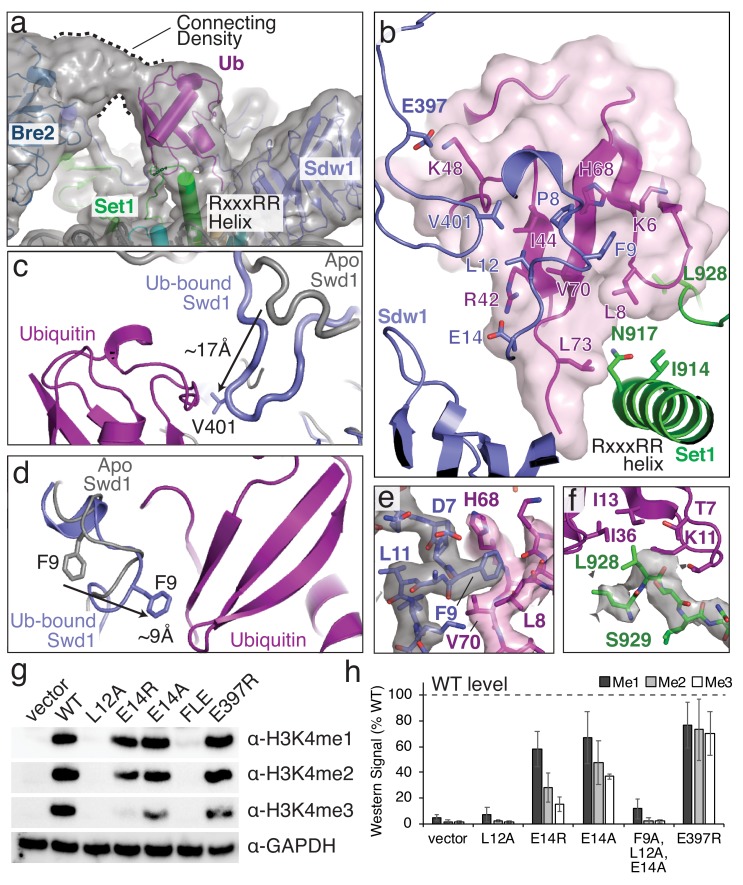
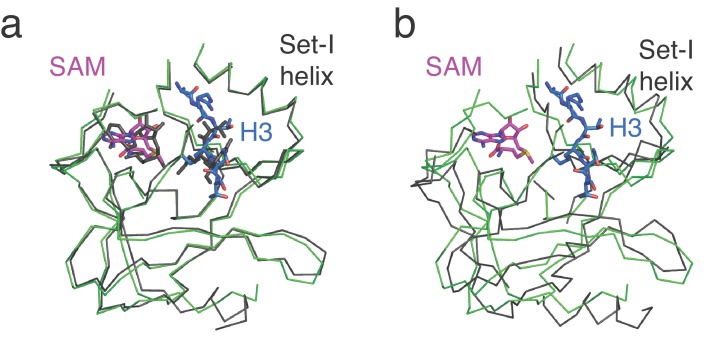
Methylation of histone H3K4 is a hallmark of actively transcribed genes that depends on mono-ubiquitination of histone H2B (H2B-Ub). H3K4 methylation in yeast is catalyzed by Set1, the methyltransferase subunit of COMPASS. We report here the cryo-EM structure of a six-protein core COMPASS subcomplex, which can methylate H3K4 and be stimulated by H2B-Ub, bound to a ubiquitinated nucleosome. Our structure shows that COMPASS spans the face of the nucleosome, recognizing ubiquitin on one face of the nucleosome and methylating H3 on the opposing face. As compared to the structure of the isolated core complex, Set1 undergoes multiple structural rearrangements to cement interactions with the nucleosome and with ubiquitin. The critical Set1 RxxxRR motif adopts a helix that mediates bridging contacts between the nucleosome, ubiquitin and COMPASS. The structure provides a framework for understanding mechanisms of trans-histone cross-talk and the dynamic role of H2B ubiquitination in stimulating histone methylation.

Keywords: S. cerevisiae; chromatin; chromosomes; gene expression; histone methylation; molecular biophysics; structural biology; transcription; ubiquitin.


Conflict of interest statement

EW, XZ No competing interests declared, CW Senior editor, eLife

Figures

Figure 1.
Figure 1.. Architecture of the COMPASS H2B-Ub nucleosome complex.
(a) Cryo-EM structure of the COMPASS-nucleosome complex. The unsharpened EM density showing two COMPASS molecules bound to the nucleosome is depicted as a semitransparent surface. The sharpened EM density of the complex is depicted as an opaque surface and colored according to the different subunits of the complex. (b) The model of the COMPASS-nucleosome complex is shown and colored as in panel a. The unstructured histone H3 tail residues between the H3 exit point in the nucleosome and the Set1 active site are depicted as a blue dashed line. (c) Large-scale structural motions of COMPASS from the nucleosome-free state to the nucleosome-bound state. Free COMPASS (PDB: 6BX3) is colored gray and nucleosome-bound COMPASS is colored according to panel b. The largest motion in the structural transition at the end of Spp1 is shown as a black dashed arrow. (d) The COMPASS-nucleosome structure viewed from the dyad axis. The distances between the cis-H3 and trans-H3 subunits and the H3 residues in the Set1 active site are shown as dashed black lines.
Figure 1—figure supplement 1.
Figure 1—figure supplement 1.. Analysis of COMPASS activty and binding to the nucleosome.
(a) Electrophoretic mobility shift assay (EMSA) showing COMPASS binding to different Nucleosome (NCP) variants. (b) Quantification of the EMSA shown in panel a. The binding interaction between COMPASS and the H2B-Ub, H3K4Nle nucleosome is fit to single site binding equation. (c) Activity of COMPASS toward an isolated H3 peptide with and without SAM in the reaction.
Figure 1—figure supplement 2.
Figure 1—figure supplement 2.. Cryo-EM processing pipeline.
Figure 1—figure supplement 3.
Figure 1—figure supplement 3.. Cryo-EM map and model validation and example density.
(a) Fourier Shell Correlation (FSC) for the COMPASS-nucleosome structure. (b) Model-Map FSC curves calculated from the refined atomic coordinates and the full-map used for refinement (Full) and the half-maps used for validation (Half 1 and Half 2). (c) Local map resolution estimates calculated from ResMap (Kucukelbir et al., 2014) and colored according to local resolution. Top left, full sharpened map. Bottom left, a slice through the center of the map. (d) A vertical slice through the structure of COMPASS bound to the H2B-Ub nucleosome. All chains in the atomic model are shown as sticks and the EM density is shown as a gray mesh. (e) Example EM density around the H3 tail in the Set1 active site. (f) Example EM density for the SAM cofactor.
Figure 1—figure supplement 4.
Figure 1—figure supplement 4.. Detailed views of EM density in the structure.
In all panels the sharpened EM density is shown as a semi-transparent gray surface. (a) Superimposition of Spp1 from PDB: 6BX3 and Spp1 from this study. The fragmented EM density at the end of Spp1 corresponds N-terminal part of Spp1. (b) Detailed view of the contact between the Set1 RxxxRR helix and the H2A acidic patch. (c) Detailed view of the interaction between Set1 R936 and H2A D72. (d) Detailed view of the interaction between Set1 L928 and the Ubiquitin I36 patch. (e) Detailed view of the contact between Swd1 and the Ubiquitin I44 patch.
Figure 2.
Figure 2.. COMPASS makes multiple contacts with nucleosome DNA.
(a) Model of the COMPASS-nucleosome structure shown in cartoon representation and colored as in Figure 1. (b–d) Detailed views of COMPASS interactions with nucleosomal DNA. In all views the experimental EM density is shown as a semi-transparent gray surface. (b) DNA contact between Set1 and Bre2. Potential DNA-interacting COMPASS residues are shown in stick representation. (c) Contact between a flexible loop in Spp1 and the nucleosomal DNA. The unmodeled loop of Spp1 is depicted as a yellow dashed line and the positively charged, putative DNA-interacting residues in the loop are shown as yellow letters. (d) Interaction between Swd1 and the nucleosome DNA. Swd1 residues that contact DNA are shown in stick representation.
Figure 3.
Figure 3.. A conserved loop in Swd1 contacts the histone core.
(a) Close up view of the contact between Swd1 and the histone core. Swd1 is shown as a blue cartoon and the two loops that contact the histone core are colored red. (b) Detailed view of the specific contacts made between Loop 1 and Loop 2 of Swd1 and the histone core. Potential hydrogen bonds are shown as black dashed lines and the sharpened EM density is shown as a transparent gray surface. (c) Western blot analysis of H3K4 methylation states in swd1Δ yeast strains transformed with plasmids containing the indicated swd1 variants. (d) Quantification of the western blots from panel c. Error bars are the standard deviation of the data (n = 4).
Figure 3—figure supplement 1.
Figure 3—figure supplement 1.. Multiple sequence alignments of Swd1, Set1 and Bre2.
(a–c) Multiple sequence alignments were generated using the Clustle Omega software (Sievers et al., 2011). Species names are abbreviated (Sc = Saccharomyces cerevisiae, Sp = Schizosaccharomyces pombe, Kl = Kluyveromyces lactis, Dm = Drosophila melanogaster, Xt = Xenopus tropicalis, Mm = Mus musculus, Hs = Homo sapiens). Important features from the COMPASS structure are highlighted. (a) Multiple sequence alignment of Swd1 and its homologs. (b) Multiple sequence alignment of Set1 and its homologs. (c) Multiple sequence alignment of Bre2 and its homologs.
Figure 4.
Figure 4.. The RxxxRR helix binds to the H2A/H2B acidic patch.
(a) The COMPASS-nucleosome structure with COMPASS subunits surrounded by semi-transparent colored surfaces. The RxxxRR helix passes underneath the H2B-linked ubiquitin and is shown in cartoon representation. (b) Cutaway view of the COMPASS nucleosome structure showing the RxxxRR helix passing between COMPASS and the nucleosome. (c) Sharpened EM density surrounding the RxxxRR helix, which is shown in stick representation. (d–e) End-on view (d) and side view (e) of the RxxxRR helix. Contacting residues between the RxxxRR helix and the H2A/H2B acidic patch are shown in stick representation. (f) Detailed view of the section of Set1 that undergoes a conformational change. The corresponding part of Set1 in the isolated COMPASS structure (PBD: 6BX3, Apo) is colored yellow and shown as a cartoon. The Set1 residues that make contacts with the histone core and Ubiquitin are shown in stick representation and colored green. (g) Western blot analysis of H3K4 methylation states in set1Δ yeast strains transformed with plasmids containing the indicated set1 variants. (h) Quantification of the western blots from panel g. Error bars are the standard deviation of the data (n = 3).
Figure 5.
Figure 5.. H2B-Ubiquitin recognition by different methyltransferases.
(a–c) Structures of H2B-ubiquitin activated methyltransferases bound to the H2B-Ub nucleosome. The structures are encompassed by a semitransparent gray surface, except for ubiquitin which is colored purple and depicted as a cartoon. Surface representations of the bound ubiquitin are shown on the right with the buried surface area colored red. The locations of the I44 and I36 patches are indicated with colored yellow and blue lines, respectively. (a) Structure of COMPASS bound the H2B-Ub nucleosome. (b) Structure of the MLL1 core complex bound to the H2B-Ub nucleosome (PDB: 6KIU). (c) Structure of Dot1L bound to the H2B-Ub nucleosome (PDB: 6NJ9). (d) Superimposition of the structures from a–c but only showing the ubiquitin to compare the relative positions of the H2B-linked Ubiquitin. H2B K120 is shown as spheres and colored blue.
Figure 6.
Figure 6.. Structural basis for COMPASS recognition of H2B-ub.
(a) Model of the COMPASS H2B-Ub nucleosome complex. The unsharpened EM density is shown as a semi-transparent gray surface. The connecting density between Bre2 and ubiquitin is shown. (b) Detailed view of the interactions made between Ubiquitin and Swd1 and Set1. Ubiquitin is enclosed in a semi-transparent pink surface and the interfacial residues are shown in stick representation. (c–d) Conformational changes in Swd1 that occur upon ubiquitin binding. The nucleosome-free (apo) structure of COMPASS is shown in gray (PDB: 6BX3). (c) Restructuring of the Swd1 C-terminal extension. (d) Restructuring of the Swd1 N-terminal extension. (e) Detailed view of Swd1 F9 interaction with ubiquitin. The sharpened EM density around Swd1 is shown as a semi-transparent gray surface and the EM density around ubiquitin is shown as a semi-transparent pink surface. (f) Detailed view of the interaction between Set1 L928 and ubiquitin. The sharpened EM density around Set1 is shown as a semi-transparent gray surface. (g) Western blot analysis of H3K4 methylation states in swd1Δ yeast strains transformed with plasmids containing the indicated swd1 variants. (h) Quantification of the western blots from panel g. Error bars are the standard deviation of the data (n = 4).
Figure 6—figure supplement 1.
Figure 6—figure supplement 1.. Comparison of Set1 catalytic domains from COMPASS in different states.
(a) Superimposition of the H2B-Ub nucleosome bound Set1 catalytic domain from S. cerevisiae (green) with the substrate bound, K. lactis Set1 catalytic domain from isolated COMPASS (PDB: 6CHG). (b) Superimposition of the H2B-Ub nucleosome bound Set1 catalytic domain from S. cerevisiae (green) with the substrate-free S. cerevisiae Set1 catalytic domain from isolated COMPASS (PDB: 6BX3).

Comment in

Similar articles

Cited by

References

    1. Adams PD, Afonine PV, Bunkóczi G, Chen VB, Davis IW, Echols N, Headd JJ, Hung L-W, Kapral GJ, Grosse-Kunstleve RW, McCoy AJ, Moriarty NW, Oeffner R, Read RJ, Richardson DC, Richardson JS, Terwilliger TC, Zwart PH. PHENIX : a comprehensive Python-based system for macromolecular structure solution. Acta Crystallographica Section D Biological Crystallography. 2010;66:213–221. doi: 10.1107/S0907444909052925. - DOI - PMC - PubMed
    1. Afonine PV, Poon BK, Read RJ, Sobolev OV, Terwilliger TC, Urzhumtsev A, Adams PD. Real-space refinement in PHENIX for cryo-EM and crystallography. Acta Crystallographica Section D Structural Biology. 2018;74:531–544. doi: 10.1107/S2059798318006551. - DOI - PMC - PubMed
    1. Anderson CJ, Baird MR, Hsu A, Barbour EH, Koyama Y, Borgnia MJ, McGinty RK. Structural basis for recognition of ubiquitylated nucleosome by Dot1L methyltransferase. Cell Reports. 2019;26:1681–1690. doi: 10.1016/j.celrep.2019.01.058. - DOI - PMC - PubMed
    1. Andrews AJ, Luger K. Nucleosome structure(s) and stability: variations on a theme. Annual Review of Biophysics. 2011;40:99–117. doi: 10.1146/annurev-biophys-042910-155329. - DOI - PubMed
    1. Avdic V, Zhang P, Lanouette S, Groulx A, Tremblay V, Brunzelle J, Couture J-F. Structural and biochemical insights into MLL1 core complex assembly. Structure. 2011;19:101–108. doi: 10.1016/j.str.2010.09.022. - DOI - PubMed

Publication types

MeSH terms