. 2021 Jan 23;72(1):30-37.
doi: 10.1093/cid/ciz1247.

Evaluation of Phylogenetic Methods for Inferring the Direction of Human Immunodeficiency Virus (HIV) Transmission: HIV Prevention Trials Network (HPTN) 052

Affiliations

Evaluation of Phylogenetic Methods for Inferring the Direction of Human Immunodeficiency Virus (HIV) Transmission: HIV Prevention Trials Network (HPTN) 052

Yinfeng Zhang et al. Clin Infect Dis. .

Abstract

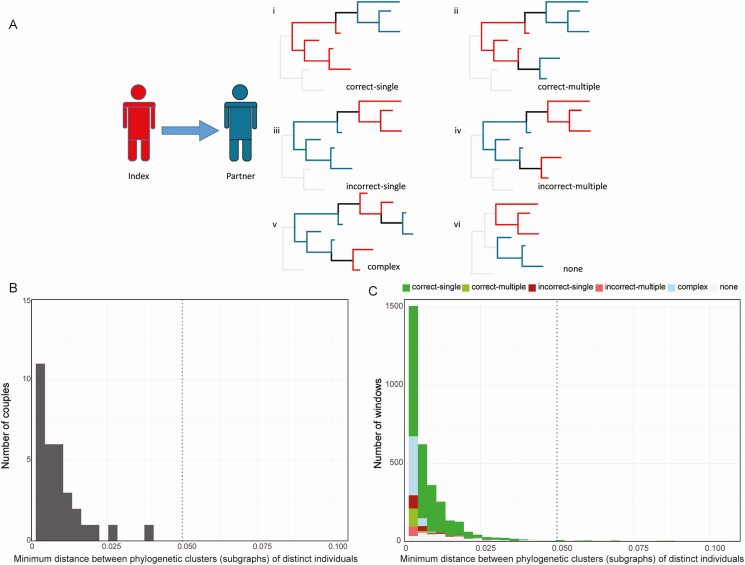
Background: Phylogenetic analysis can be used to assess human immunodeficiency virus (HIV) transmission in populations. We inferred the direction of HIV transmission using whole-genome HIV sequences from couples with known linked infection and known transmission direction.

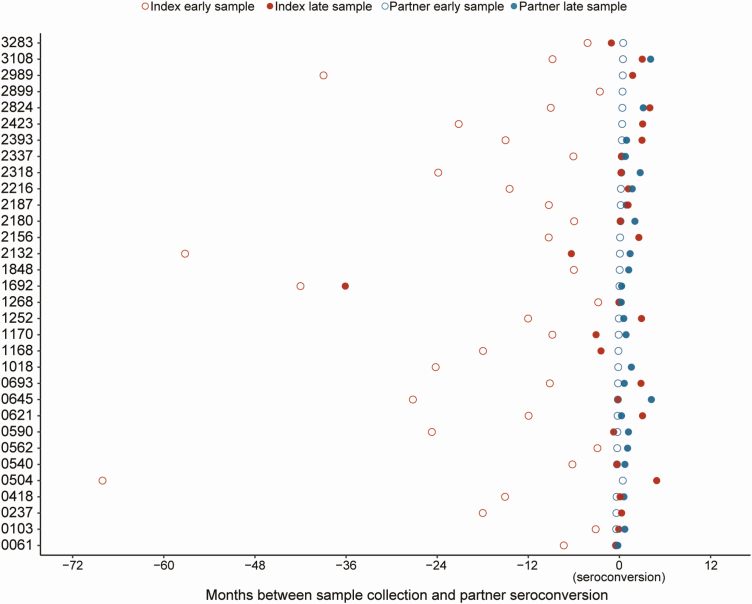
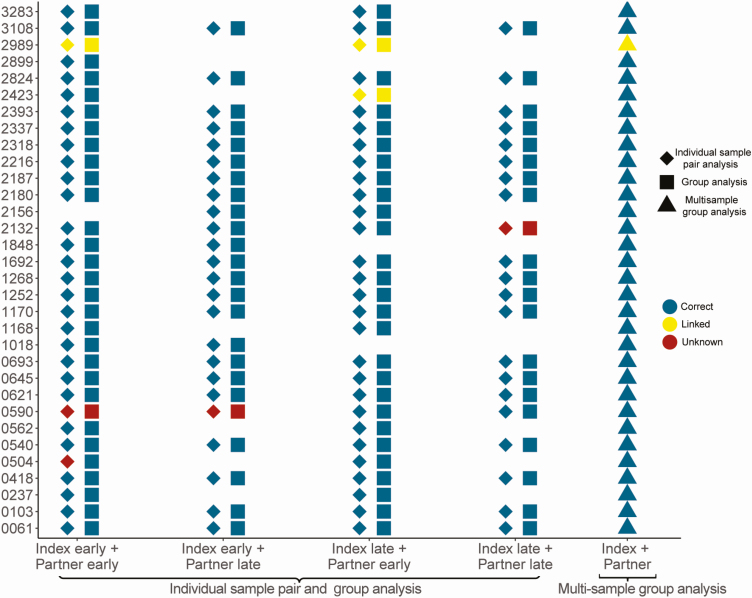
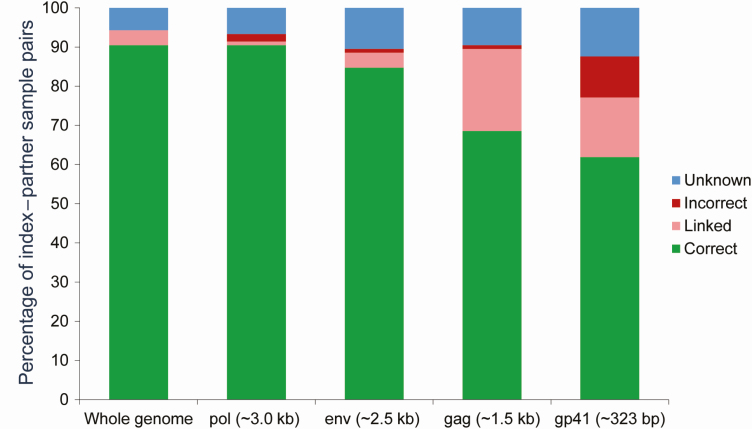
Methods: Complete next-generation sequencing (NGS) data were obtained for 105 unique index-partner sample pairs from 32 couples enrolled in the HIV Prevention Trials Network (HPTN) 052 study (up to 2 samples/person). Index samples were obtained up to 5.5 years before partner infection; partner samples were obtained near the time of seroconversion. The bioinformatics method, phyloscanner, was used to infer transmission direction. Analyses were performed using samples from individual sample pairs, samples from all couples (1 sample/person; group analysis), and all available samples (multisample group analysis). Analysis was also performed using NGS data from defined regions of the HIV genome (gag, pol, env).

Results: Using whole-genome NGS data, transmission direction was inferred correctly (index to partner) for 98 of 105 (93.3%) of the individual sample pairs, 99 of 105 (94.3%) sample pairs using group analysis, and 31 of the 32 couples (96.9%) using multisample group analysis. There were no cases where the incorrect transmission direction (partner to index) was inferred. The accuracy of the method was higher with greater time between index and partner sample collection. Pol region sequences performed better than env or gag sequences for inferring transmission direction.

Conclusions: We demonstrate the potential of a phylogenetic method to infer the direction of HIV transmission between 2 individuals using whole-genome and pol NGS data.

Keywords: HIV; HPTN 052; direction of transmission; next-generation sequencing; phylogenetic analysis.


Figures

Figure 1.
Figure 1.
Classes of topological relationships for index–partner couples and distance between phylogenetic clusters from different individuals and samples. A, Diagrams show examples of topological relationships that might be observed for sequences from index participants (red) and partners (blue); in the cases analyzed, human immunodeficiency virus was transmitted from the index to the partner. “Correct-single” indicates single ancestry with the correct direction of transmission (i); “correct-multiple” indicates multiple ancestry (transmission of multiple viral strains) with the correct transmission direction (ii); “incorrect-single” indicates single ancestry with the inverse (incorrect) transmission direction (iii); “incorrect-multiple” indicates multiple ancestry with the inverse (incorrect) transmission direction (iv); “complex” indicates that the relationship between the 2 hosts was too complex to predict transmission direction (v); “none” indicates no ancestry (vi). B, The histogram shows the distribution over the couples of the minimum subgraph distance obtained using phyloscanner; this analysis included data from 32 couples. All couples had mean minimum subgraph distance < 0.05 substitutions per site (indicated with a dotted line). C, The stacked bar graph shows the number of windows as a function of minimum subgraph distance; this analysis included data from 4607 windows from 105 index–partner sample pairs. The majority of windows (97.2%) had minimum subgraph distance < 0.05 substitutions per site (indicated with a dotted line). Colors indicate windows with the following results: single correct ancestry (correct-single), multiple correct ancestry (correct-multiple), single inverse ancestry (incorrect-single), multiple inverse ancestry (incorrect-multiple), complex (complex), and no relationship (none).
Figure 2.
Figure 2.
The plot shows the timing of sample collection for 32 couples. Index participants were human immunodeficiency virus (HIV) positive at study enrollment; partners were HIV negative at study enrollment. Next-generation sequencing data were obtained for 105 unique sample pairs (32 index early/partner early; 24 index early/partner late; 28 index late/partner early; 21 index late/partner late). Data from each couple are shown in 1 row; couple identifiers are shown on the y-axis. The x-axis shows the number of months between sample collection and partner seroconversion; negative numbers indicate that samples were collected before partner seroconversion. Partner samples used for these analyses were collected at the first HIV-positive visit (early) and at a subsequent study visit (late) at/after time of seroconversion. Index samples used for these analyses were collected at an earlier study visit (early) or near the time of partner seroconversion (late). Index samples are shown in red; partner samples are shown in blue. Early samples are shown with open circles; late samples are shown with filled circles.
Figure 3.
Figure 3.
Inferred direction of transmission using different sample sets. The plot shows the inferred relationship between sequences from each couple based on analysis of data from different sample sets using a window width of 320 bp (individual sample pair analysis and group) and 380 bp (multisample group analysis). Each symbol (diamond, square, or triangle) represents the inferred relationship based on a single analysis; data from each couple are shown in 1 row, with participant identifier numbers shown on the y-axis. Diamonds show results obtained using data from individual sample pairs (1 sample per participant; 1 couple per analysis); squares show results obtained using group analysis (samples selected based on the timing of sample collection; all couples combined); triangles show results obtained using multisample group analysis (up to 2 samples per participant, all couples combined). Colors of symbols correspond to the inferred transmission direction: blue symbols indicate the correct inferred direction; yellow symbols indicate pairs that were classified as linked with no direction inferred; red symbols indicate that the analysis did not yield a result for linkage or transmission direction. Blank spaces indicate that the specific combination of samples (eg, index early+partner late) was not available for analysis.
Figure 4.
Figure 4.
Inferred direction of transmission using whole-genome sequences compared to gag, pol, and env sequences. A comparison of phyloscanner results using next-generation sequencing (NGS) data from single genes (gag, pol, or env) or NGS data from the whole human immunodeficiency virus genome. The plot shows the percentage of sample pairs with the correct/incorrect inferred transmission direction (green bars/red bars). Peach bars indicate pairs that were classified as linked with no direction determined. Blue bars indicate that the analysis did not yield a result for linkage or transmission direction. The analysis was performed using a window width of 340 bp with sequences from 105 sample pairs; the same transmission inference criteria were used for the whole genome and for single genes.

Comment in

References

    1. Cohen MS, Chen YQ, McCauley M, et al. . HPTN 052 Study Team Antiretroviral therapy for the prevention of HIV-1 transmission. N Engl J Med 2016; 375:830–9. - PMC - PubMed
    1. Cohen MS, Chen YQ, McCauley M, et al. . HPTN 052 Study Team Prevention of HIV-1 infection with early antiretroviral therapy. N Engl J Med 2011; 365:493–505. - PMC - PubMed
    1. Desai M, Field N, Grant R, McCormack S. Recent advances in pre-exposure prophylaxis for HIV. BMJ 2017; 359:j5011. - PMC - PubMed
    1. Hassan AS, Pybus OG, Sanders EJ, Albert J, Esbjörnsson J. Defining HIV-1 transmission clusters based on sequence data. AIDS 2017; 31:1211–22. - PMC - PubMed
    1. Hué S, Clewley JP, Cane PA, Pillay D. HIV-1 pol gene variation is sufficient for reconstruction of transmissions in the era of antiretroviral therapy. AIDS 2004; 18:719–28. - PubMed

Publication types