. 2020 Jan 10;15(1):e0227558.
doi: 10.1371/journal.pone.0227558. eCollection 2020.

Non-gradient and genotype-dependent patterns of RSV gene expression

Affiliations

Non-gradient and genotype-dependent patterns of RSV gene expression

Felipe-Andrés Piedra et al. PLoS One. .

Abstract

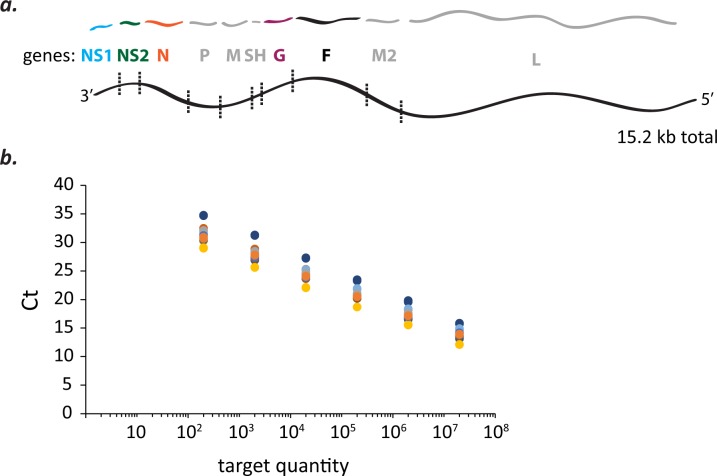
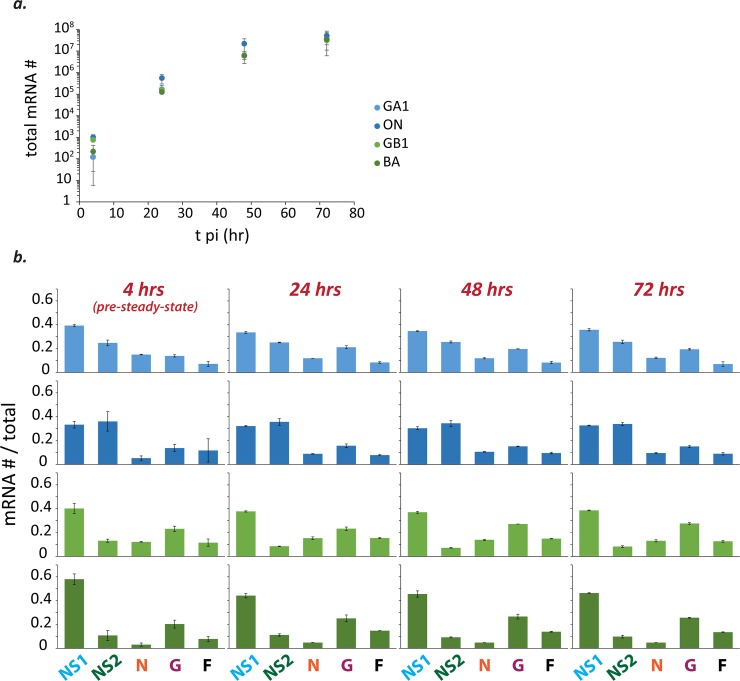
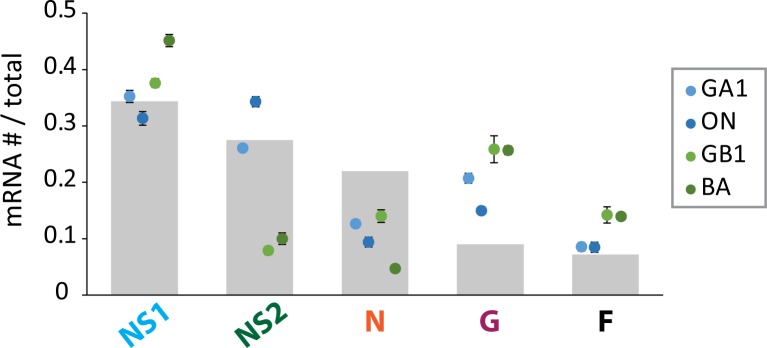
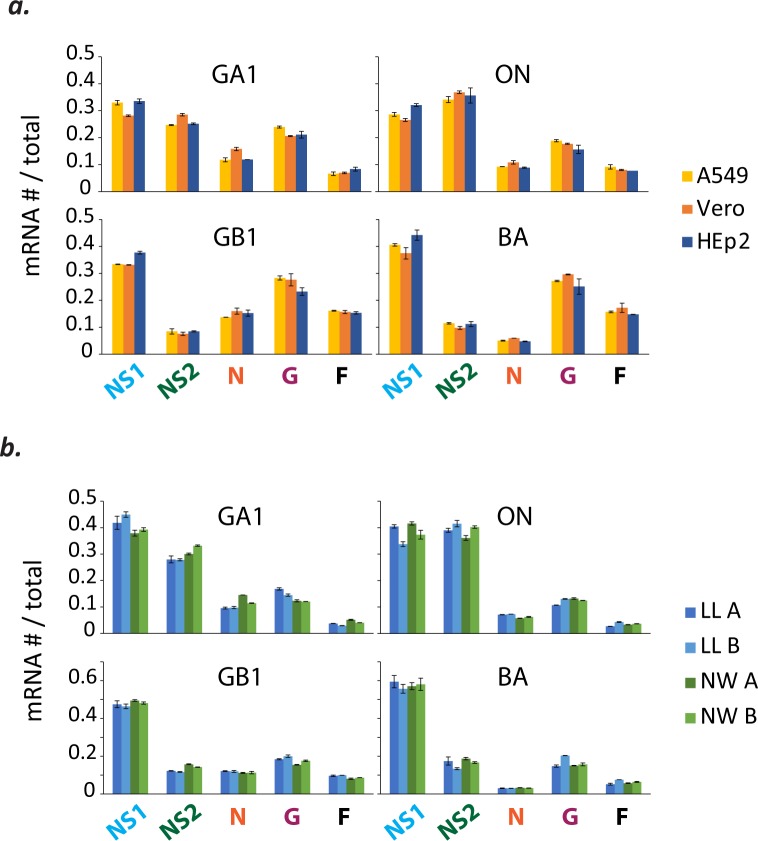
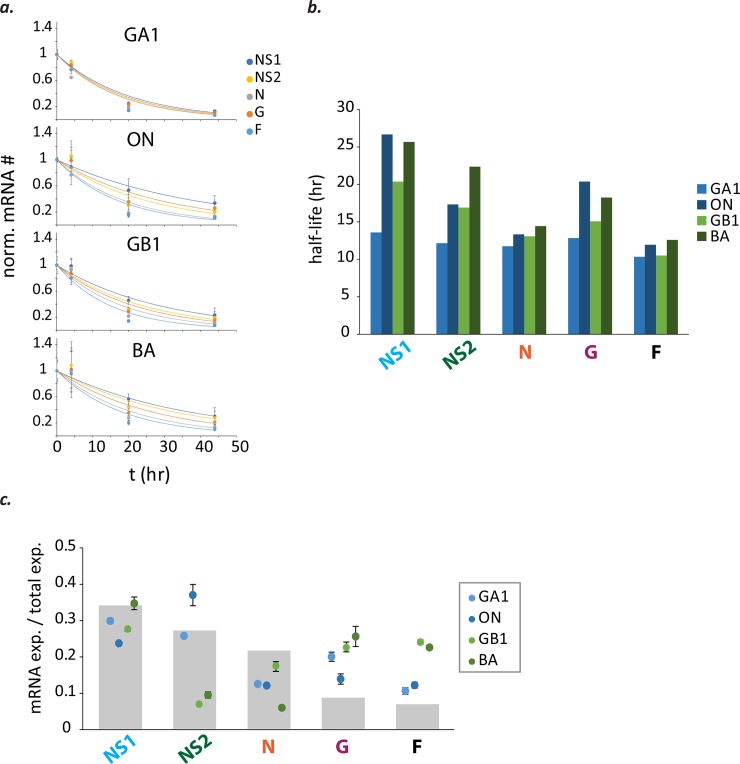
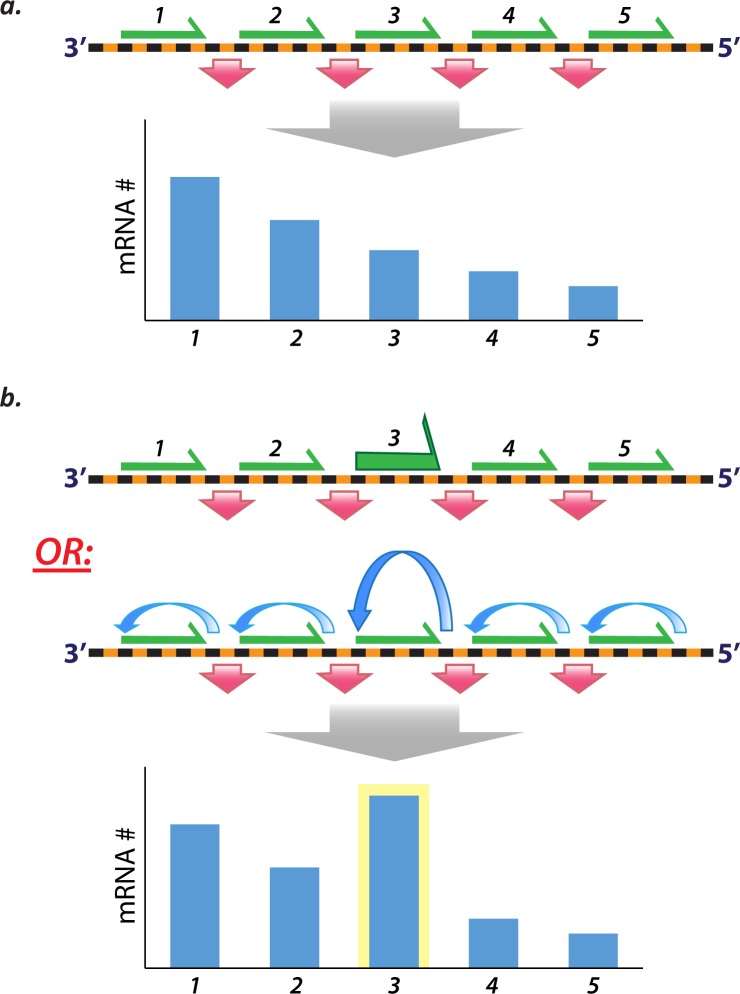
Respiratory syncytial virus (RSV) is a nonsegmented negative-strand RNA virus (NSV) and a leading cause of severe lower respiratory tract illness in infants and the elderly. Transcription of the ten RSV genes proceeds sequentially from the 3' promoter and requires conserved gene start (GS) and gene end (GE) signals. Previous studies using the prototypical GA1 genotype Long and A2 strains have indicated a gradient of gene transcription extending across the genome, with the highest level of mRNA coming from the most promoter-proximal gene, the first nonstructural (NS1) gene, and mRNA levels from subsequent genes dropping until reaching a minimum at the most promoter-distal gene, the polymerase (L) gene. However, recent reports show non-gradient levels of mRNA, with higher than expected levels from the attachment (G) gene. It is unknown to what extent different transcript stabilities might shape measured mRNA levels. It is also unclear whether patterns of RSV gene expression vary, or show strain- or genotype-dependence. To address this, mRNA abundances from five RSV genes were measured by quantitative real-time PCR (qPCR) in three cell lines and in cotton rats infected with RSV isolates belonging to four genotypes (GA1, ON, GB1, BA). Relative mRNA levels reached steady-state between four and 24 hours post-infection. Steady-state patterns were non-gradient and genotype-specific, where mRNA levels from the G gene exceeded those from the more promoter-proximal nucleocapsid (N) gene across isolates. Transcript stabilities could not account for the non-gradient patterns observed, indicating that relative mRNA levels more strongly reflect transcription than decay. Our results indicate that gene expression from a small but diverse set of RSV genotypes is non-gradient and genotype-dependent. We propose novel models of RSV transcription that can account for non-gradient transcription.


Conflict of interest statement

The authors have declared that no competing interests exist.

Figures

Fig 1
Fig 1. qPCR-based measurements of mRNA abundances for five RSV genes from four isolates representing different genotypes using oligonucleotide standards.
(a) Five of 10 RSV genes were chosen for mRNA abundance measurements by qPCR. The 5 genes (NS1, NS2, N, G, & F) span half of the nucleotide length of the 15.2 kb genome and its entire gene length minus the final two genes, M2 and L. (b) Known amounts of different oligonucleotide standards were detected over a similar range of cycle threshold (CT) values. Twenty different oligonucleotide standards at known concentrations were needed (4 virus isolates x 5 mRNA targets) to convert CT values measured for viral mRNA targets into mRNA abundances. Each dot represents the mean CT of duplicate measurements of an oligonucleotide standard at a known concentration or quantity (= number of molecules / qPCR rxn). Dots of like color are dilutions of the same oligonucleotide standard.
Fig 2
Fig 2. Total mRNA abundances plateau beyond 48 hours post-infection and relative mRNA levels reach steady-state soon after the start of infection.
(a) Total mRNA abundances (= NS1+NS2+N+G+F) from HEp-2 cells infected with different isolates of RSV (MOI = 0.01) begin to plateau by ~48 hours post-infection (pi). Each dot (RSV/A/GA1Tracy [pale blue]; RSV/A/ON/121301043A [dark blue]; RSV/B/GB1/18537 [light green]; RSV/B/BA/80171 [dark green]) represents the mean and error bars the standard deviation of two independent experiments (n = 2). For each independent experiment, the mean was calculated from duplicate measurements and used in subsequent calculations. (b) Relative mRNA levels reach steady-state sometime between four and 24 hours pi. Histograms depicting relative mRNA levels are shown for all measured time-points (4, 24, 48, 72 hr pi) and all four isolates (color scheme same as (a)). Each bar depicts the mean mRNA # / total mRNA # of the indicated species and error bars show the standard deviation (n = 2). For each independent experiment, the mean was calculated from duplicate measurements and used in subsequent calculations.
Fig 3
Fig 3. Relative mRNA levels are genotype-specific and non-gradient.
Grey bars depict relative mRNA levels expected from an expression gradient resulting from a 20% decrease in transcription at every gene junction. Each dot depicts the mean mRNA # / total mRNA # observed for the indicated species and isolate (RSV/A/GA1Tracy [pale blue]; RSV/A/ON/121301043A [dark blue]; RSV/B/GB1/18537 [light green]; RSV/B/BA/80171 [dark green]) in HEp-2 cells (MOI = 0.01) at steady-state. Steady-state mean relative mRNA levels and standard deviation were calculated using the mean of each relevant time-point (24, 48, 72 hours post-infection). The mean of each time-point was calculated from two independent experiments, and the mean from each experiment was calculated from duplicate measurements as described.
Fig 4
Fig 4. Relative mRNA levels are comparable in different cell lines and in nasal wash and lung lavage samples from infected cotton rats.
(a) Relative mRNA levels are comparable in different cell lines. Viral mRNA levels were measured from infected A549 (in yellow), Vero (in orange), and HEp-2 (in blue) cell lines (MOI = 0.01) at 24 hours post-infection (pi). Each bar depicts the mean mRNA # / total mRNA # of the indicated species and error bars show the standard deviation (n = 2). For each independent experiment, the mean was calculated from duplicate measurements and used in subsequent calculations. (b) Relative mRNA levels are comparable in lung lavage (LL) and nasal wash (NW) samples from infected cotton rats. Each bar depicts the mean mRNA # / total mRNA # of the indicated species and error bars show the standard deviation calculated from duplicate measurements of the same sample. Results from LL samples collected 4 days pi are shown in blue (cotton rat A = light blue; cotton rat B = dark blue) and NW samples shown in green (cotton rat A = light green; cotton rat B = dark green).
Fig 5
Fig 5. Transcript stabilities do not account for non-gradient patterns, indicating that relative mRNA levels strongly reflect RSV gene expression.
(a) Viral mRNAs decay after addition of GS-5734, a viral polymerase inhibitor. Viral mRNA levels were divided by RNase P mRNA levels to control for well-to-well variation in the amount of sample obtained, then normalized. Each dot represents the mean normalized mRNA # and error bars the standard deviation of two independent experiments (n = 2). For each independent experiment, a mean was calculated from the means of two different samples; and each sample mean was obtained from duplicate measurements. (b) Decay constants obtained from exponential decay functions fit to each data set were used to calculate mRNA half-lives (RSV/A/GA1Tracy [pale blue]; RSV/A/ON/121301043A [dark blue]; RSV/B/GB1/18537 [light green]; RSV/B/BA/80171 [dark green]). (c) Transcript stabilities cannot account for non-gradient mRNA levels. Grey bars depict relative mRNA levels expected from an expression gradient resulting from a 20% decrease in transcription at every gene junction. Each dot depicts the mean expressed mRNA # / total expressed mRNA # estimated for the indicated mRNA species and virus isolate in HEp-2 cells (MOI = 0.01) at 24 hours post-infection (mRNA expressed = mRNA # observed * e(decay constant * 24 hr)).
Fig 6
Fig 6. Non-gradient transcription requires novel models of RSV transcription.
(a) The hitherto widely accepted model of RSV (and all NSV) transcription involves sequential transcription from the 3’ promoter and transcriptional attenuation at gene junctions. Shown in black and orange is a cartoon representation of an idealized NSV genome. The green arrows represent equal probabilities of transcription at each of five genes, and the red arrows represent equal attenuation of transcription at each gene junction. Combined with sequential transcription, equal probabilities of transcription and equal rates of attenuation (and assuming equal transcript stabilities) result in a gradient of mRNA levels (shown as a plot depicting decreasing levels of mRNA from genes 1 to 5). (b) Non-gradient RSV transcription requires alternative models. Two such models incorporate either 1) transcription of variable probability (top cartoon–see green arrow of increased size indicating a higher probability of transcription at gene 3) and/or 2) polymerase recycling (bottom cartoon–see blue arrows indicating successive rounds of transcription of the same gene, with gene 3 supporting more rounds of transcription). Transcription of variable probability at different genes is supported by published data showing varied effects of different cis-acting sequences on gene expression. Polymerase recycling describes the repeated transcription of a single gene by one or more polymerases before proceeding to a downstream gene. Polymerase recycling would require polymerase scanning, which is well established, and potentially a mechanism to bias polymerase scanning away from the next downstream GS signal and back toward the upstream GS signal.

Similar articles

Cited by

References

    1. American Academy of Pediatrics Subcommittee on D, Management of B. Diagnosis and management of bronchiolitis. Pediatrics. 2006;118(4):1774–93. 10.1542/peds.2006-2223 . - DOI - PubMed
    1. Hasegawa K, Tsugawa Y, Brown DF, Mansbach JM, Camargo CA Jr. Temporal trends in emergency department visits for bronchiolitis in the United States, 2006 to 2010. Pediatr Infect Dis J. 2014;33(1):11–8. 10.1097/INF.0b013e3182a5f324 - DOI - PMC - PubMed
    1. Mansbach JM, Piedra PA, Teach SJ, Sullivan AF, Forgey T, Clark S, et al. Prospective multicenter study of viral etiology and hospital length of stay in children with severe bronchiolitis. Arch Pediatr Adolesc Med. 2012;166(8):700–6. 10.1001/archpediatrics.2011.1669 - DOI - PMC - PubMed
    1. Nair H, Nokes DJ, Gessner BD, Dherani M, Madhi SA, Singleton RJ, et al. Global burden of acute lower respiratory infections due to respiratory syncytial virus in young children: a systematic review and meta-analysis. Lancet. 2010;375(9725):1545–55. 10.1016/S0140-6736(10)60206-1 - DOI - PMC - PubMed
    1. Zorc JJ, Hall CB. Bronchiolitis: recent evidence on diagnosis and management. Pediatrics. 2010;125(2):342–9. 10.1542/peds.2009-2092 . - DOI - PubMed

MeSH terms