. 2020 Jan 9;180(1):50-63.e12.
doi: 10.1016/j.cell.2019.12.016.

Enteric Nervous System-Derived IL-18 Orchestrates Mucosal Barrier Immunity

Affiliations

Enteric Nervous System-Derived IL-18 Orchestrates Mucosal Barrier Immunity

Abigail Jarret et al. Cell. .

Erratum in

  • Enteric Nervous System-Derived IL-18 Orchestrates Mucosal Barrier Immunity.
    Jarret A, Jackson R, Duizer C, Healy ME, Zhao J, Rone JM, Bielecki P, Sefik E, Roulis M, Rice T, Sivanathan KN, Zhou T, Solis AG, Honcharova-Biletska H, Vélez K, Hartner S, Low JS, Qu R, de Zoete MR, Palm NW, Ring AM, Weber A, Moor AE, Kluger Y, Nowarski R, Flavell RA. Jarret A, et al. Cell. 2020 Feb 20;180(4):813-814. doi: 10.1016/j.cell.2020.02.004. Cell. 2020. PMID: 32084342 No abstract available.

Abstract

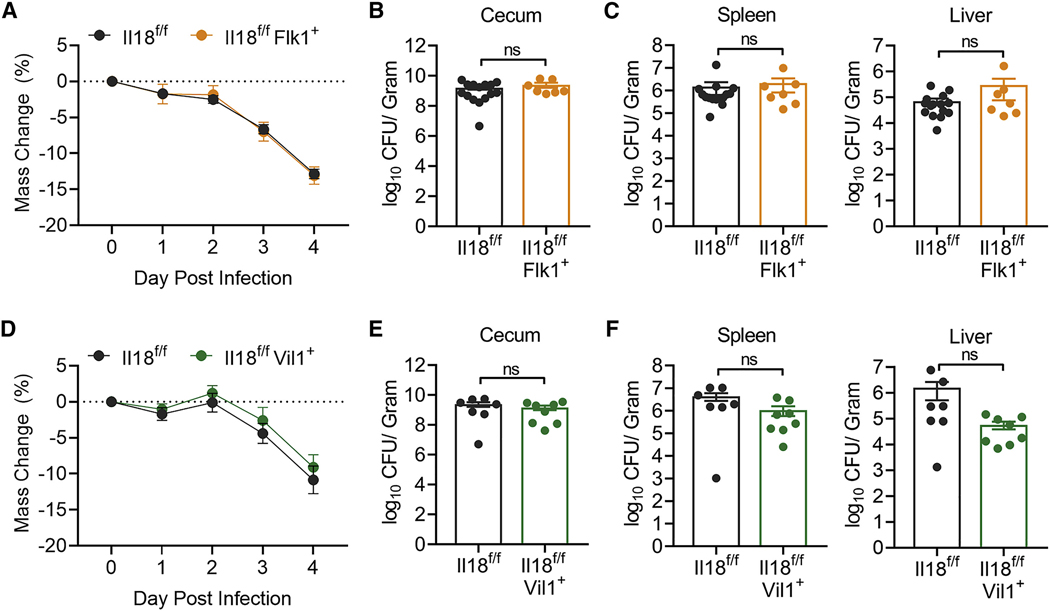
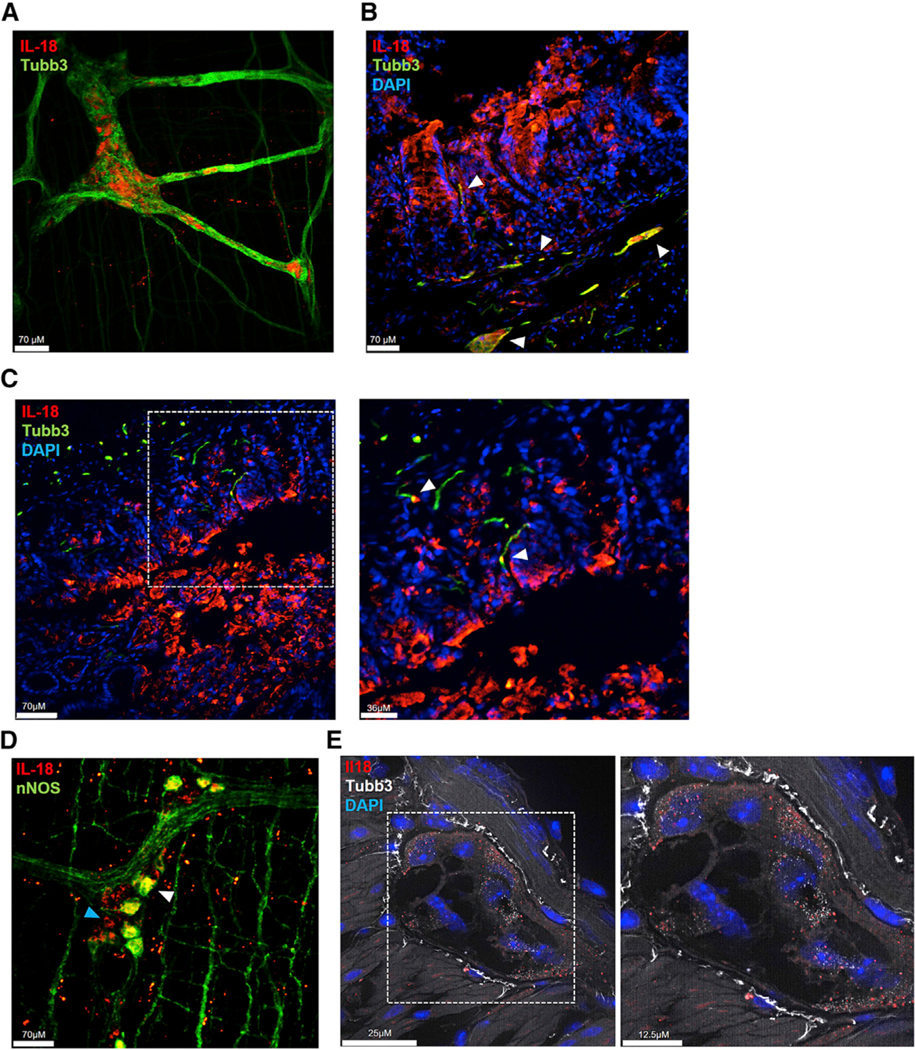
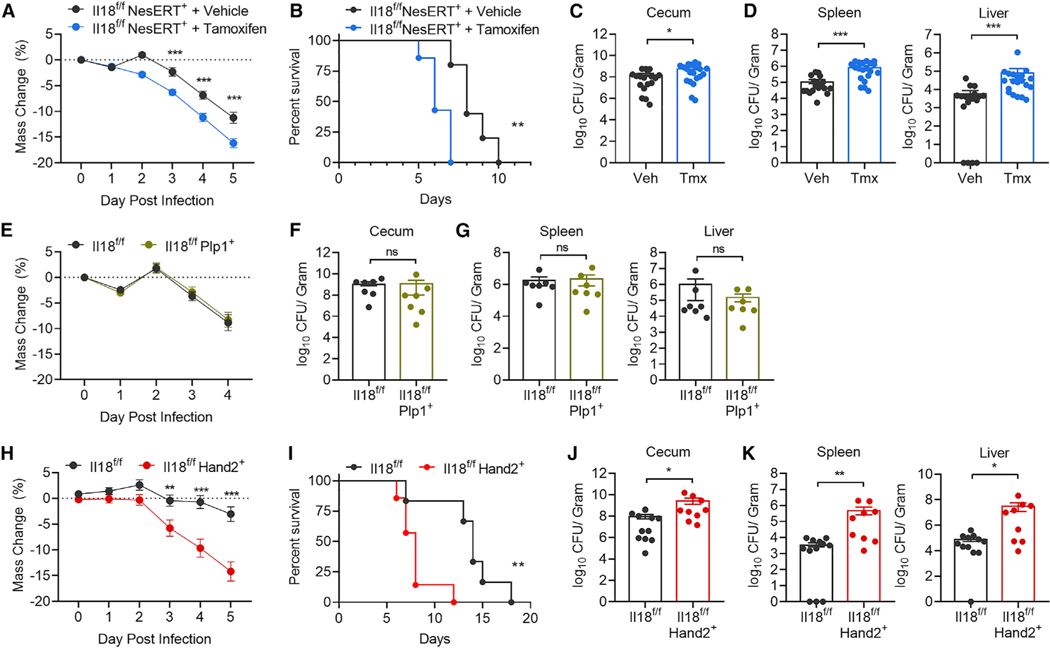
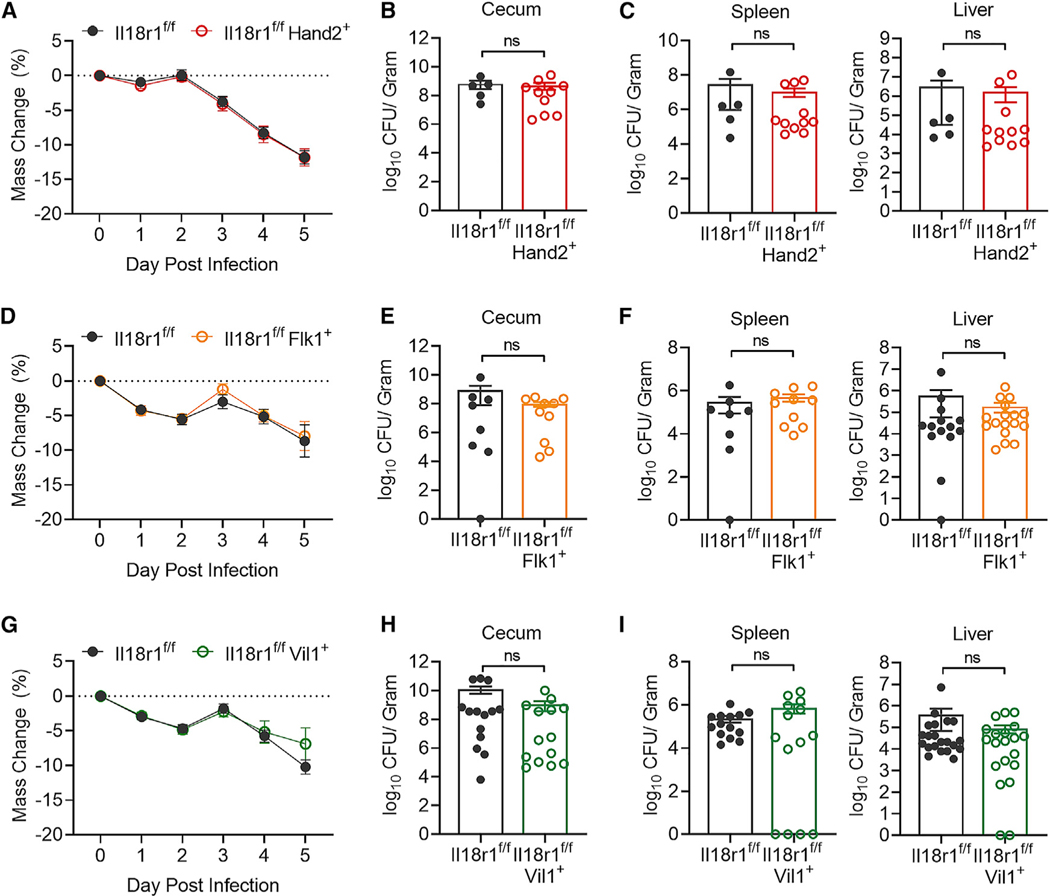
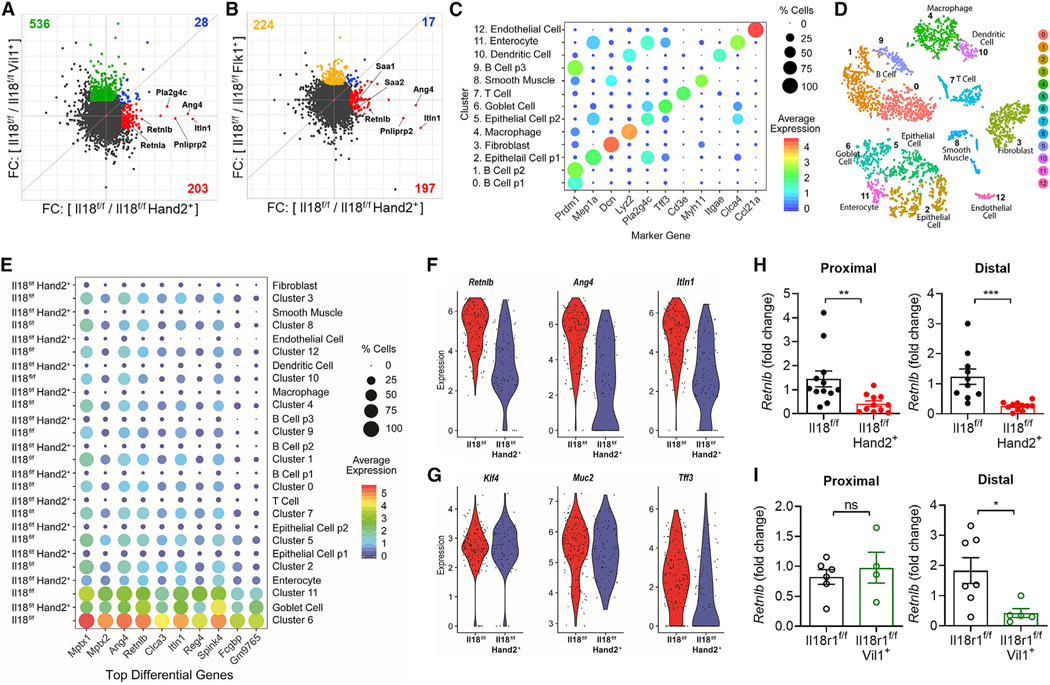
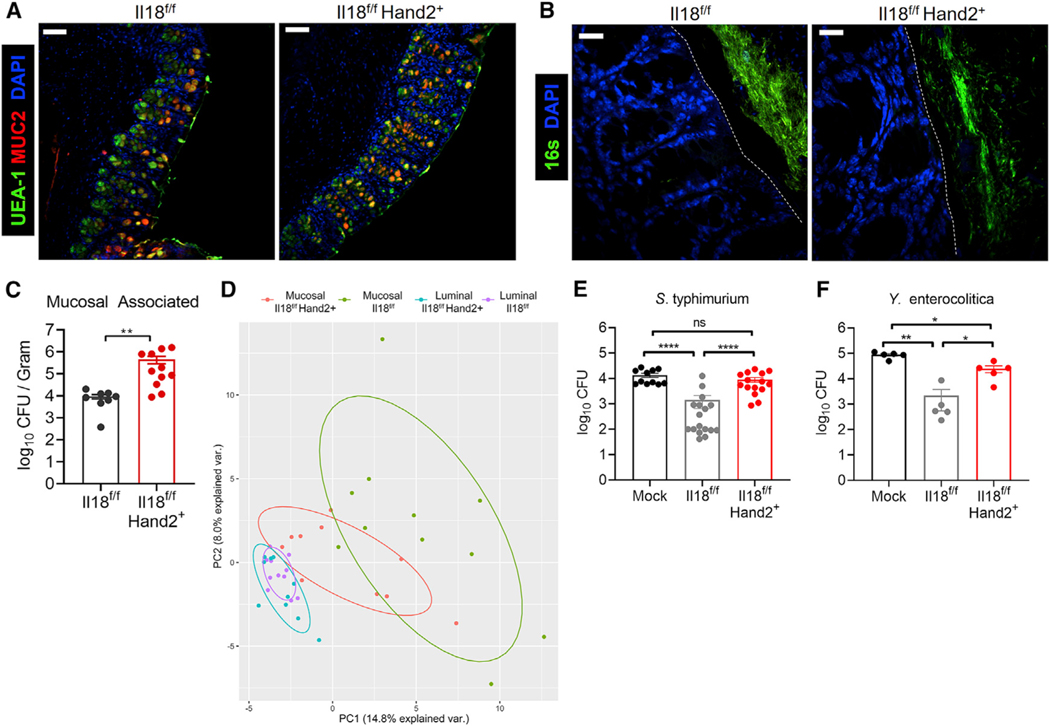
Mucosal barrier immunity is essential for the maintenance of the commensal microflora and combating invasive bacterial infection. Although immune and epithelial cells are thought to be the canonical orchestrators of this complex equilibrium, here, we show that the enteric nervous system (ENS) plays an essential and non-redundant role in governing the antimicrobial protein (AMP) response. Using confocal microscopy and single-molecule fluorescence in situ mRNA hybridization (smFISH) studies, we observed that intestinal neurons produce the pleiotropic cytokine IL-18. Strikingly, deletion of IL-18 from the enteric neurons alone, but not immune or epithelial cells, rendered mice susceptible to invasive Salmonella typhimurium (S.t.) infection. Mechanistically, unbiased RNA sequencing and single-cell sequencing revealed that enteric neuronal IL-18 is specifically required for homeostatic goblet cell AMP production. Together, we show that neuron-derived IL-18 signaling controls tissue-wide intestinal immunity and has profound consequences on the mucosal barrier and invasive bacterial killing.

Keywords: Salmonella; antimicrobial proteins; barrier immunity; colon; goblet cell; homeostasis; inflammasome; microbiota; mucosal immunology; neuroimmunology.


Figures

Figure 1.
Figure 1.. Epithelial Cell- and Immune Cell-Derived IL-18 Does Not Protect against Enteric S.t. Infection
(A) Weight loss of Il18f/f (n = 15) or Il18f/fFlk1+ (n = 7) mice infected with S.t. Data represent mean ± SEM; unpaired t test was used for statistical analysis. Data represent two independent experiments combined. (B and C) S.t. colony-forming unit (CFU)/g of (B) cecum, (C) spleen, and liver from Il18f/f or Il18f/fFlk1+ mice 4 days post-infection. Data represent mean ± SEM; Mann-Whitney test was used for statistical analysis. Each dot represents one mouse. Data represent two independent experiments combined. (D) Weight loss of Il18f/f (n = 7) or Il18f/fVil1+ (n = 8) mice infected with S.t. Data represent mean ± SEM; unpaired t test was used for statistical analysis. Data represent two independent experiments combined from three total independent experiments. (E and F) S.t. CFU/g of (E) cecum, (F) spleen, and liver from Il18f/f or Il18f/fVil1+ mice 4 days post-infection. Data represent mean ± SEM; Mann-Whitney test was used for statistical analysis. Each dot represents one mouse. Data represent two independent experiments combined from three total independent experiments.
Figure 2.
Figure 2.. Enteric Neurons Express IL-18
(A) Confocal immunofluorescence (IF) image of the myenteric plexus (MP) isolated from rat colon stained for IL-18 (red), the neuronal marker Tubulin beta 3 (Tubb3; green), and DAPI (blue). (B and C) Confocal IF images of rat colon cross-sections stained for IL-18 (red), Tubb3 (green), and DAPI (blue). Arrows highlight IL-18+ Tubb3+ neurons, which can be seen near the base of crypts and in villi. (D) Confocal IF image of the MP isolated from rat colon stained for IL-18 (red), nNOS (green), and DAPI (blue). White arrow highlights an IL-18+ nNOS+ cell body, blue arrow highlights an IL-18+ nNOS− cell body. (E) Visualization of Il18 (red) and Tubb3 (white) transcripts and DAPI (blue) in mouse colon cross-sections detected by single-molecule fluorescence in situ mRNA hybridization.
Figure 3.
Figure 3.. Enteric Neuronal IL-18 Is Protective against S.t. Infection
(A) Weight loss of Il18f/fNesERT+ mice pretreated with tamoxifen (TMX) (n = 20) or vehicle (n = 18) then infected with S.t. Data represent mean ± SEM; unpaired t test was used for statistical analysis. Data represent two independent experiments combined from three total independent experiments. (B) Survival curve for S.t.-infected Il18f/fNesERT+ mice pretreated with TMX (n = 5) or vehicle (n = 7). Log rank test was used for analysis. Data represent two independent experiments combined. (C and D) S.t. CFU/g of (C) cecum, (D) spleen, and liver from Il18f/fNesERT+ mice, pretreated with vehicle or TMX, 5 days post-infection. Data represent mean ± SEM; Mann-Whitney test was used for statistical analysis. Each dot represents one mouse. Data represent two independent experiments combined from three total independent experiments. (E) Weight loss of Il18f/f (n = 7) or Il18f/fPlp1+ (n = 7) mice pretreated with TMX then infected with S.t. Data represent mean ± SEM; unpaired t test was used for statistical analysis. Data represent two independent experiments combined. (F and G) S.t. CFU/g of (F) cecum, (G) spleen, and liver from Il18f/f (n = 7) or Il18f/fPlp1+ (n = 7) pretreated with TMX, 4 days post-infection. Data represent mean ± SEM; Mann-Whitney test was used for statistical analysis. Each dot represents one mouse. Data represent two independent experiments combined. (H) Weight loss of Il18f/f (n = 20) or Il18f/fHand2+ (n = 17) mice infected S.t. Data represent mean ± SEM; unpaired t test was used for statistical analysis. Data represent two independent experiments combined from three total independent experiments. (I) Survival curve for S.t.-infected Il18f/f (n = 6) or Il18f/fHand2+ (n = 7) mice. Log rank test was used for analysis. Data represent two independent experiments combined. (J and K) S.t. CFU/g of (J) cecum, (K) spleen, and liver from Il18f/f or Il18f/fHand2+ mice 5 days post-infection. Data represent mean ± SEM; Mann-Whitney test was used for statistical analysis. Each dot represents one mouse. Data represent two independent experiments combined from three total independent experiments. *p < 0.05, **p < 0.01, ***p < 0.001, ****p < 0.0001
Figure 4.
Figure 4.. Intrinsic IL-18 Signaling to Epithelial, Immune, or Neuronal Cells Does Not Mediate Protection against S.t. Infection
(A) Weight loss of II18r1f/f (n = 14)or Il18r1 f/fHand2+ (n = 25) infected with S.t. Data represent mean ± SEM; unpaired t test was used for statistical analysis. Data represent two independent experiments combined. (B and C) S.t. CFU/g of (B) cecum, (C) spleen, and liverfrom Il18r1f/f (n = 5) or Il18r1f/fHand2+ (n = 11) mice 5 days post-infection. Data represent mean ± SEM; Mann-Whitney test was used for statistical analysis. Each dot represents one mouse. Data represent one independent experiment of two total independent experiments. (D) Weight lossof Il18r1f/f(n = 8) or Il18r1f/fFlk1+ (n = 10) mice infected with S.t. Data represent mean ± SEM; unpaired t testwas used forstatistical analysis. Data represent two independent experiments combined. (E and F)S.t. CFU/g of(E) cecum, (F) spleen, and liverfrom Il18r1f/f(n = 8) or Il18r1f/fFlk1+ (n = 10) mice 5 days post-infection. Data represent mean ± SEM; Mann-Whitney test was used for statistical analysis. Each dot represents one mouse. Data represent two independent experiments combined. (G) Weight loss of Il18r1f/f (n = 14) or Il18r1f/fVil1+ (n = 14) mice infected S.t. Data represent mean ± SEM; unpaired t test was used for statistical analysis. Data represent two independent experiments combined. (H and I) S.t. CFU/g of(H) cecum, (I) spleen, and liverfrom Il18r1f/f(n = 14)or Il18r1f/fVil1+ (n = 14) mice 5 days post-infection. Data represent mean ± SEM; Mann-Whitney test was used for statistical analysis. Each dot represents one mouse. Data represent two independent experiments combined.
Figure 5.
Figure 5.. Enteric Neuronal IL-18 Is a Specific Driver of Goblet Cell Derived-AMP Expression
(A and B) Matched proximal colons (n = 2 per genotype) from cohoused llttermatesot the Indicated genotypes were collected, RNA Isolated, and RNA sequencing analysis conducted. (A) Comparison of wild-type/knockout fold-change between Il18f/f and Il18f/fHand2+ or Il18f/f and Il18f/fVil1+. Gene sets with fold-change ≥ 2 that are unique to Il18f/fHand2+ (red) or Il18f/fVil1+ (green) or shared by both genotypes (blue) are highlighted. AMPs are labeled. (B) Comparison of wild-type/knockout fold-change between Il18f/f and Il18f/fHand2+ or Il18f/f and Il18f/fFlk1+. Gene sets with fold-change ≥ 2 that are unique to Il18f/fHand2+ (red) or Il18f/fFlk1+ (yellow) or shared by both genotypes (blue) are highlighted. AMPs are labeled. (C–G). Single-cell RNA sequencing was performed on colonic cells isolated from Il18f/f (n = 2) and Il18f/fHand2+ (n = 2) mice then analyzed by ALRA (Adaptively-thresholded Low-Rank Approximation). (C) Integrative analysis reveals marker genes for each cluster. (D) Clustering and labeling of these cells visualized on a t-SNE plot. (E) Analysis of the top 10 differentially regulated genes between Il18f/f and Il18f/fHand2+ in all clusters. (F and G) Violin plots illustrate expression distribution of (F) the AMPs Retnlb, Ang4, and Itln1 or (G) goblet cell genes Klf4, Muc2, and Tff3 in the annotated goblet cell cluster (cluster 6) of Il18f/f or Il18f/fHand2+ samples. (H) Gene expression of Retnlb in tissue from the proximal or distal colon of Il18f/f and Il18f/fHand2+ mice, results are presented as relative to an Il18f/f sample. Data represent mean ± SEM; each dot represents one mouse; unpaired t test was used for statistical analysis. (I) Gene expression of Retnlb in tissue from the proximal or distal colon of Il18r1f/f and Il18r1f/fVil1+ mice, results are presented as relative to an Il18f/f sample. Data represent mean ± SEM; each dot represents one mouse; unpaired t test was used for statistical analysis. *p < 0.05, **p < 0.01, ****p < 0.0001
Figure 6.
Figure 6.. Neuronal IL-18-Driven AMP Expression Prevents Bacterial Infiltration and Infection
(A) Confocal IF images of colon cross-sections from Il18f/f or Il18f/fHand2+ stained for Muc2 (red) and with UEA I (green) and DAPI (blue). Scale bar represents 70 μm. (B) Visualization of bacteria in relation to the epithelial brush border by 16S rRNA fluorescence in situ hybridization (green) and DAPI (blue). The brush boarder is demarked by a dotted line. Scale bar represents 18μm. (C) Quantification of viable mucosal-associated anaerobic bacteria in proximal colon biopsies from Il18f/f or Il18f/fHand2+ mice. Each dot represents a biopsy from an individual mouse colon. Data represent two independent experiments combined from three total independent experiments. Data represent mean ± SEM; Mann-Whitney test was used for statistical analysis. (D) Principal component analysis based on the relative abundance (>0.001) of bacterial operational taxonomic units from mucosa-associated or luminal microbiota. Luminal and mucosa-associated samples were collected from the same animals housed in Yale animal facilities. (E and F) Media or colonic explant supernatants from Il18f/f or Il18,f/fHand2+ mice were generated and incubated with (E) 104 CFU S.t. or (F) 105 CFU Y. enterocolitica for 1 h. Surviving bacterial CFUs were enumerated. Each dot represents a control media sample or explant supernatant from an individual mouse colon. Data represent mean ± SEM; Mann-Whitney test was used for statistical analysis. (E) Data represent two independent experiments combined from three total independent experiments. (F) Data represent one independent experiment. *p < 0.05, **p < 0.01, ***p < 0.001, ****p < 0.0001

Comment in

References

    1. Austin KM (2012). The pathogenesis of Hirschsprung’s disease-associated enterocolitis. Semin. Pediatr. Surg. 21, 319–327. - PubMed
    1. Baig MS, Zaichick SV, Mao M, de Abreu AL, Bakhshi FR, Hart PC, Saqib U, Deng J, Chatterjee S, Block ML, et al. (2015). NOS1-derived nitric oxide promotes NF-κB transcriptional activity through inhibition of suppressor of cytokine signaling-1. J. Exp. Med. 212, 1725–1738. - PMC - PubMed
    1. Barajon I, Serrao G, Arnaboldi F, Opizzi E, Ripamonti G, Balsari A, and Rumio C (2009). Toll-like receptors 3, 4, and 7 are expressed in the enteric nervous system and dorsal root ganglia. J. Histochem. Cytochem. 57, 1013–1023. - PMC - PubMed
    1. Barthel M, Hapfelmeier S, Quintanilla-Martinez L, Kremer M, Rohde M, Hogardt M, Pfeffer K, Russmann H, and Hardt WD (2003). Pretreatment of mice with streptomycin provides a Salmonella enterica serovar Typhimurium colitis model that allows analysis of both pathogen and host. Infect. Immun. 71, 2839–2858. - PMC - PubMed
    1. Belkind-Gerson J, Carreon-Rodriguez A, Benedict LA, Steiger C, Pieretti A, Nagy N, Dietrich J, and Goldstein AM (2013). Nestin-expressing cells in the gut give rise to enteric neurons and glial cells. Neurogastroenterol. Motil. 25, 61–69.e7. - PMC - PubMed

Publication types

MeSH terms

LinkOut - more resources