

Effects of spaceflight on the composition and function of the human gut microbiota
- PMID: 31924114
- PMCID: PMC7524348
- DOI: 10.1080/19490976.2019.1710091
Effects of spaceflight on the composition and function of the human gut microbiota
Abstract
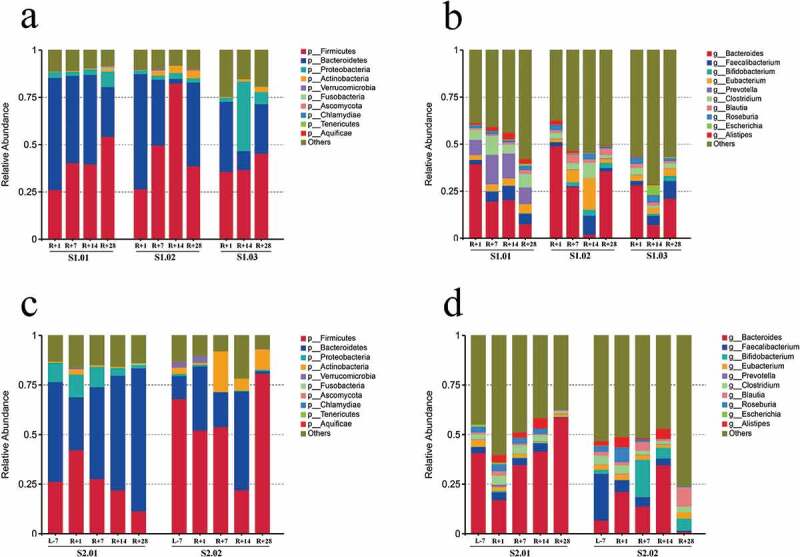
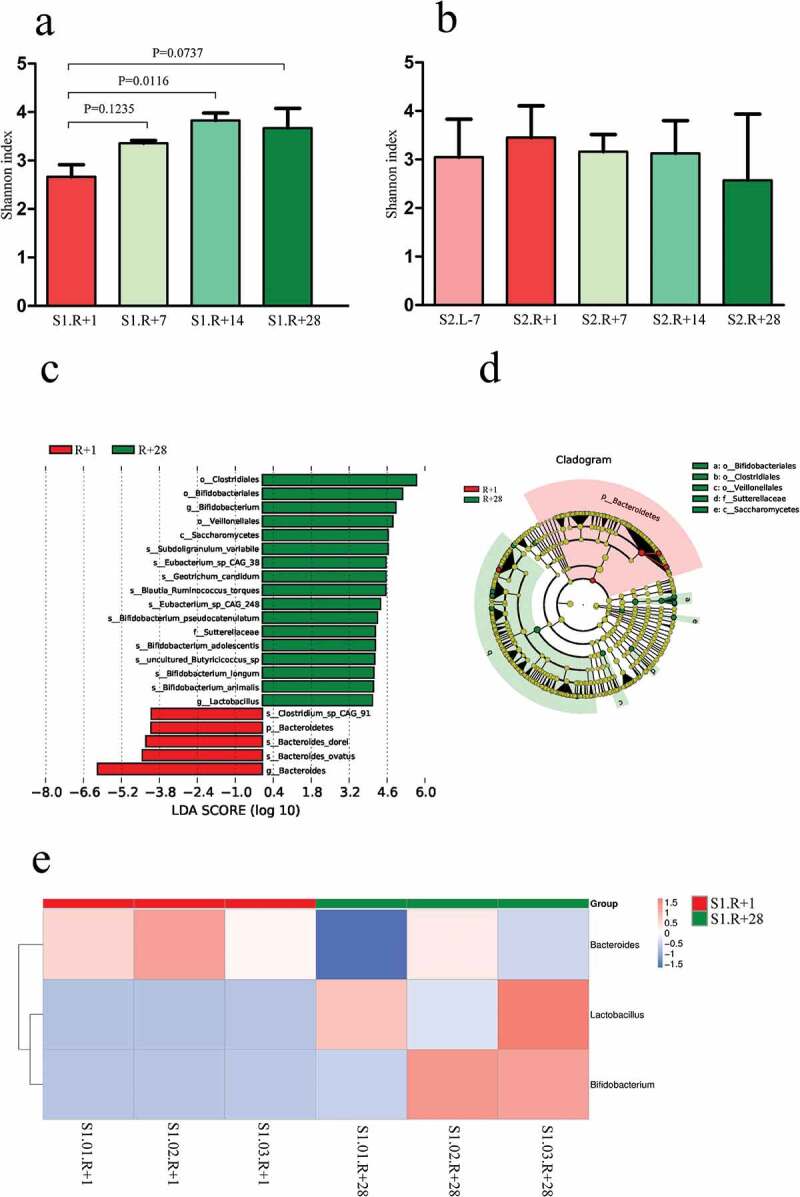
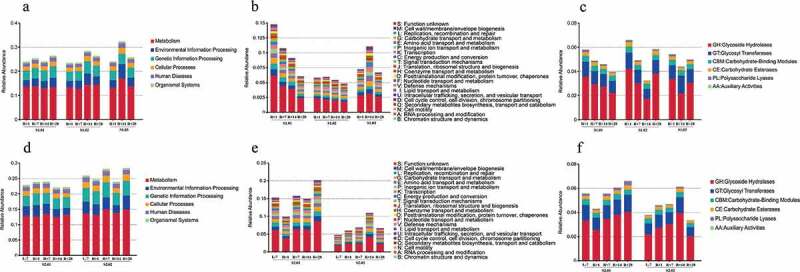
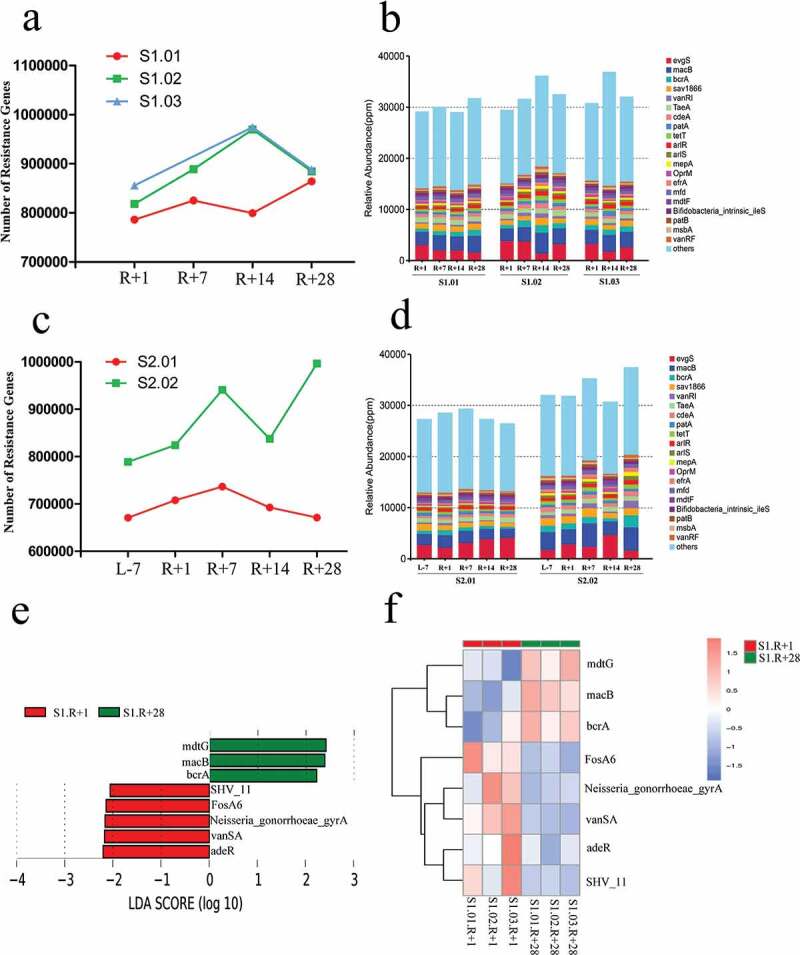
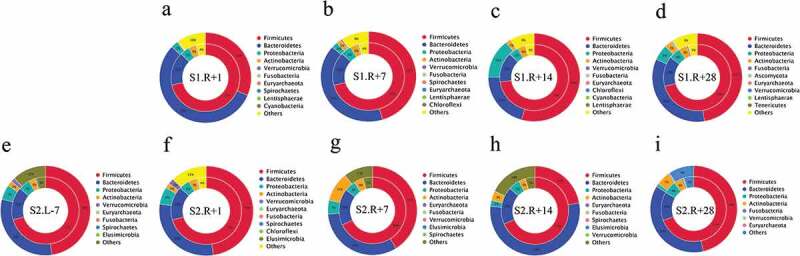
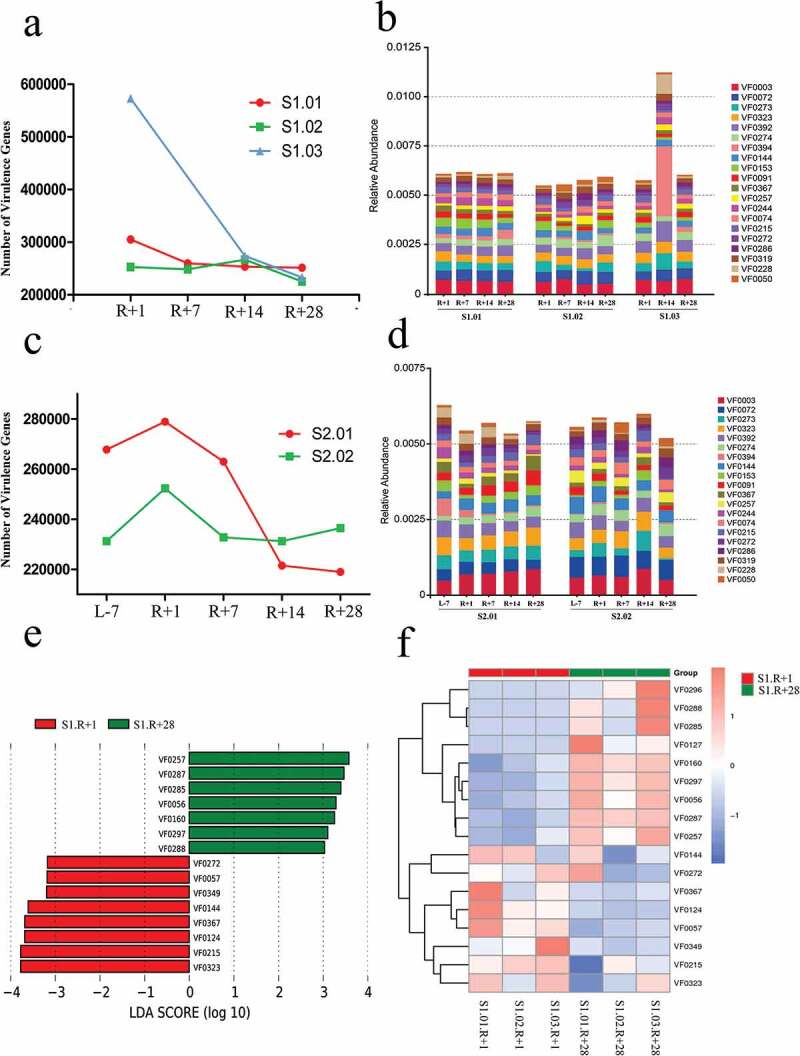
Interaction between humans and the gut microbiota is important for human physiology. Here, the gut microbiota was analyzed via metagenomic sequencing, and the fluctuations in the gut microbiota under the conditions of spaceflight were characterized. The composition and function of the gut microbiota were substantially affected by spaceflight; however, individual specificity was uncompromised. We further confirmed the species fluctuations and functional genes from both missions. Resistance and virulence genes in the gut microbiota were affected by spaceflight, but the species attributions remained stable. Spaceflight markedly affected the composition and function of the human gut microbiota, implying that the human gut microbiota is sensitive to spaceflight.
Keywords: Gut microbiota; resistance genes; spaceflight; species composition; virulence genes.
Figures
Similar articles
-
Comparative gut microbiota and resistome profiling of intensive care patients receiving selective digestive tract decontamination and healthy subjects.Microbiome. 2017 Aug 14;5(1):88. doi: 10.1186/s40168-017-0309-z. Microbiome. 2017. PMID: 28803549 Free PMC article.
-
Molecular Insights into Antimicrobial Resistance Traits of Commensal Human Gut Microbiota.Microb Ecol. 2019 Feb;77(2):546-557. doi: 10.1007/s00248-018-1228-7. Epub 2018 Jul 16. Microb Ecol. 2019. PMID: 30009332
-
A cohort study in family triads: impact of gut microbiota composition and early life exposures on intestinal resistome during the first two years of life.Gut Microbes. 2024 Jan-Dec;16(1):2383746. doi: 10.1080/19490976.2024.2383746. Epub 2024 Aug 2. Gut Microbes. 2024. PMID: 39092808 Free PMC article.
-
An insider's perspective: Bacteroides as a window into the microbiome.Nat Microbiol. 2017 Apr 25;2:17026. doi: 10.1038/nmicrobiol.2017.26. Nat Microbiol. 2017. PMID: 28440278 Free PMC article. Review.
-
Systematic review of human gut resistome studies revealed variable definitions and approaches.Gut Microbes. 2020 Nov 9;12(1):1700755. doi: 10.1080/19490976.2019.1700755. Epub 2020 Jan 16. Gut Microbes. 2020. PMID: 31942825 Free PMC article.
Cited by
-
Simulated spaceflight-induced cardiac remodeling is modulated by gut microbial-derived trimethylamine N-oxide.iScience. 2023 Nov 22;26(12):108556. doi: 10.1016/j.isci.2023.108556. eCollection 2023 Dec 15. iScience. 2023. PMID: 38125015 Free PMC article.
-
Specific host metabolite and gut microbiome alterations are associated with bone loss during spaceflight.Cell Rep. 2023 May 30;42(5):112299. doi: 10.1016/j.celrep.2023.112299. Epub 2023 Apr 19. Cell Rep. 2023. PMID: 37080202 Free PMC article.
-
Prospective Use of Probiotics to Maintain Astronaut Health during Spaceflight.Life (Basel). 2023 Mar 8;13(3):727. doi: 10.3390/life13030727. Life (Basel). 2023. PMID: 36983881 Free PMC article. Review.
-
Pharmacological Innovations in Space: Challenges and Future Perspectives.Pharm Res. 2024 Nov;41(11):2095-2120. doi: 10.1007/s11095-024-03788-x. Epub 2024 Nov 12. Pharm Res. 2024. PMID: 39532779 Review.
-
Effects of isolation and confinement on gastrointestinal microbiota-a systematic review.Front Nutr. 2023 Jul 10;10:1214016. doi: 10.3389/fnut.2023.1214016. eCollection 2023. Front Nutr. 2023. PMID: 37492598 Free PMC article. Review.
References
-
- Deng Z, Mu J, Tseng M, Wattenberg B, Zhuang X, Egilmez NK, Wang Q, Zhang L, Norris J, Guo H, et al. Enterobacteria-secreted particles induce production of exosome-like S1P-containing particles by intestinal epithelium to drive Th17-mediated tumorigenesis. Nat Commun. 2015;6:6956. doi:10.1038/ncomms7956. - DOI - PMC - PubMed
Publication types
MeSH terms
Substances
LinkOut - more resources
Full Text Sources