

Prevalence and predictors of overweight and obesity in Brazilian immigrants in Massachusetts
- PMID: 31924212
- PMCID: PMC6954574
- DOI: 10.1186/s12889-020-8144-8
Prevalence and predictors of overweight and obesity in Brazilian immigrants in Massachusetts
Abstract
Background: Overweight and obesity are important risk factors for chronic non-communicable diseases, and their prevalence is on the rise worldwide. This study seeks to describe the prevalence and predictors of overweight and obesity in Brazilian immigrants living in Massachusetts, United States of America (USA).
Methods: Modeled after a survey on behavioral risk factors for chronic disease conducted annually in Brazil (Vigilância de Fatores de Risco e Proteção para Doenças Crônicas por Inquérito Telefônico: Vigitel), Brazilian immigrants aged 18+ (n = 361) were surveyed between December 2013 and March 2014. Information was obtained from consenting participants regarding their demographic characteristics, physical activity, dietary and lifestyle habits, and other behavioral risk factors. Weight status was estimated from body mass index (BMI), calculated from self-reported height and weight data. Participants were categorized as overweight/obese if their BMI was ≥25; overweight and obese categories were combined to ensure appropriate sample size. Prevalence of overweight/obesity was estimated using STATA, and significant predictors were identified via multi-variable logistic regression. Odds ratio (OR), 95% confidence intervals (95% CI) and p-values were determined.
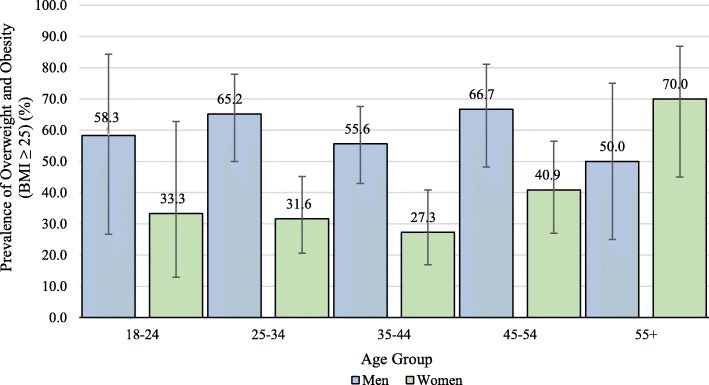
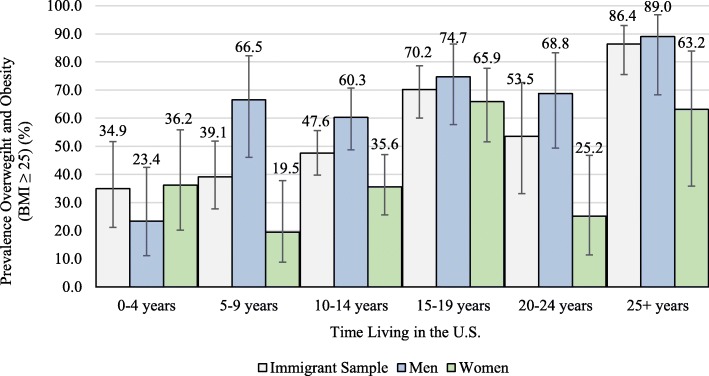
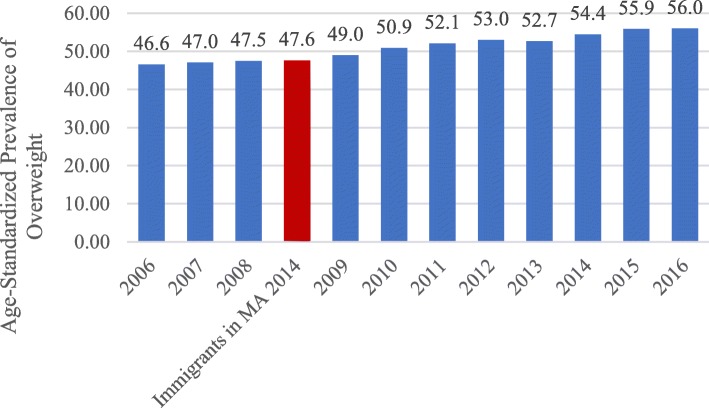
Results: The overall prevalence of overweight/obesity in the sample was 47.6%. Significant predictors of overweight and obesity were gender (men OR 2.30, 95% CI: 1.10, 3.78; women are comparison group), working in the 3 months prior to the survey (OR 2.90, 95% CI: 1.01, 8.30), and longer duration living in the USA (OR per additional year 1.06, 95% CI: 1.02, 1.11). Significant dietary predictors of overweight/obesity included 5 or more days per week of consumption of red meat (OR red meat 3.70, 95% CI: 1.47, 9.26) or of sweetened beverages, like soft drinks also known as soda (OR soda 2.40, 95% CI: 1.00, 5.78) compared with less frequent consumption of these foods.
Conclusions: This study suggests that long duration of time lived in the USA increases odds of overweight and obesity for Brazilian immigrants living in Massachusetts. Efforts to curb increases in overweight and obesity in this population should focus not only on the men and those who work but also the women. Possible intervention measures should target soda (soft drink) and red meat consumption in Brazilian immigrants.
Keywords: Brazilians; Consumption; Fruits; Immigrant health; Meat; Obesity; Overweight; Soda; USA; Vegetables.
Conflict of interest statement
The authors declare that they have no competing interests.
Figures
References
-
- Gakidou E, Afshin A, Abajobir AA, Abate KH, Abbafati C, Abbas KM, et al. Global, regional, and national comparative risk assessment of 84 behavioural, environmental and occupational, and metabolic risks or clusters of risks, 1990-2016: a systematic analysis for the global burden of disease study 2016. Lancet. 2017;390:1345–1422. doi: 10.1016/S0140-6736(17)32366-8. - DOI - PMC - PubMed
-
- Hales CM, Carroll MD, Fryar CD, Ogden CL. Prevalence of obesity among adults and youth: United States, 2015–2016. In: Statistics NCfH: National Center for Health Statistics; 2017. https://www.cdc.gov/nchs/data/databriefs/db288.pdf.
-
- Kennedy S, McDonald JT, Biddle N. The healthy immigrant effect and immigrant selection: evidence from four countries, Citeseer. Social and Economic Dimensions of an Aging Population Research Papers 164. McMaster University 2006. https://ideas.repec.org/p/mcm/sedapp/164.html.
MeSH terms
LinkOut - more resources
Full Text Sources
Medical
