

Identifying clinical subgroups in IgG4-related disease patients using cluster analysis and IgG4-RD composite score
- PMID: 31924265
- PMCID: PMC6954570
- DOI: 10.1186/s13075-019-2090-9
Identifying clinical subgroups in IgG4-related disease patients using cluster analysis and IgG4-RD composite score
Abstract
Background: To explore the clinical patterns of patients with IgG4-related disease (IgG4-RD) based on laboratory tests and the number of organs involved.
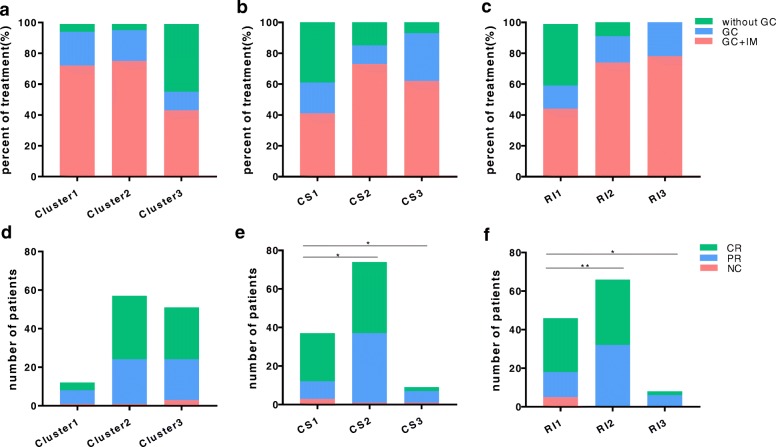
Methods: Twenty-two baseline variables were obtained from 154 patients with IgG4-RD. Based on principal component analysis (PCA), patients with IgG4-RD were classified into different subgroups using cluster analysis. Additionally, IgG4-RD composite score (IgG4-RD CS) as a comprehensive score was calculated for each patient by principal component evaluation. Multiple linear regression was used to establish the "IgG4-RD CS" prediction model for the comprehensive assessment of IgG4-RD. To evaluate the value of the IgG4-RD CS in the assessment of disease severity, patients in different IgG4-RD CS groups and in different IgG4-RD responder index (RI) groups were compared.
Results: PCA indicated that the 22 baseline variables of IgG4-RD patients mainly consisted of inflammation, high serum IgG4, multi-organ involvement, and allergy-related phenotypes. Cluster analysis classified patients into three groups: cluster 1, inflammation and immunoglobulin-dominant group; cluster 2, internal organs-dominant group; and cluster 3, inflammation and immunoglobulin-low with superficial organs-dominant group. Moreover, there were significant differences in serum and clinical characteristics among subgroups based on the CS and RI scores. IgG4-RD CS had a similar ability to assess disease severity as RI. The "IgG4-RD CS" prediction model was established using four independent variables including lymphocyte count, eosinophil count, IgG levels, and the total number of involved organs.
Conclusion: Our study indicated that newly diagnosed IgG4-RD patients could be divided into three subgroups. We also showed that the IgG4-RD CS had the potential to be complementary to the RI score, which can help assess disease severity.
Keywords: Cluster analysis; IgG4-RD CS; IgG4-related disease; Laboratory test; Organs involved.
Conflict of interest statement
The authors declare that they have no competing interests.
Figures


Similar articles
-
Phenotyping of IgG4-related diseases based on affected organ pattern: A multicenter cohort study using cluster analysis.Mod Rheumatol. 2021 Jan;31(1):235-240. doi: 10.1080/14397595.2019.1703522. Epub 2020 Jan 4. Mod Rheumatol. 2021. PMID: 31902317
-
[The clinical characteristics of 346 patients with IgG4-related disease].Zhonghua Nei Ke Za Zhi. 2017 Sep 1;56(9):644-649. doi: 10.3760/cma.j.issn.0578-1426.2017.09.005. Zhonghua Nei Ke Za Zhi. 2017. PMID: 28870031 Chinese.
-
Elevated eosinophil-to-lymphocyte ratio (ELR) as a predictor of relapse for IgG4-related disease: a retrospective study across a decade.Clin Exp Med. 2025 Jun 9;25(1):193. doi: 10.1007/s10238-025-01741-9. Clin Exp Med. 2025. PMID: 40488799 Free PMC article.
-
IgG4-related disease: How to place it in the spectrum of immune-mediated and rheumatologic disorders?Mod Rheumatol. 2020 Jul;30(4):609-616. doi: 10.1080/14397595.2019.1705537. Epub 2020 Jan 4. Mod Rheumatol. 2020. PMID: 31852351 Review.
-
Immunoglobulin G4-related hepatobiliary disease.Semin Diagn Pathol. 2019 Nov;36(6):423-433. doi: 10.1053/j.semdp.2019.07.007. Epub 2019 Jul 24. Semin Diagn Pathol. 2019. PMID: 31358425 Review.
Cited by
-
Correlation between serologic parameters and disease activity of IgG4-related disease: Differences between patients with normal and elevated serum IgG4 concentrations.Front Immunol. 2022 Oct 12;13:1020459. doi: 10.3389/fimmu.2022.1020459. eCollection 2022. Front Immunol. 2022. PMID: 36311699 Free PMC article.
-
Implication of allergy and atopy in IgG4-related disease.World Allergy Organ J. 2023 Apr 17;16(4):100765. doi: 10.1016/j.waojou.2023.100765. eCollection 2023 Apr. World Allergy Organ J. 2023. PMID: 37179536 Free PMC article. Review.
-
Peripheral B-Cell Immunophenotyping Identifies Heterogeneity in IgG4-Related Disease.Front Immunol. 2021 Sep 17;12:747076. doi: 10.3389/fimmu.2021.747076. eCollection 2021. Front Immunol. 2021. PMID: 34603334 Free PMC article.
-
Longitudinal analysis of symptom-based clustering in patients with primary Sjogren's syndrome: a prospective cohort study with a 5-year follow-up period.J Transl Med. 2021 Sep 19;19(1):394. doi: 10.1186/s12967-021-03051-6. J Transl Med. 2021. PMID: 34538269 Free PMC article.
-
Retroperitoneal fibrosis, a rare entity with urorenal and vascular subtypes - preliminary data.Ren Fail. 2022 Dec;44(1):688-692. doi: 10.1080/0886022X.2022.2064303. Ren Fail. 2022. PMID: 35440292 Free PMC article.
References
-
- Kamisawa T, Zen Y, Pillai S, Stone JH. IgG4-related disease. Lancet. 2015;385(9976):1460–1471. - PubMed
-
- Brito-Zerón P, Bosch X, Ramos-Casals M, Stone JH. IgG4-related disease: advances in the diagnosis and treatment. Best Pract Res Clin Rheumatol. 2016;30(2):261–278. - PubMed
-
- Umehara H, Okazaki K, Masaki Y, Kawano M, Yamamoto M, Saeki T, et al. Comprehensive diagnostic criteria for IgG4-related disease (IgG4-RD), 2011. Mod Rheumatol. 2012;22(1):21–30. - PubMed
Publication types
MeSH terms
LinkOut - more resources
Full Text Sources
Miscellaneous
