. 2020 Feb 18;52(2):295-312.e11.
doi: 10.1016/j.immuni.2019.12.002. Epub 2020 Jan 7.

Precursors for Nonlymphoid-Tissue Treg Cells Reside in Secondary Lymphoid Organs and Are Programmed by the Transcription Factor BATF

Affiliations

Precursors for Nonlymphoid-Tissue Treg Cells Reside in Secondary Lymphoid Organs and Are Programmed by the Transcription Factor BATF

Michael Delacher et al. Immunity. .

Abstract

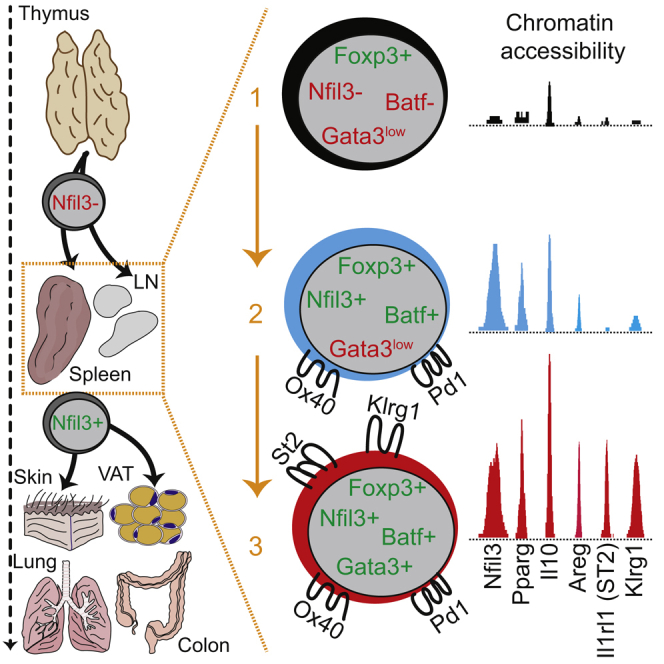
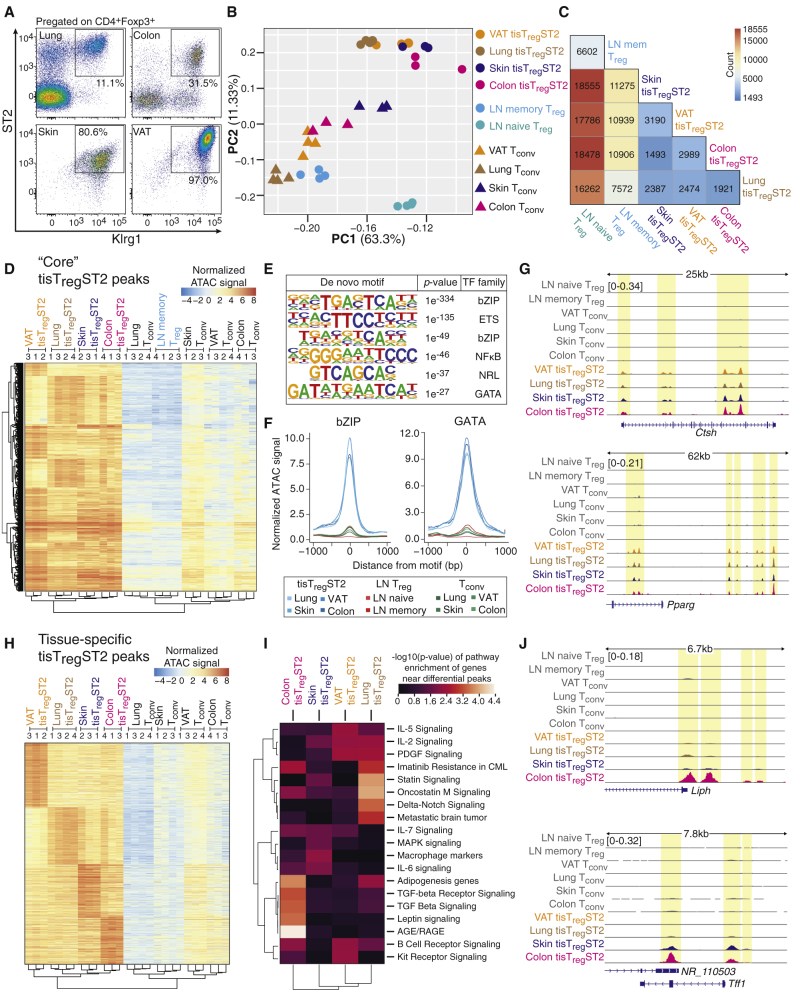
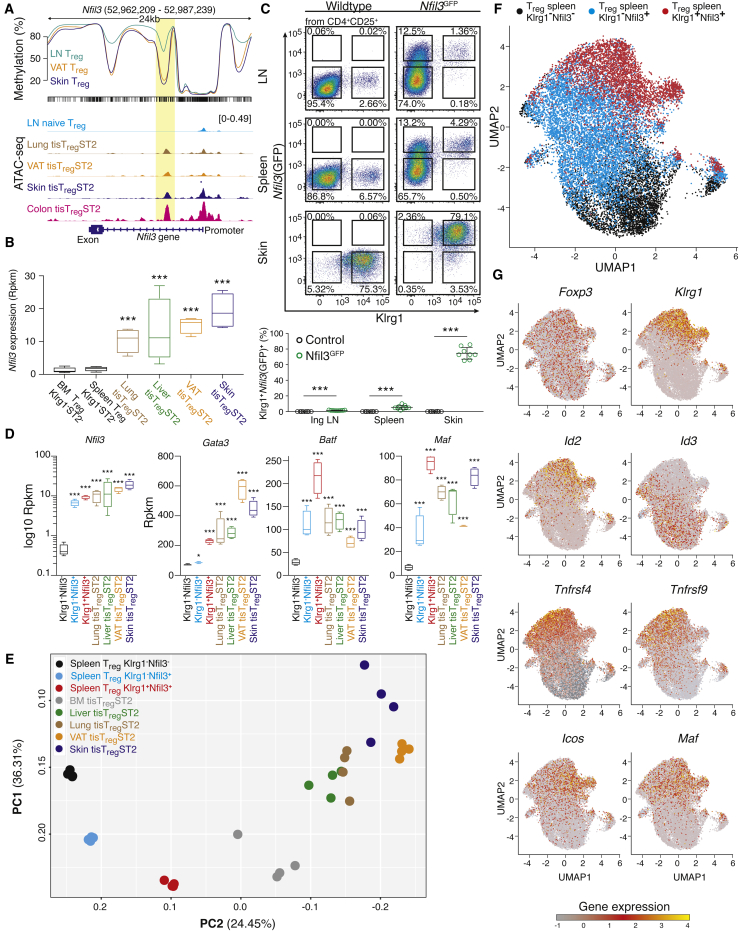
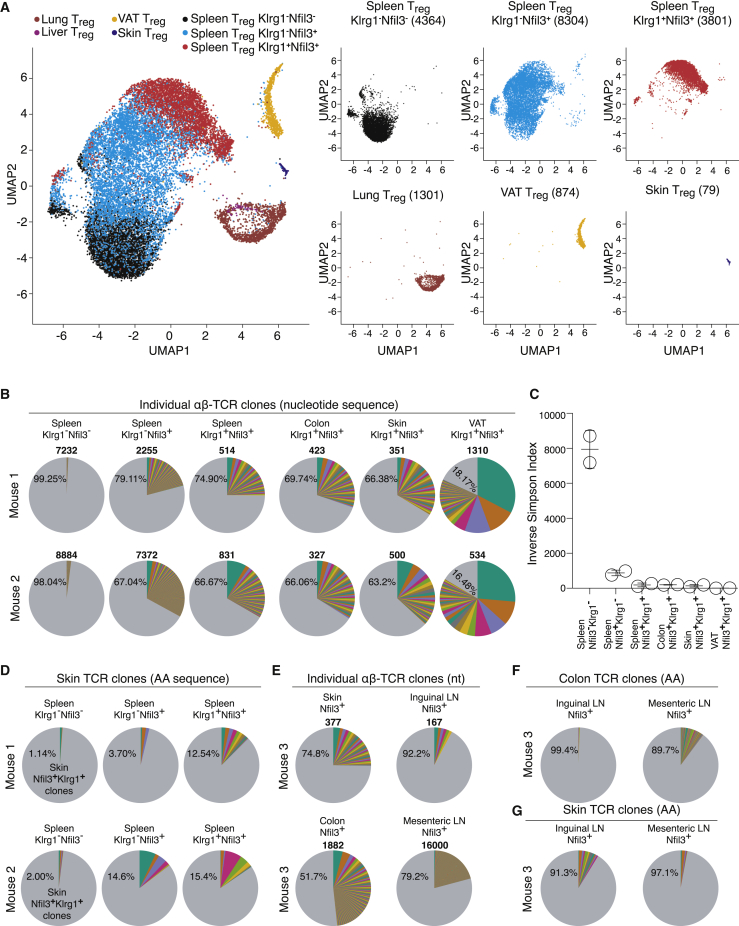
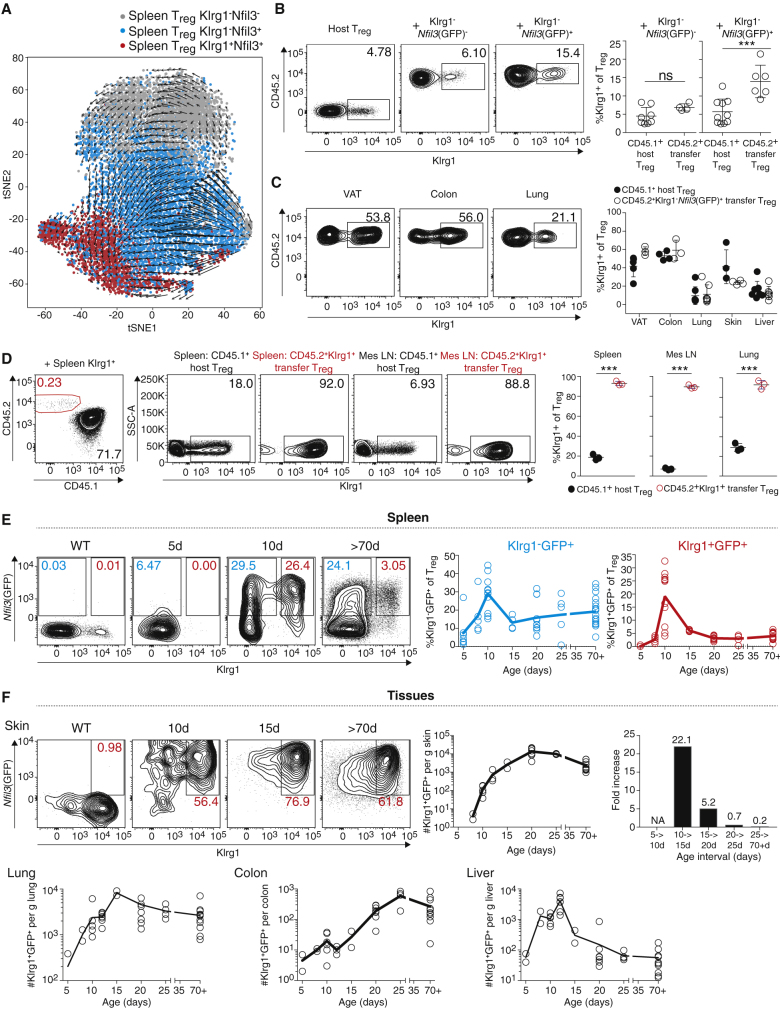
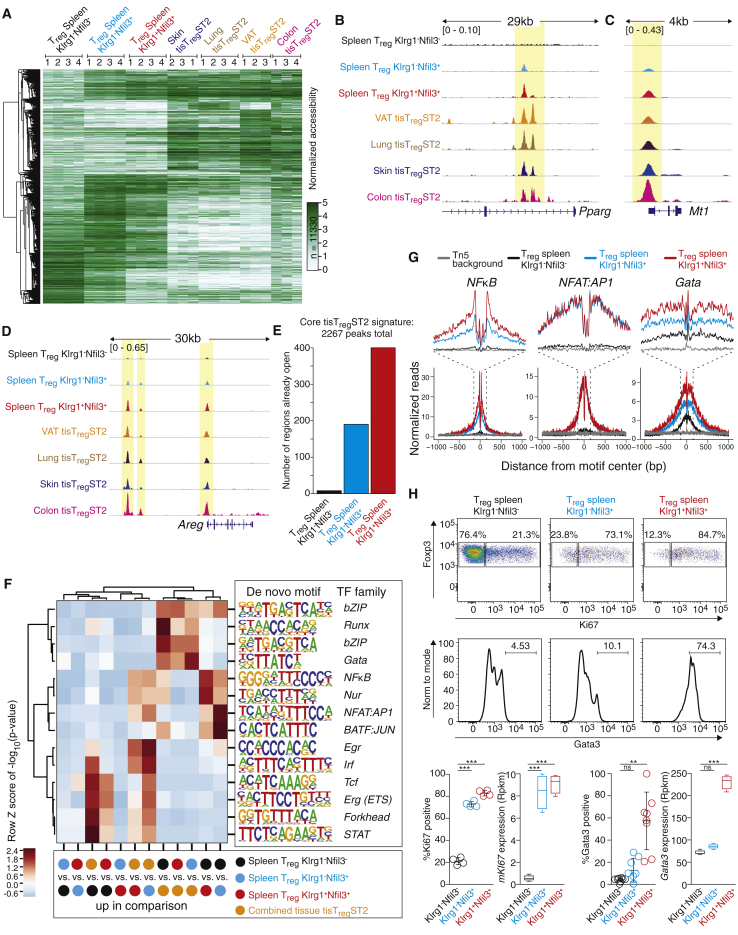
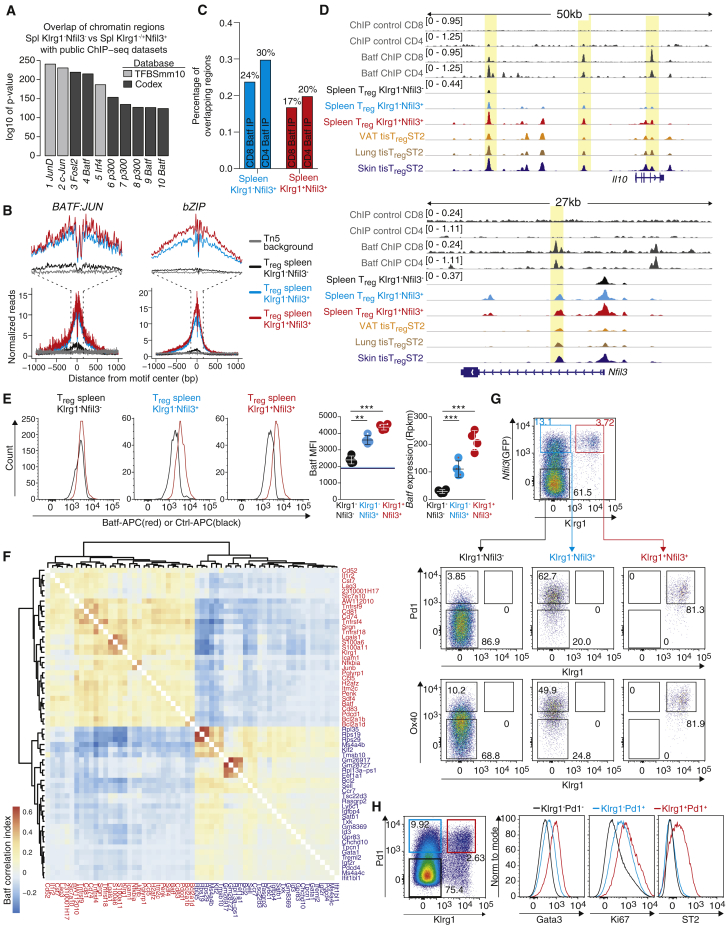
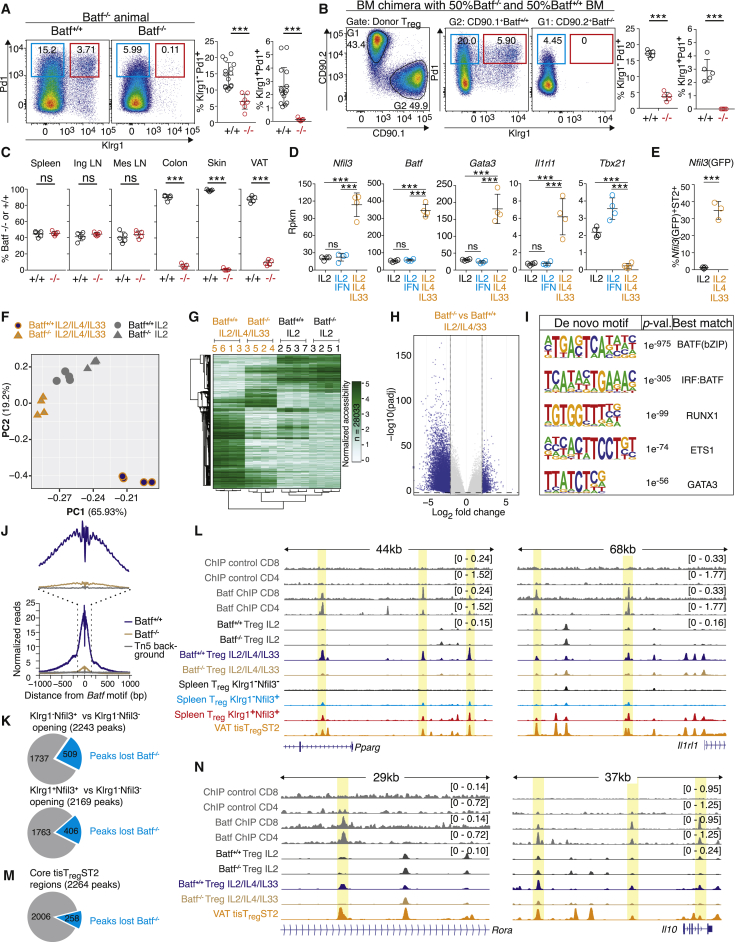
Specialized regulatory T (Treg) cells accumulate and perform homeostatic and regenerative functions in nonlymphoid tissues. Whether common precursors for nonlymphoid-tissue Treg cells exist and how they differentiate remain elusive. Using transcription factor nuclear factor, interleukin 3 regulated (Nfil3) reporter mice and single-cell RNA-sequencing (scRNA-seq), we identified two precursor stages of interleukin 33 (IL-33) receptor ST2-expressing nonlymphoid tissue Treg cells, which resided in the spleen and lymph nodes. Global chromatin profiling of nonlymphoid tissue Treg cells and the two precursor stages revealed a stepwise acquisition of chromatin accessibility and reprogramming toward the nonlymphoid-tissue Treg cell phenotype. Mechanistically, we identified and validated the transcription factor Batf as the driver of the molecular tissue program in the precursors. Understanding this tissue development program will help to harness regenerative properties of tissue Treg cells for therapy.

Keywords: ATAC-seq; Areg; Batf; Foxp3; Gata3; Nfil3; precursor; scRNA-seq; scTCR-seq; tissue Treg.


Conflict of interest statement

Declaration of Interests The authors declare no competing financial interests.

Figures

None
Graphical abstract
Figure 1
Figure 1
ATAC-Seq of Tissue-Derived T Cells Identifies a Common Gene-Regulatory Program (A) Presence of Klrg1+ST2+ tisTregST2 among Treg cells of lung, colon, skin, and VAT (representative example). (B) Principal component analysis (PCA) based on a consensus set of 78,461 peaks derived from ATAC-seq data of FACS-sorted lymph node (LN)-derived CD25+Foxp3(GFP)+CD44 naive Treg (turquoise), LN-derived CD25+Foxp3(GFP)+CD44+ memory Treg (blue-green) as well as colon-, lung-, VAT-, and skin-derived CD25+Foxp3(GFP)+CD44+Klrg1+ST2+ tisTregST2 or CD25Foxp3(GFP)CD44+ memory Tconv (pink, brown, orange, and dark blue) (n = 3–4). (C) Pairwise comparisons of ATAC-seq data between all cell types shown in (B) except Tconv, numbers indicate differential peak sets (Benjamini-Hochberg corrected adjusted p value <0.01, log2 fold change >2, normalized mean accessibility ≥10), color code indicates number of differential peaks (n = 3–4). (D) Unsupervised hierarchical clustering of the 2,267 “core” tisTregST2 ATAC-seq peaks with accessibility values of all cell types shown in (B), tissue Tconv signature subtracted (n = 3–4). (E) De novo transcription factor (TF) motifs identified in the “core” tisTregST2-signature (n = 3–4). (F) Normalized ATAC-seq signal from different cell types at “core” ATAC-seq peaks carrying a bZIP or GATA binding motif, respectively (n = 3–4). (G) ATAC-seq data for the Ctsh and Pparg loci with all cell types shown in (B). All datasets group-normalized to maximum peak height indicated in brackets. (H) Unsupervised hierarchical clustering of 1,345 ATAC peaks from pairwise comparisons of tisTregST2 populations from VAT, lung, skin, and colon (n = 3–4). (I) Pathway enrichment of genes near differential peaks for tisTregST2 from different tissues (database: WikiPathways 2016). (J) ATAC-seq data for the Liph and Tff1 loci as in (G) (n = 3–4). Data representative of independent experiments or cell sorts. See also Figure S1 and Table S1.
Figure 2
Figure 2
Identification and Characterization of a Spleen tisTregST2 Precursor (A) CG-methylation of the Nfil3 gene based on whole-genome bisulfite methylation data derived from a previous publication (Delacher et al., 2017) for LN Treg (turquoise), VAT Treg (orange), and skin Treg (blue). Ticks represent CpG sites. Below, ATAC-seq for LN-derived naive CD44Klrg1ST2 Treg (light blue) and lung-, VAT-, skin-, and colon-derived CD44+Klrg1+ST2+ tisTregST2 (dark brown, orange, dark blue, purple) (n = 3–4). (B) Nfil3 gene expression in bone marrow (BM) and spleen-derived Klrg1ST2 Treg (black) as well as lung-, liver-, VAT-, and skin-derived Klrg1+ST2+ tisTregST2 (brown, green, orange, and dark blue). Statistics based on Deseq2. ∗∗∗p < 0.001, ∗∗p < 0.01, p < 0.01 and nsp > 0.05. Error bars indicate mean + SD (n = 4). (C) Expression of GFP in Nfil3(GFP) reporter mice. Shown at the top is staining of inguinal LN Treg (CD4+TCRβ+CD25+) from control B6 animals or Nfil3(GFP) reporter mice. Show at the bottom is staining of spleen (middle) and skin (bottom) Treg. Percentage of Klrg1+Nfil3(GFP)+ of CD25+ below (unpaired t test, n = 8–9). (D) RNA-seq expression data of Nfil3, Gata3, Batf, and Maf in Klrg1Nfil3(GFP), Klrg1Nfil3(GFP)+, and Klrg1+Nfil3(GFP)+ spleen Treg, and lung, liver, VAT, and skin Klrg1+ST2+ Treg (Deseq2, n = 4). (E) PCA based on 1,000 most variable genes derived from RNA-seq data of spleen Klrg1Nfil3(GFP) Treg (black), Klrg1Nfil3(GFP)+ Treg (light blue), and Klrg1+Nfil3(GFP)+ Treg (red) as well as BM-, liver-, lung-, VAT-, and skin-derived tisTregST2 (gray, green, brown, orange, dark blue) (n = 4). (F) Uniform manifold approximation and projection (UMAP) of scRNA-seq data of spleen-derived Treg cell (CD4+TCRβ+CD25+) subpopulations: Klrg1Nfil3(GFP) in black, Klrg1Nfil3(GFP)+ in blue, and Klrg1+Nfil3(GFP)+ in red. Scaled expression values were clipped at a value of 4 (n = 5). (G) UMAP plots as in (F). Color code displays gene expression of Foxp3, Klrg1, Id2, Id3, Tnfrsf4, Tnfrsf9, Icos, and Maf with gray = low and red/yellow = high expression (n = 5). Data representative of independent experiments or cell sorts. See also Figures S2 and S3 and Tables S2 and S3.
Figure 3
Figure 3
Single-Cell RNA-Seq and TCR-Seq of Tissue Memory Treg Cells (A) UMAP from scRNA-seq data of spleen Klrg1Nfil3(GFP) Treg, spleen Klrg1Nfil3(GFP)+ Treg, and spleen Klrg1+Nfil3(GFP)+ Treg as well as VAT, skin, lung, and liver memory Treg (CD4+TCRβ+CD44+CD25+Foxp3(GFP)+). Number in brackets displays total number of single cells per group. Scaled expression values were clipped at a value of 4 (n = 4–11). (B) Data derived from single-cell T cell receptor sequencing (scTCR-seq) of spleen Klrg1Nfil3(GFP) Treg, spleen Klrg1Nfil3(GFP)+ Treg, and spleen Klrg1+Nfil3(GFP)+ Treg as well as colon-, skin-, and VAT-derived Klrg1+Nfil3(GFP)+ tisTregST2 from two individual mice in separate experiments. Individual clones are shown in separate colors with percentages indicating frequency. Numbers indicate total numbers of cells with successfully paired TCR α+β chains (n = 2). (C) Inverse Simpson index of scTCR-seq data from (B) (n = 2). (D) Tracking of skin TCR clones in spleen Klrg1Nfil3(GFP) Treg and spleen Klrg1Nfil3(GFP)+ Treg as well as spleen Klrg1+Nfil3(GFP)+ Treg from two mice based on AA sequence of the TCR, plotted are skin clones (n = 2). (E) Data derived from scTCR-seq of skin Nfil3(GFP)+ Treg, skin-draining LN Nfil3(GFP)+ Treg, colon Nfil3(GFP)+ Treg, as well as colon-draining LN Nfil3(GFP)+ Treg as in (B) (n = 2). (F) Tracking of colon Nfil3(GFP)+ Treg TCR clones in skin-draining inguinal LN or colon-draining mesenteric LN Nfil3(GFP)+ Treg based on AA sequence of the TCR as in (D), plotted are colon clones (n = 1). (G) Tracking of skin Nfil3(GFP)+ Treg TCR clones in inguinal or mesenteric LN Nfil3(GFP)+ Treg based on AA sequence of the TCR as in (F), plotted are skin clones (n = 1). Data representative of independent experiments or cell sorts. See also Figure S3 and Table S3.
Figure 4
Figure 4
Adoptive Transfer and Development Kinetics of Nfil3(GFP) Populations (A) T-distributed stochastic neighbor embedding (t-SNE) plot with RNA velocity of spleen-derived Klrg1Nfil3(GFP) Treg, Klrg1Nfil3(GFP)+ Treg, and Klrg1+Nfil3(GFP)+ Treg. Arrows represent the averaged gene expression profiles of cells within a local neighborhood. Length of arrow represents speed of development (n = 5). (B) Klrg1Nfil3(GFP) and Klrg1Nfil3(GFP)+ Treg from CD45.2+ donor animals were sorted and transferred into diphtheria toxin (DT)-pretreated Foxp3YFP,DTR,CD45.1 recipient animals. After 6 days, transferred Treg in spleen were identified as CD45.2+ population. Plots illustrate expression of Klrg1 in CD45.1+ host Treg or CD45.2+ transferred Treg (unpaired t test, n = 4–10). (C) Identification of transferred Treg in tissues of recipient animals 10 days after transfer of spleen-derived CD45.2+Klrg1Nfil3(GFP)+ Treg (n = 4–7). (D) Transfer of CD45.2+Klrg1+ Treg from spleen into DT-pretreated Foxp3YFP,DTR,CD45.1 recipient animals as in (C). After 2 weeks, transferred cells were identified and stability of Klrg1 expression was measured (mes LN, mesenteric LN; paired t test, n = 3–4). (E) Percentage of Klrg1Nfil3(GFP)+ (light blue) and Klrg1+Nfil3(GFP)+ Treg (red) in spleen Treg (CD4+TCRβ+CD25+) measured 5 days, 8 days, 10 days, 15 days, 20 days, 25 days, and 70+ days after birth (n = 4–19). (F) Total number of skin, lung, colon, and liver Klrg1+Nfil3(GFP)+ Treg 5 days, 8 days, 10 days, 12 days, 15 days, 20 days, 25 days, and 70+ days after birth. For all tissues, total cell numbers were normalized to tissue weight. For skin data, Treg cell fold increase was calculated by dividing cell numbers on different time intervals (shown right). Flow cytometry data of several replicates were concatenated to increase visibility (n = 2–11). Data representative of two or more independent experiments. See also Figure S4 and Table S4.
Figure 5
Figure 5
Core tisTregST2 Signature in Nfil3(GFP) Populations (A) Heatmap across all 11,330 differential ATAC-seq peaks from pairwise comparisons of FACS-sorted spleen-derived Klrg1Nfil3(GFP) Treg, spleen Klrg1Nfil3(GFP)+ Treg, spleen Klrg1+Nfil3(GFP)+ Treg, and tisTregST2 samples consisting of skin-, lung-, VAT-, or colon-derived tisTregST2 (n = 3–4). (B) ATAC-seq data for the Pparg locus with all cell types shown in (A). All datasets group-normalized to maximum peak height indicated in brackets (n = 3–4). (C) ATAC-seq data for the Mt1 locus with all cell types shown in (A). All datasets group-normalized to maximum peak height indicated in brackets (n = 3–4). (D) ATAC-seq data for the Areg locus with all cell types shown in (A). All datasets group-normalized to maximum peak height indicated in brackets (n = 3–4). (E) Overlap of core tisTregST2 peaks with ATAC-seq peaks identified in spleen Klrg1Nfil3(GFP) Treg (black), spleen Klrg1Nfil3(GFP)+ Treg (light blue), and spleen Klrg1+Nfil3(GFP)+ Treg (red) (n = 4). (F) Motif analysis with individual comparisons between spleen Klrg1Nfil3(GFP) Treg (black), spleen Klrg1Nfil3(GFP)+ Treg (light blue), spleen Klrg1+Nfil3(GFP)+ Treg (red), or the core tisTregST2 signature (orange) (n = 3–4). (G) Single-base-pair resolution ATAC-seq signal at motif-centered peaks containing the de novo discovered motifs of NF-κB, NFAT:AP1, and Gata family members from (F) in spleen Klrg1Nfil3(GFP) (black), Klrg1Nfil3(GFP)+ (light blue), or spleen Klrg1+Nfil3(GFP)+ Treg (red). Transposase background signal (Tn5 background) shown in gray (n = 4). (H) Ki67 (representative pseudocolor plots) and Gata3 (representative histograms) staining in spleen Klrg1Nfil3(GFP), Klrg1Nfil3(GFP)+, or spleen Klrg1+Nfil3(GFP)+ Treg (one-way ANOVA; Ki67 or Gata3 RNA: n = 4; Ki67 or Gata3 protein: n = 4–8). Data are representative of two or more independent experiments or cell sorts. See also Figure S5 and Table S5.
Figure 6
Figure 6
Batf Is Associated in Nfil3(GFP) Precursor Populations (A) Overlap of chromatin regions differentially opened in spleen Klrg1Nfil3(GFP) versus spleen Klrg1−/+Nfil3(GFP)+ Treg with public ChIP-seq datasets identified by LOLA (Sheffield and Bock, 2016) (n = 4). (B) Single-base-pair resolution ATAC-seq signal at motif-centered peaks containing the de novo discovered motifs of BATF:JUN and bZIP family members (discovered in Figure 5F) in spleen Klrg1Nfil3(GFP) (black), Klrg1Nfil3(GFP)+ (light blue), or spleen Klrg1+Nfil3(GFP)+ Treg (red). Transposase background signals (Tn5 background) shown in gray (n = 4). (C) Chromatin regions differentially opened in spleen Klrg1Nfil3(GFP) versus Klrg1Nfil3(GFP)+ (light blue) or Klrg1Nfil3(GFP) versus Klrg1+Nfil3(GFP)+ Treg (red) were correlated with peaks identified in public CD8 or CD4 Batf ChIP-seq datasets (Hasan et al., 2017, Kurachi et al., 2014) (n = 4). (D) ATAC-seq data for the Il10 and Nfil3 gene and associated promoter region for spleen Klrg1Nfil3(GFP) (black), spleen Klrg1Nfil3(GFP)+ (light blue), spleen Klrg1+Nfil3(GFP)+ (red), and VAT, lung, and skin tisTregST2 (orange, brown, dark blue). Top 4 lanes show public Batf ChIP-seq for CD4 or CD8 T cells with antibody control data (dark gray). All Treg ATAC-seq datasets group-normalized to maximum peak height indicated in brackets, ChIP-seq datasets group-normalized with respective control (n = 4). (E) Batf protein and RNA expression in spleen Klrg1Nfil3(GFP), Klrg1Nfil3(GFP)+, or Klrg1+Nfil3(GFP)+ Treg (Batf-antibody [red] or isotype control antibody [black]). Histograms concatenated (one-way ANOVA, n = 4). (F) Clustermap illustrating the Batf Pearson correlation index based on single-cell data from spleen Klrg1Nfil3(GFP), Klrg1Nfil3(GFP)+, and Klrg1+Nfil3(GFP)+ Treg cells across 30 Batf positively correlated genes (red gene names) as well as 30 Batf anti-correlated genes (blue) (n = 4). (G) Spleen Klrg1Nfil3(GFP) (black), Klrg1Nfil3(GFP)+ (light blue), or Klrg1+Nfil3(GFP)+ Treg cells (red) were pre-gated and expression of Pd1 versus Klrg1 (upper graphs) and Ox40 versus Klrg1 (lower graphs) is displayed. Representative example shown. (H) Gata3 and Ki67 staining in Spleen Klrg1Pd1 (black), Klrg1Pd1+ (light blue), or Klrg1+Pd1+ Treg (red) (representative example shown). Data representative of independent experiments or cell sorts.
Figure 7
Figure 7
Batf Is a Lineage-Defining TF in Nfil3(GFP) Precursors (A) Measurement of Klrg1Pd1+ Treg (light blue) and Klrg1+Pd1+ Treg (red) in spleens of Batf+/+ versus Batf−/− animals (unpaired t test, n = 7–15). (B) Measurement of Klrg1Pd1+ Treg (light blue) and Klrg1+Pd1+ Treg (red) in spleens of animals reconstituted with 50% CD90.1+CD90.2Batf+/+ and 50% CD90.1CD90.2+Batf−/− bone marrow 6 weeks after bone marrow transfer (unpaired t test, n = 5). (C) Analysis of Treg in mixed bone marrow chimera as in (B). Contribution of Batf+/+ (black) or Batf−/− (red) bone marrow in Treg from spleen, inguinal LN (ing LN), mesenteric LN (mes LN), colon, skin, or VAT is shown (unpaired t test, n = 5). (D) Spleen Treg were treated for 6 days in vitro with anti-CD3/28 beads and IL-2 (Ctrl, black), IL-2 plus IFN-γ (IFNγ, blue), or IL-2 plus IL-4 and IL-33 (IL4/33, orange) followed by gene expression analysis. Graphs illustrate expression of Nfil3, Batf, Gata3, Il1rl1, or Tbx21 (Deseq2, n = 4). (E) Spleen Treg from Nfil3(GFP) animals were treated for 6 days in vitro with anti-CD3/CD28 beads and IL-2 (Ctrl, black) or IL-2 plus IL-4 and IL-33 (IL4/33, orange) followed by flow-cytometry-based measurement of GFP (unpaired t test, n = 4). (F) Spleen Treg from Batf+/+ or Batf−/− animals were treated for 6 days in vitro as in (D), followed by ATAC-seq. PCA based on ATAC-seq reads in all samples over a consensus set of 105,243 peaks (n = 4). (G) Unsupervised hierarchical clustering of ATAC-seq data (28,033 unique differential peaks) with all cell types shown in (F) (n = 4). (H) Comparison of chromatin accessibility between Batf+/+ and Batf−/− Treg treated with IL-4 and IL-33. Significant regions (log2 fold change >2, normalized mean accessibility ≥10, adjusted p value <0.01) are colored in blue (n = 4). (I) De novo motif analysis on significant peak sets derived from (H) (n = 4). (J) Single-base-pair resolution ATAC-seq signal at motif-centered peaks containing the de novo discovered motif highly similar to the known Batf motif (discovered in I) in IL-2-, IL-4-, and IL-33-treated Batf−/− versus Batf+/+ Treg. Transposase background shown in gray (n = 4). (K) Pie chart illustrating the overlap of peaks that are differentially opened in Klrg1Nfil3(GFP) versus Klrg1+Nfil3(GFP)+ Treg (top) or Klrg1Nfil3(GFP) versus Klrg1Nfil3(GFP)+ Treg (bottom) with Batf-dependent peaks identified in (H) (n = 4). (L) ATAC-seq data for the Il1rl1 and Pparg gene and associated promoter region for in vitro-treated Batf−/− versus Batf+/+ Treg (color), spleen Klrg1Nfil3(GFP) (black), Klrg1Nfil3(GFP)+ (light blue), Klrg1+Nfil3(GFP)+ (red), or VAT tisTregST2 (orange). Top 4 lanes are public Batf ChIP-seq data for CD4 or CD8 T cells including antibody control data (dark gray). All Treg ATAC-seq datasets group-normalized to maximum peak height indicated in brackets, ChIP-seq datasets group-normalized with respective control (n = 4). (M) Pie chart illustrating the overlap of the “core” tisTregST2 peaks with Batf-dependent peaks identified in (H) (n = 4). (N) ATAC-seq data for the Rora and IL10 loci for in vitro-treated Batf−/− versus Batf+/+ Treg as in (M) (n = 4). Data representative of independent experiments or cell sorts. See also Figures S6 and S7 and Tables S6 and S7.

References

    1. Ali N., Zirak B., Rodriguez R.S., Pauli M.L., Truong H.A., Lai K., Ahn R., Corbin K., Lowe M.M., Scharschmidt T.C. Regulatory T Cells in Skin Facilitate Epithelial Stem Cell Differentiation. Cell. 2017;169:1119–1129. - PMC - PubMed
    1. Arpaia N., Green J.A., Moltedo B., Arvey A., Hemmers S., Yuan S., Treuting P.M., Rudensky A.Y. A Distinct Function of Regulatory T Cells in Tissue Protection. Cell. 2015;162:1078–1089. - PMC - PubMed
    1. Bao K., Carr T., Wu J., Barclay W., Jin J., Ciofani M., Reinhardt R.L. BATF Modulates the Th2 Locus Control Region and Regulates CD4+ T Cell Fate during Antihelminth Immunity. J. Immunol. 2016;197:4371–4381. - PMC - PubMed
    1. Bluestone J.A., Tang Q. Treg cells-the next frontier of cell therapy. Science. 2018;362:154–155. - PubMed
    1. Brunkow M.E., Jeffery E.W., Hjerrild K.A., Paeper B., Clark L.B., Yasayko S.A., Wilkinson J.E., Galas D., Ziegler S.F., Ramsdell F. Disruption of a new forkhead/winged-helix protein, scurfin, results in the fatal lymphoproliferative disorder of the scurfy mouse. Nat. Genet. 2001;27:68–73. - PubMed

Publication types

MeSH terms