. 2020 Jan 10;11(1):221.
doi: 10.1038/s41467-019-13938-0.

Inhibition within a premotor circuit controls the timing of vocal turn-taking in zebra finches

Affiliations

Inhibition within a premotor circuit controls the timing of vocal turn-taking in zebra finches

Jonathan I Benichov et al. Nat Commun. .

Abstract

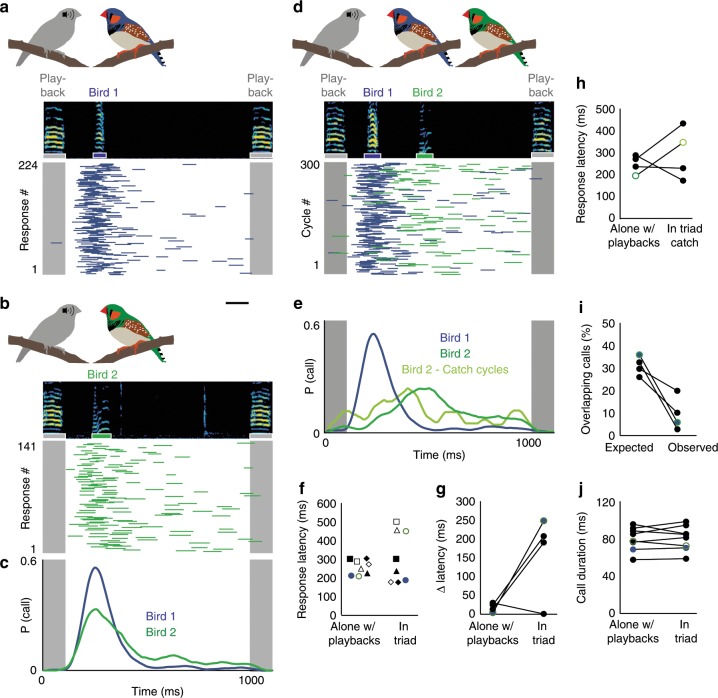
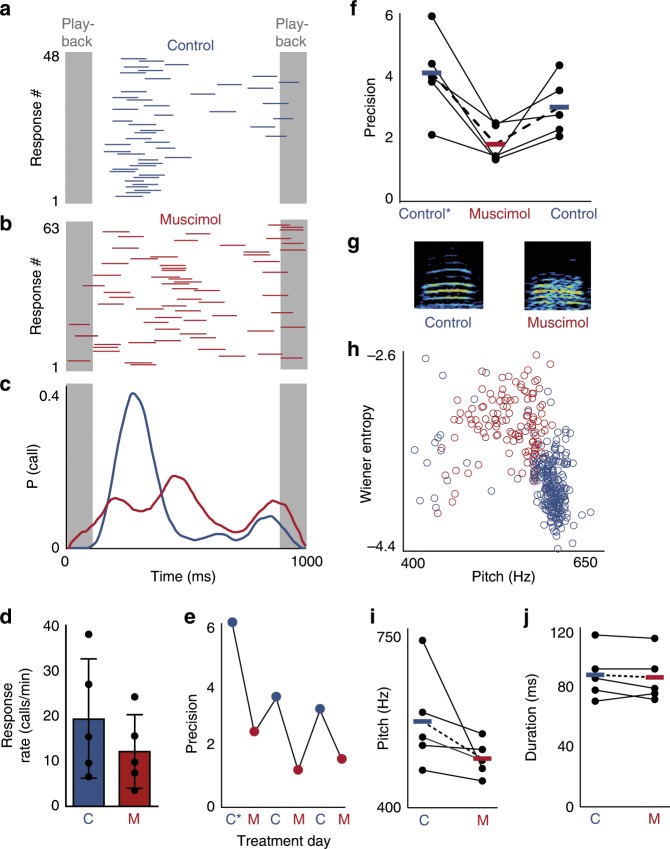
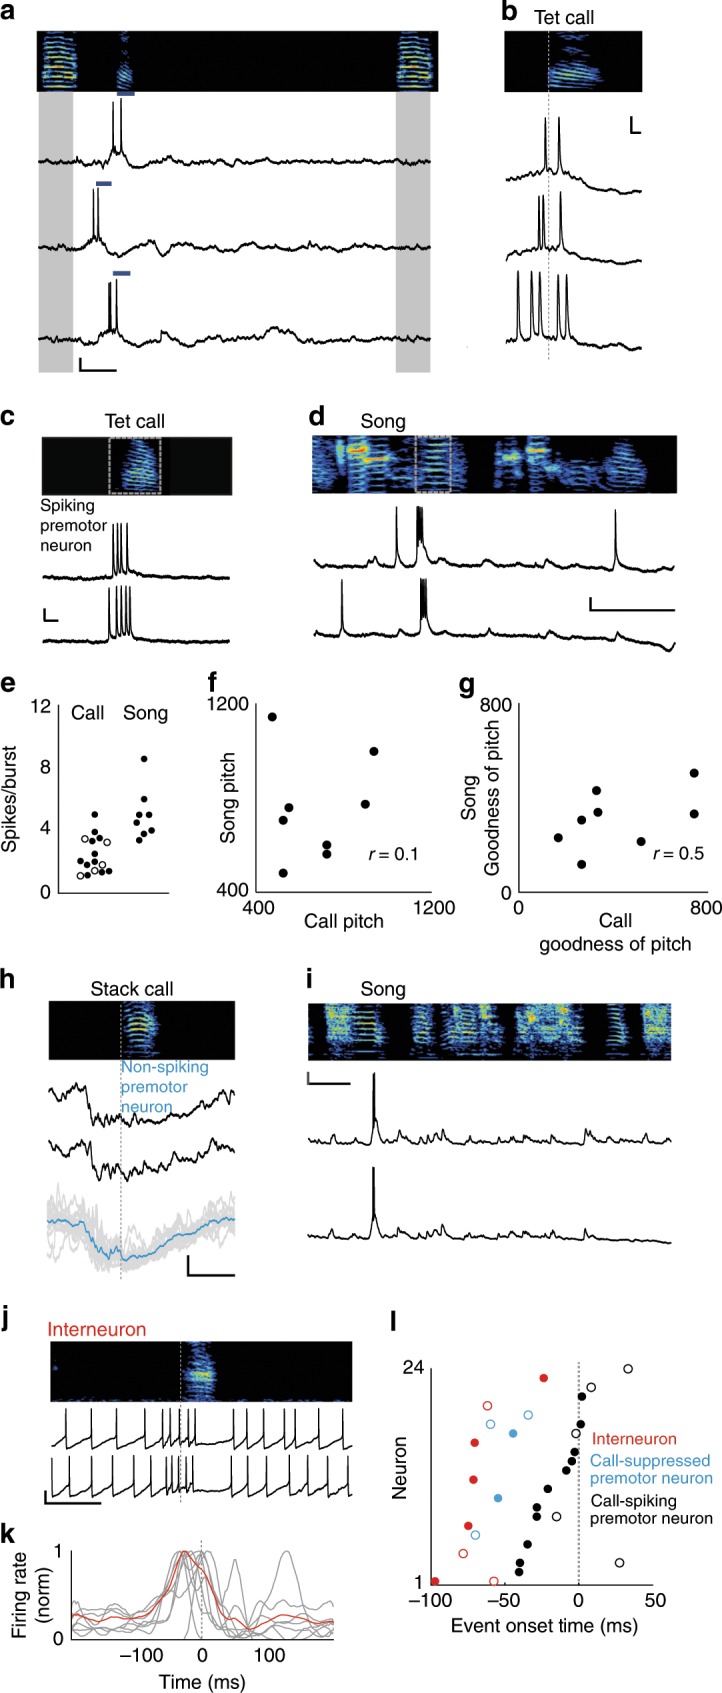
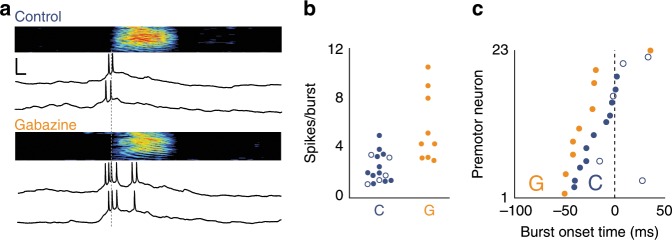
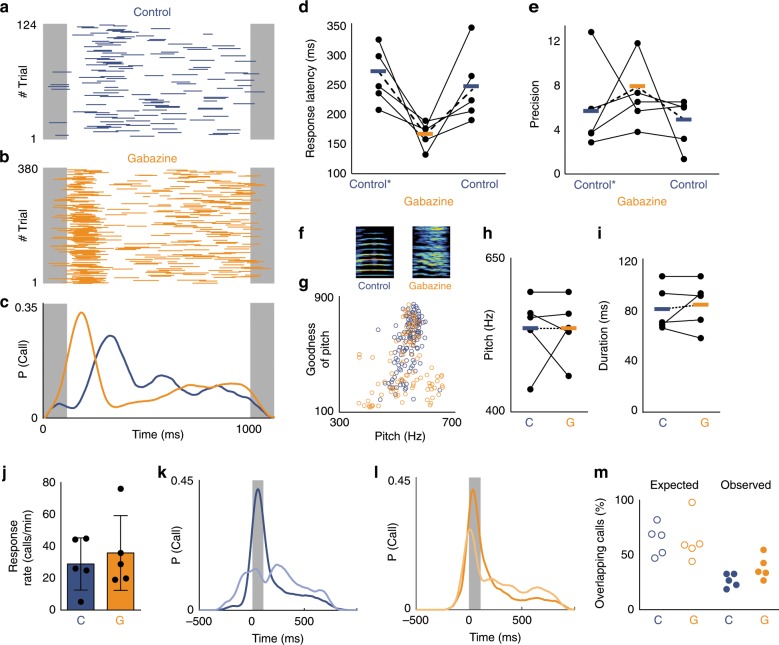
Vocal turn-taking is a fundamental organizing principle of human conversation but the neural circuit mechanisms that structure coordinated vocal interactions are unknown. The ability to exchange vocalizations in an alternating fashion is also exhibited by other species, including zebra finches. With a combination of behavioral testing, electrophysiological recordings, and pharmacological manipulations we demonstrate that activity within a cortical premotor nucleus orchestrates the timing of calls in socially interacting zebra finches. Within this circuit, local inhibition precedes premotor neuron activation associated with calling. Blocking inhibition results in faster vocal responses as well as an impaired ability to flexibly avoid overlapping with a partner. These results support a working model in which premotor inhibition regulates context-dependent timing of vocalizations and enables the precise interleaving of vocal signals during turn-taking.


Conflict of interest statement

The authors declare no competing interests.

Figures

Fig. 1
Fig. 1. Call coordination in zebra finches.
a, b Call responses to call playbacks presented once per second for a 10-minute session while Bird 1 (a) and Bird 2 (b) were each interacting with the playbacks alone. (top) Spectrogram of call playback and bird’s call response. (bottom) Call playback indicated in gray. Bird 1 or 2 call responses indicated by blue and green bars, respectively. Scale bar, 100 ms. c Call response probability distributions for Bird 1 (blue) and Bird 2 (green) with matched peak response latencies (202 ms, 198 ms). d Call responses of Bird 1 (blue) and 2 (green) when housed together and presented with call playbacks (in triad). e Response distributions for birds in (d) when calling in triad. Light green distribution represents catch cycles in which a call from Bird 1 did not precede a call from Bird 2. f Mean response latencies for 8 birds alone with call playbacks (coefficient of variation CV (response latencies across birds) = 0.16) vs. in triad with a latency-matched bird and playbacks (CV (response latencies across birds) = 0.45). Same shapes indicate matched pairs. Blue and green markers represent example pair from (ae). g Difference (Δ) in response latencies between matched birds for 4 pairs when alone with playbacks vs. in triad (mean alone w/ playbacks ± standard deviation = 18 ± 12 ms, mean in triad = 165 ± 112 ms). The pair that did not change its latency developed an alternating strategy (see Supplementary Fig. 1). h Call response latencies (alone with playbacks vs. triad catch cycles) for those birds in each pair that had a greater shift in call timing. i Expected vs. Observed percent of overlapping calls for all 4 latency-matched pairs (expected overlap = 30.9% ± 4.3%, Observed overlap = 9.2% ± 7.6%, Wilcoxon rank-sum test, p = 0.029, n = 4 pairs). j Duration of calls when alone with playbacks or when in triad (mean duration alone w/ playbacks = 81 ± 13 ms, mean duration in triad = 81 ± 13 ms, Wilcoxon sign rank test, p = 0.779, n = 8 birds).
Fig. 2
Fig. 2. HVC is required for precise timing of calling behavior.
a Call responses (blue) to call playbacks (gray) for example bird during infusion of saline. b Call responses during bilateral infusion of 5 mM muscimol. c Response probability distributions for control (blue) and muscimol (red) conditions in (a, b). d Average response rate during control and muscimol conditions (control = 19.32 ± 11.66 calls/min, muscimol = 12.12 ± 7.19 calls/min, Wilcoxon signed-rank test, p< 0.05, n = 5 birds), error bars: standard deviation. e Effects of HVC inactivation on response latency precision for an example bird across 6 days starting with pre-surgery (C*) and alternating daily between muscimol (M) and saline infusion (C). f Response latency precision assessed pre-surgery (control*), during HVC inactivation (muscimol), and during saline (control) infusion (mean precision: C* = 4.13 ± 1.37, M = 1.83 ± 0.60, C = 3.02 ± 0.95, one-tailed Wilcoxon signed-rank test, C* vs. M: p = 0.031, C vs. M: p = 0.031, n = 5 birds, bars and dotted lines represent means). g Spectrograms of two calls recorded during a control condition (left) and a muscimol infusion (right). h Effects of HVC inactivation on acoustic features of calls for example bird in (g). Wiener Entropy i.e. the noisiness of calls (where white noise would have a value of 0 and a pure tone would have a large negative value) increases when muscimol is applied (red circles, n = 121 calls) whereas the pitch is higher in the saline control condition (blue circles, n = 261 calls). i Median pitch during saline control (blue) and muscimol (red) application (mean pitch ± s.d. for control = 568.5 ± 97.4 Hz, pitch for muscimol = 495.6 ± 35.1 Hz, n = 5 birds. j Duration of calls during control and muscimol conditions (mean duration for control = 89 ± 17 ms, mean duration for muscimol = 87 ± 17 ms, Wilcoxon signed-rank test, p = 0.3750, n = 5 birds). Source data is available as a Source Data file.
Fig. 3
Fig. 3. Activity of HVC neurons preceding call production.
a Spectrogram (top) and intracellular recordings of an HVC premotor neuron during call responses (blue bars) to call playbacks (gray). x, y scale bars: 100 ms, 10 mV. b Intracellular activity as in (a), aligned to tet call onsets (gray dotted line). x, y scale bars: 10 ms, 10 mV. c, d Bursting activity from a premotor neuron for tet calls (c) and song (d). x, y scale bars for (c): 10 ms, 10 mV. x, y scale bars for (d): 100 ms, 10 mV e Mean spikes per burst for premotor neurons during calls and song (n = 14 neurons (calls), n = 6 neurons (song), 2.4 ± 1.2 spikes per burst (calls), 5.0 ± 1.7 spikes per burst (songs), Wilcoxon rank-sum test, p < 0.001, Note: two neurons elicited two bursts during singing). Tet calls: solid circles, stack calls: open circles. f, g Correlation of acoustic features occurring after premotor neuron activity (gray boxes in (c, d)), (Spearman correlation, pitch: p = 0.840, goodness of pitch: p = 0.197, n = 6 neurons). h Hyperpolarization of a premotor neuron prior to calls (black). Bottom: Overlay of 13 renditions from example neuron in gray. Mean membrane potential in blue. x, y scale bars: 100 ms, 5 mV. i Same premotor neuron as in (h) recorded during two renditions of song. x, y scale bars: 100 ms, 10 mV. j Example recording of interneuron during calling. k Normalized firing rates for 7 interneurons relative to call onsets (average indicate in red). x, y scale bars: 100 ms, 10 mV. l Red circles: Onset of increased activity for n = 7 interneurons in (k), onsets of hyperpolarization for n = 5 premotor neurons (blue circles), and onsets of bursts for n = 14 premotor neurons (black circles) relative to start of call (gray dotted line). Open circles: stack calls, closed circles: tet calls (mean premotor neuron burst onset = −10 ± 22 ms, mean hyperpolarization onset = −52 ± 14 ms, Wilcoxon rank-sum test, p = 0.003, mean interneuron firing increase onset = −56 ± 31 ms, Kruskal–Wallis test, p < 0.0001). Source data is available as a Source Data file.
Fig. 4
Fig. 4. Effects of local gabazine microinfusion on HVC premotor neuron spiking during call production.
a Top: Example of call-related bursting for a premotor neuron recorded during saline control. Bottom: Same cell as (top) but recorded during local gabazine infusion. x, y scale bars: 10 ms, 10 mV. b Number of call-related spikes per burst in premotor neurons recorded under control or gabazine conditions (control: 2.4 ± 1.2 spikes per burst, n = 14 neurons in 10 birds, 2 were active during both call types; gabazine: 5.7 ± 2.8 spikes per burst, Wilcoxon rank-sum test, p = 0.003, n = 9 neurons in 3 birds). c Mean burst onset latency relative to call onsets for premotor neurons recorded during control conditions (blue) vs. premotor neurons recorded during gabazine microinfusion (orange), (spiking onset for control: −10 ± 22 ms, n = 14 neurons, for gabazine: −26 ± 26 ms, Wilcoxon rank-sum test, p = 0.039, n = 9 neurons). Source data is available as a Source Data file.
Fig. 5
Fig. 5. Inhibition within HVC regulates call timing.
a Call responses (blue bars) to call playbacks (gray) during bilateral infusion of saline in HVC (control). b Accelerated call responses (orange bars) during infusion of 0.01 mM gabazine. c Response probability distributions for control (blue) and gabazine (orange) conditions in (a, b). d Call response latency significantly decreases during the gabazine condition (orange) compared to pre-surgery (control*) and saline control conditions (blue). Response latency: control* = 266 ± 51 ms, gabazine = 166 ± 25 ms, control = 249 ± 68 ms, Kruskal–Wallis test, p = 0.0081, n = 5 birds). e Mean Precision: control* = 5.64 ± 4.25, gabazine = 7.73 ± 3.46, control = 4.42 ± 2.36, Kruskal–Wallis test, p = 0.164, n = 5 birds). f Spectrograms of example calls from one bird during the control (left) and gabazine (right) conditions. g Effects of reduced inhibition on call acoustic features for example bird shown in (f). h Call pitch during control and gabazine condition (mean pitch (control) = 530 ± 59 Hz, mean pitch (gabazine) = 530 ± 50 Hz, Wilcoxon signed-rank test, p = 1, n = 5 birds). i Call duration during control and gabazine conditions (mean duration control: 81 ± 18 ms, gabazine: 84 ± 19 ms, Wilcoxon sign rank test, p = 1, n = 5 birds). j Response rates during control vs. gabazine infusions (mean control: 29.0 ± 16.4 calls/min, gabazine: 35.9 ± 23.5 calls/min, Wilcoxon sign rank test, p = 1, n = 5 birds). Error bars: standard deviation. k. l Call response distributions for jamming avoidance task during (k) control (blue) and (l) gabazine (orange) infusions. Gray box: normalized jamming window, dark: baseline, light: during jamming call playbacks (n = 5 birds). m Percent of calls expected to overlap with the jamming window based on response to 1 Hz call playbacks (left). Percent of calls overlapping with jamming playbacks (right) (mean control: 25 ± 6% of calls vs. gabazine: 37 ± 11% of calls overlapping with jamming playback, Wilcoxon rank-sum test, p = 0.0459, n = 5 birds). Source data is available as a Source Data file.

References

    1. Levinson SC. Turn-taking in human communication—origins and implications for language processing. Trends Cogn. Sci. 2016;20:6–14. doi: 10.1016/j.tics.2015.10.010. - DOI - PubMed
    1. Heldner M, Edlund J. Pauses, gaps and overlaps in conversations. J. Phonetics. 2010;38:555–568. doi: 10.1016/j.wocn.2010.08.002. - DOI
    1. Stivers T, et al. Universals and cultural variation in turn-taking in conversation. Proc. Natl Acad. Sci. USA. 2009;106:10587–10592. doi: 10.1073/pnas.0903616106. - DOI - PMC - PubMed
    1. Pika S., Wilkinson R., Kendrick K. H. & Vernes S. C. Taking turns: bridging the gap between human and animal communication. Proc. Biol. Sci. 285, 20180598 (2018). - PMC - PubMed
    1. Takahashi DY, Narayanan DZ, Ghazanfar AA. Coupled oscillator dynamics of vocal turn-taking in monkeys. Curr. Biol. 2013;23:2162–2168. doi: 10.1016/j.cub.2013.09.005. - DOI - PubMed

Publication types