. 2020 Jan 10;11(1):213.
doi: 10.1038/s41467-019-14001-8.

The RNA-binding protein HuR is a negative regulator in adipogenesis

Affiliations

The RNA-binding protein HuR is a negative regulator in adipogenesis

Diana Teh Chee Siang et al. Nat Commun. .

Abstract

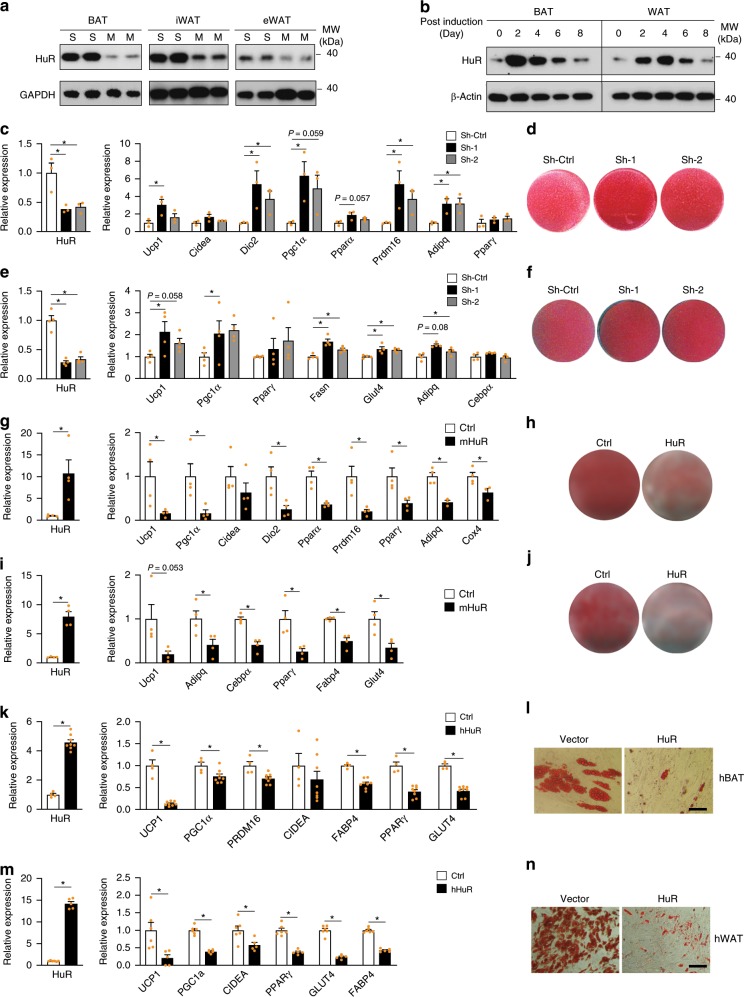
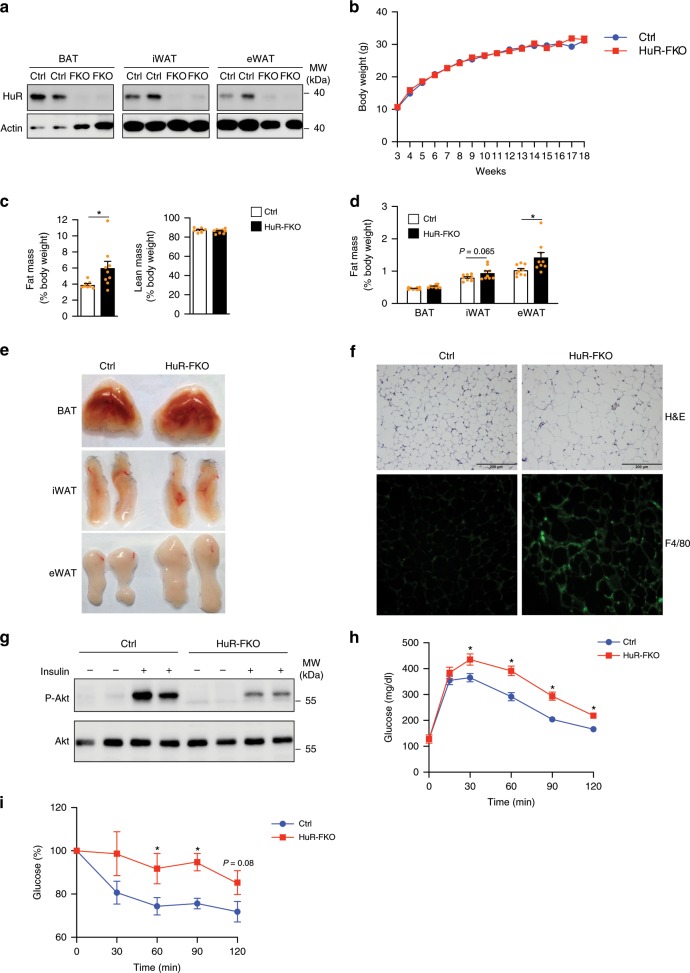
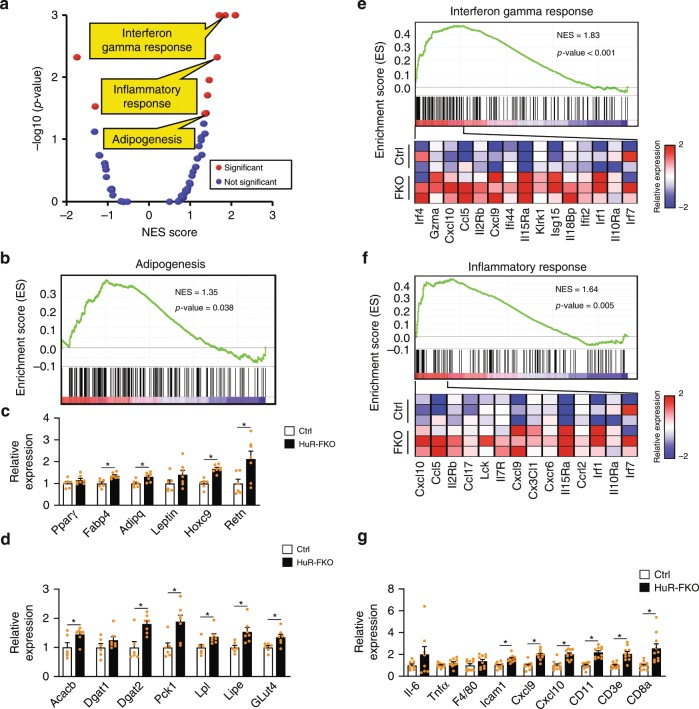
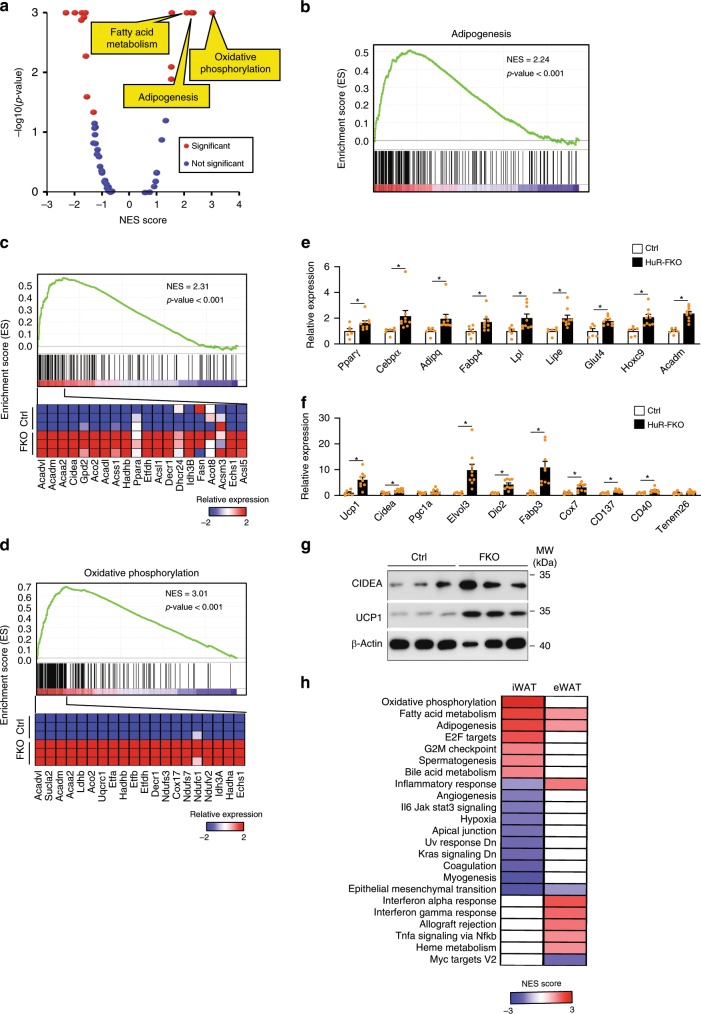
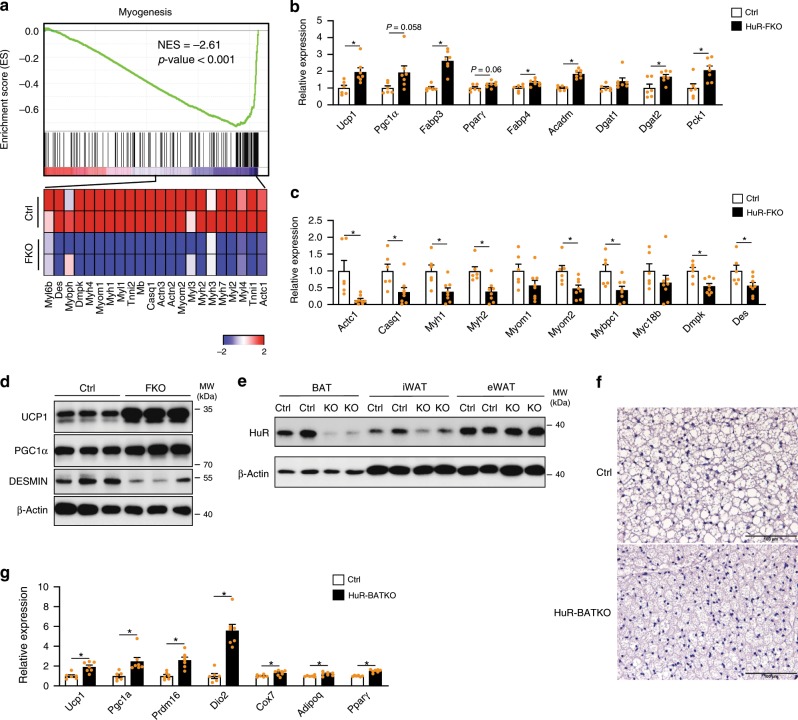
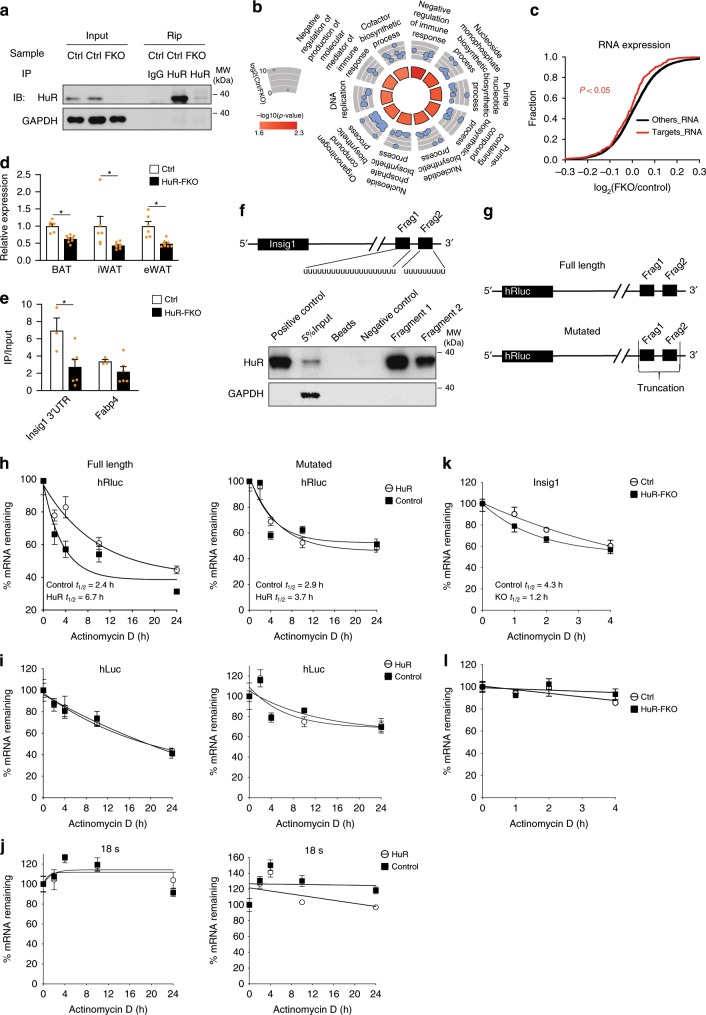
Human antigen R (HuR) is an essential regulator of RNA metabolism, but its function in metabolism remains unclear. This study identifies HuR as a major repressor during adipogenesis. Knockdown and overexpression of HuR in primary adipocyte culture enhances and inhibits adipogenesis in vitro, respectively. Fat-specific knockout of HuR significantly enhances adipogenic gene program in adipose tissues, accompanied by a systemic glucose intolerance and insulin resistance. HuR knockout also results in depot-specific phenotypes: it can repress myogenesis program in brown fat, enhance inflammation program in epidydimal white fat and induce browning program in inguinal white fat. Mechanistically, HuR may inhibit adipogenesis by recognizing and modulating the stability of hundreds of adipocyte transcripts including Insig1, a negative regulator during adipogenesis. Taken together, our work establishes HuR as an important posttranscriptional regulator of adipogenesis and provides insights into how RNA processing contributes to adipocyte development.


Conflict of interest statement

The authors declare no competing interests.

Figures

Fig. 1
Fig. 1. HuR represses adipocyte differentiation in vitro.
a Western blot to compare the HuR expression in Stromal vascular fraction of adipose tissue (S) and mature adipocytes (M). b Western blot to examine the protein levels of HuR in primary brown and white adipocyte differentiation time course. c Primary brown preadipocytes were infected by retroviral shRNAs targeting HuR followed by induction of differentiation for 5 days. Real-time PCR was used to measure the knockdown efficiency (left), BAT-selective marker and pan-adipocyte marker expression (right). n = 3. d Oil Red O staining to assess lipid accumulation. e, f Similar as in (c, d), but in primary white adipocyte culture. n = 4. g Retroviral overexpression of HuR in primary brown preadipocytes. Real-time PCR was conducted to examine HuR (left) and marker gene expression (right) of brown adipocyte culture expressing HuR or vector at day 5. n = 4 per group. h Oil Red O staining of HuR-overexpressing brown adipocytes. I, j Similar as in (g, h), but in primary white adipocyte culture. n = 4 per group. k Retroviral overexpression of HuR in human fetal brown adipocytes. Real-time PCR was used to determine the expression of HuR (left) and marker gene expression at day 21 post induction (Ctrl, n = 4; HuR, n = 8). l Oil red O staining for human brown adipocytes at day 21 post induction. The scale bar represents 100 μm. m, n similar as (k, l) in Human subcutaneous WAT at day 14 post induction (Ctrl, n = 6; HuR, n = 5). The scale bars represent 100 μm. Error bars are mean ± SEM. Statistical significance using Student’s t-test for (g), (i), (k), and (m), One-way ANOVA test for (c) and (e), *p < 0.05. Source data are provided as a Source Data file.
Fig. 2
Fig. 2. HuR knockout in adipose tissue results in increased fat mass.
a Western blot analysis of HuR expression in BAT, iWAT, and eWAT of HuR-KFO and control mice. b Body weight of male HuR-FKO and control (HuRflox/flox) mice (Ctrl, n = 7; HuR-FKO, n = 10). c In vivo fat and lean mass by EcoMRI in 3-month-old male HuR-FKO and control littermates. (Ctrl, n = 8; HuR-FKO, n = 9). d The organ weights of BAT, iWAT, and eWAT in 3-month-old HuR-FKO and control littermates were normalized as a percentage of total body weight. n = 9 per group. e Representative picture of BAT, iWAT, and eWAT. f Morphological characteristics of eWAT by H&E staining and immunostaining of eWAT with F4/80. Scale bars represent 200 μM. g Insulin-induced AKT phosphorylation in eWAT from HuR-FKO and Ctrl mice. Five minutes after IP insulin injection, mice were then sacrificed to harvest eWAT and examined its phosphorylation levels of AKT by western blot. h Blood glucose levels during glucose tolerance test (GTT) (n = 9 per group) and i insulin tolerance test (ITT) of HuR-FKO and control littermates (Ctrl, n = 8; HuR-FKO, n = 6). Error bars are mean ± SEM. Statistical significance was determined by Student’s t-test; *p < 0.05. Source data are provided as a Source Data file.
Fig. 3
Fig. 3. HuR knockout enhances adipogenesis and inflammation in eWAT.
a GSEA was performed to analyze the pathways affected by HuR depletion in eWAT. Scatterplot depicts the relationship between the p-value and normalized enrichment score (NES) of 50 “Hallmark” gene sets in MSigDB. Significant biological pathways are labeled in red. b GSEA in adipogenesis pathway. c Real-time PCR to confirm the expression of genes for white fat and adipogenesis (Ctrl, n = 6; HuR-FKO, n = 7). d Real-time PCR to confirm the expression of genes for lipogenesis and glucose uptake (Ctrl, n = 6; HuR-FKO, n = 7). e GSEA in interferon gamma response and f inflammatory response pathway. At the bottom of each panel shows a heatmap of representative genes found within the leading edge-subset of the biological pathway. The color intensity represents median centered gene expression (FPKM) with red and blue representing highly and lowly expressed genes, respectively. g Real-time PCR to confirm the expression of genes involved in inflammation. n = 10 per group. Error bars are mean ± SEM. Statistical significance was determined by Student’s t-test; *p < 0.05. Source data are provided as a Source Data file.
Fig. 4
Fig. 4. HuR knockout enhances adipogenesis and browning in iWAT.
a GSEA was performed to analyze the pathways affected by HuR depletion in iWAT. Scatterplot depicts the relationship between the p-value and NES score of 50 “Hallmark” gene sets in MSigDB. b GSEA on the biological pathway of adipogenesis, c fatty acid metabolism, and d oxidative phosphorylation. e Real-time PCR to confirm the expression of genes for adipogenesis, lipogenesis, and f BAT-selective and beige fat markers (Ctrl, n = 6; HuR-FKO, n = 9). g Western blot was performed to examine the protein level of Cidea and Ucp1 in iWAT from HuR-FKO and Ctrl mice. h The regulated pathways in HuR-FKO iWAT and eWAT are displayed in a heatmap. The color represents the NES for each pathway. Error bars are mean ± SEM. Statistical significance was determined by Student’s t-test; *p < 0.05.
Fig. 5
Fig. 5. Deletion of HuR in BAT promotes brown adipogenesis.
a GSEA on HuR-FKO and Ctrl BAT indicated that myogenesis pathway was significantly downregulated in HuR knockout BAT. b Real-time PCR to confirm the expression of BAT-selective markers, adipogenesis, lipogenesis (Ctrl, n = 6; HuR-FKO, n = 7), and c muscle markers (Ctrl, n = 6; HuR-FKO, n = 8). d Western blot to exam the protein level of Ucp1, Pgc1a, and Desmin in BAT from HuR-FKO and Ctrl mice. e Western blot analysis of HuR expression in BAT, iWAT, and eWAT of HuR-BATKO and control mice. f Morphological characteristics of HuR-BATKO and control littermates by H&E staining. Scale bars represent 100 μM. g Real-time PCR to confirm the expression of genes for BAT-selective markers and adipogenesis in BAT from HuR-BATKO and Ctrl mice (Ctrl, n = 6; HuR-BATKO, n = 7). Error bars are mean ± SEM. Statistical significance was determined by Student’s t-test; *p < 0.05. Source data are provided as a Source Data file.
Fig. 6
Fig. 6. HuR targets and stabilizes Insig1.
a Western blot to confirm the presence of HuR protein in the IP sample by anti-HuR. b Circle plot depicting the top 10 most significant biological processes generated using the top 200 most enriched HuR-binding genes in Ctrl. The inner circle is colored by the significance of the GO process. The outercircle represents the scatterplot of the enrichment (log2(Ctrl/HuR-FKO)) for all the genes found within each GO term. c The accumulative fraction curves were plotted for the fold changes of targets and other genes between the FKO and control samples. Kolmogorov–Smirnov test. d Real-time PCR to confirm the expression of Insig1 in BAT, iWAT, and eWAT (Ctrl: n = 6; HuR-FKO: n = 8). e RIP assay with anti-HuR in epididymal white adipose tissue lysate from the HuR-FKO and control littermates to examine the amount of Insig1 mRNA in the IP samples. Fabp4 was used as a control. 5% tissue lysate in the IP reaction was used as input (Ctrl, n = 3; HuR-FKO, n = 6). f RNA pull-down assay for the HuR-recognizing RNA segments in Insig1 3′UTR (detailed in Methods). g The diagram of a psiCHECK2 reporter with a full length Insig1 3′UTR (upper) or a mutated 3′UTR without the two HuR-binding sites (lower). h, i The plasmid diagrammed in (g) was co-transfected with HuR overexpression plasmid or control (XZ201) into 293 cells. Actonmycin D was added to stop the transcription, followed by real-time PCR for h hRluc, i hLuc, and j 18 s during a time course. The remaining fractions of hRluc mRNA at each point were fit into a first-phase decay curve to derive the RNA half-life. n = 6 per group. k Primary white preadipocytes were isolated from HuR-KFO and control animals for culture and then induced to differentiate for 5 days. Actinomycin D was added to track the decay rate. l 18S mRNA was used a control. n = 5 per group. Error bars are mean ± SEM. Statistical significance was determined by Student’s t-test; *p < 0.05.

References

    1. Sun K, Kusminski CM, Scherer PE. Adipose tissue remodeling and obesity. J. Clin. Invest. 2011;121:2094–2101. doi: 10.1172/JCI45887. - DOI - PMC - PubMed
    1. Rosen ED, Spiegelman BM. What we talk about when we talk about fat. Cell. 2014;156:20–44. doi: 10.1016/j.cell.2013.12.012. - DOI - PMC - PubMed
    1. Rosen ED, MacDougald OA. Adipocyte differentiation from the inside out. Nat. Rev. Mol. Cell Biol. 2006;7:885–896. doi: 10.1038/nrm2066. - DOI - PubMed
    1. Rosen ED, Spiegelman BM. Adipocytes as regulators of energy balance and glucose homeostasis. Nature. 2006;444:847–853. doi: 10.1038/nature05483. - DOI - PMC - PubMed
    1. Cook KB, Kazan H, Zuberi K, Morris Q, Hughes TR. RBPDB: a database of RNA-binding specificities. Nucleic Acids Res. 2011;39:D301–D308. doi: 10.1093/nar/gkq1069. - DOI - PMC - PubMed

Publication types

MeSH terms