. 2020 Jan 10;11(1):220.
doi: 10.1038/s41467-019-14046-9.

Arf1-mediated lipid metabolism sustains cancer cells and its ablation induces anti-tumor immune responses in mice

Affiliations

Arf1-mediated lipid metabolism sustains cancer cells and its ablation induces anti-tumor immune responses in mice

Guohao Wang et al. Nat Commun. .

Abstract

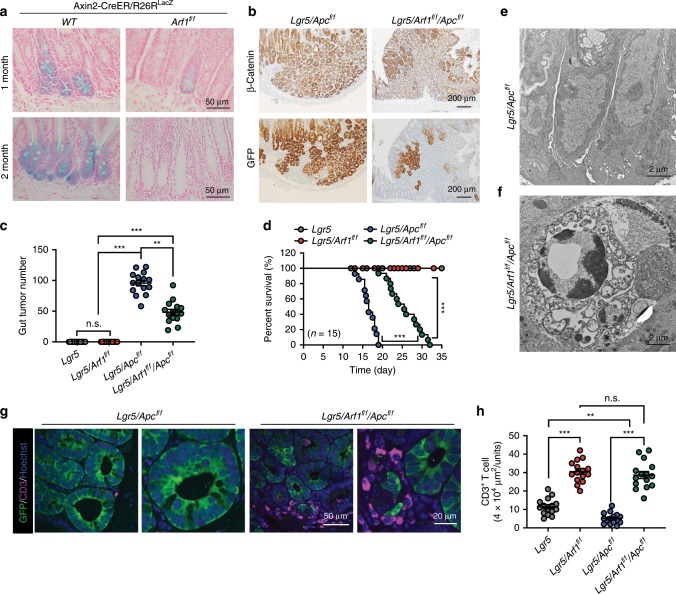
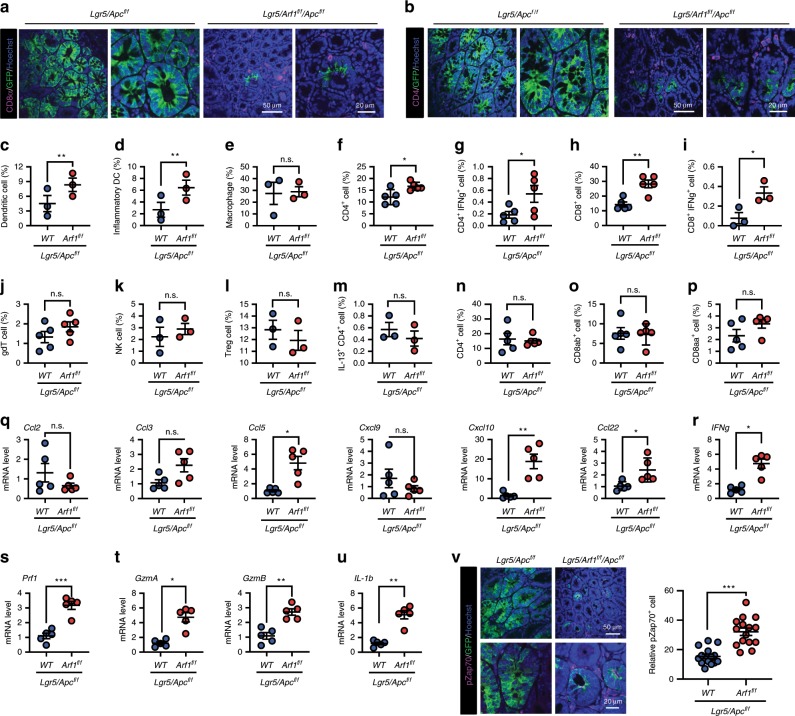
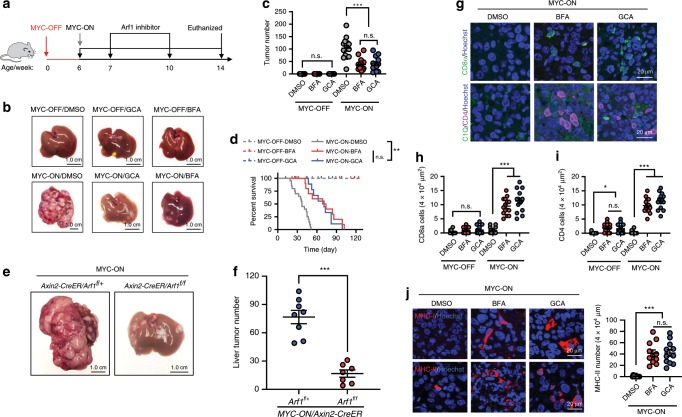
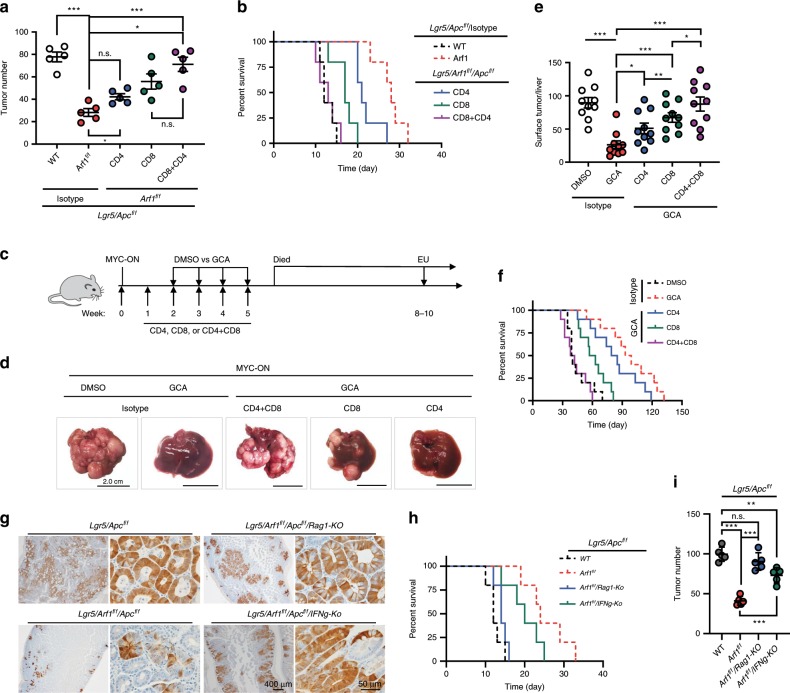
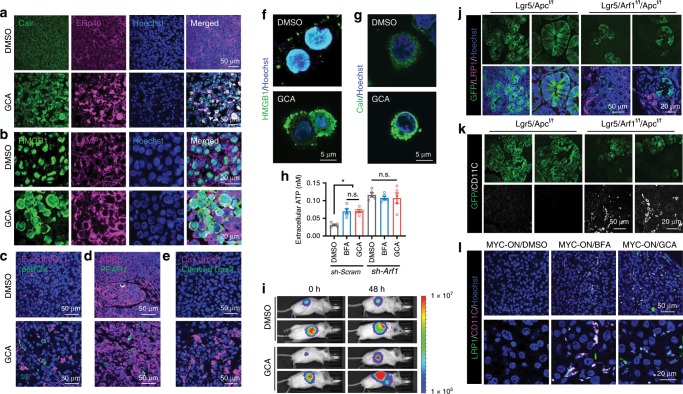
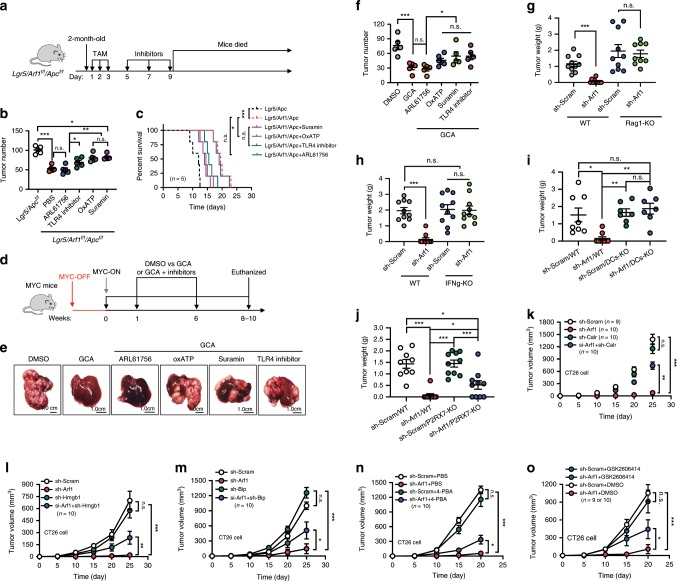
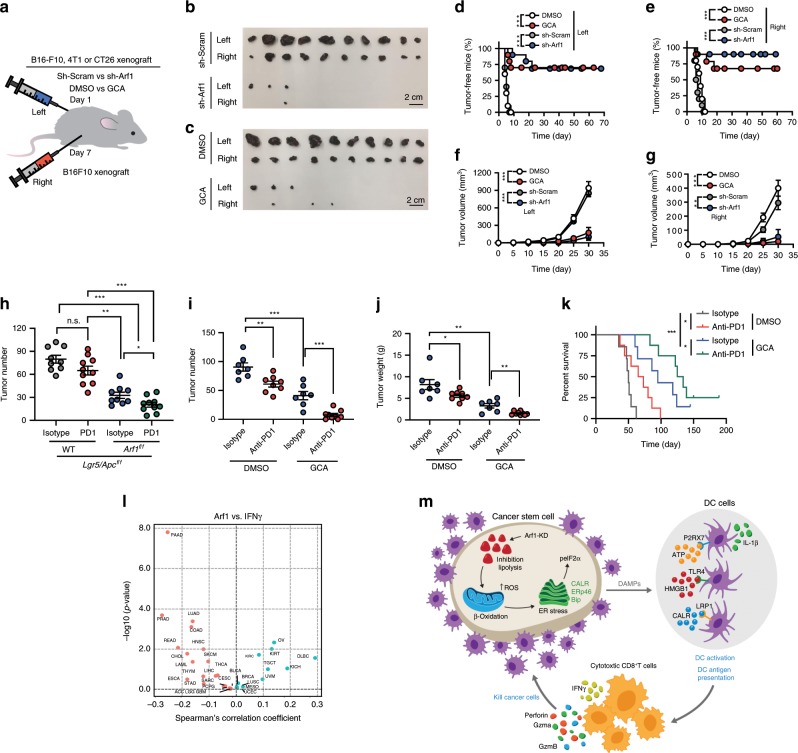
Cancer stem cells (CSCs) may be responsible for treatment resistance, tumor metastasis, and disease recurrence. Here we demonstrate that the Arf1-mediated lipid metabolism sustains cells enriched with CSCs and its ablation induces anti-tumor immune responses in mice. Notably, Arf1 ablation in cancer cells induces mitochondrial defects, endoplasmic-reticulum stress, and the release of damage-associated molecular patterns (DAMPs), which recruit and activate dendritic cells (DCs) at tumor sites. The activated immune system finally elicits antitumor immune surveillance by stimulating T-cell infiltration and activation. Furthermore, TCGA data analysis shows an inverse correlation between Arf1 expression and T-cell infiltration and activation along with patient survival in various human cancers. Our results reveal that Arf1-pathway knockdown not only kills CSCs but also elicits a tumor-specific immune response that converts dying CSCs into a therapeutic vaccine, leading to durable benefits.


Conflict of interest statement

The authors declare no competing interests.

Figures

Fig. 1
Fig. 1. Arf1 knockdown reduces the CSC and extends the lifespan of Lgr5/Apc mice.
a LacZ-stained sections of intestine from an Axin2-CreER/Rosa26R or an Axin2-CreER/Rosa26R/Arf1f/f mouse that was treated with five intraperitoneal injections of tamoxifen to activate stem-cell-specific Cre and facilitate the loss of Arf1. b Lgr5/Apc or Lgr5/Apc/Arf1 mice were treated with three continued intraperitoneal injection of tamoxifen to activate the stem-cell-specific Cre and facilitate the loss of Apc and Arf1. β-Catenin and GFP mark stem cells. c Intestinal tumor number in the indicated genotypes (n = 15 mice per group; ***p < 0.001, t-test; repeated three independent times). d Percent survival curves of mice with the indicated genotypes (n = 15 mice per group; ***p < 0.001, t-test; repeated three independent times). e, f Electron microscopy sections of mouse intestinal crypts with the indicated genotypes. g Immunofluorescent staining of CD3, GFP, and Hoechst in intestinal sections of mice with the indicated genotypes. h Quantification of infiltrated CD3+ T cells in mice with the indicated genotypes (n = 15 mice per group; n.s. is not significant, **p < 0.01, ***p < 0.001, t-test; repeated three independent times). Each experiment replicate three times. Data are shown as the mean ± SEM. Scale bars are as indicated.
Fig. 2
Fig. 2. Arf1 ablation induces the infiltration and activation of immune cells in Lgr5/Apc mice.
a, b Immunofluorescent staining of GFP and CD8a (a) or CD4 (b) in the intestine of the indicated mice. ce Flow cytometric analysis of gut APCs: DCs (c), inflammatory DCs (d), and macrophages (e) (n = 3 mice each group; **p < 0.01, t-test; repeat two independent experiments). fm Flow cytometric analysis of the immune cells of LPLs: CD4+ T cells (f), IFNγ+CD4+ T cells (g), CD8+ T cells (h), IFNγ+CD8+ T cells (i), γδ T cells (j), NK cells (k), Treg cells (l), and IL-13+ CD4+ T cells, (m) (n = 3 or 5). np Flow cytometric analysis of the immune cells of IELs: CD4+ T cells (n), CD8αβ+ T cells (o), and CD8αα+ T cells (p) (n = 5 mice per group; *p < 0.05, **p < 0.01, t-test; repeat two independent experiments). qu Relative gene expression of the indicated chemokines, cytokines, and granzymes (n = 5 mice each group, repeat two independent experiments). v Immunofluorescent staining of GFP and pZap70 in the intestine of the indicated mice (n = 5 mice each group; *p < 0.05, **p < 0.01, ***p < 0.001, t-test; repeat two independent experiments). Each experiment replicate two times. Data are shown as the mean ±  SEM. Scale bars are as indicated.
Fig. 3
Fig. 3. Arf1 inhibition induces anti-tumor immune responses in MYC-ON liver tumor mice.
a Experimental setup for the MYC-ON mice. b Representative liver images of MYC-OFF or MYC-ON mice treated with DMSO, GCA, or BFA. c, d Liver surface tumor counts (c) and survival curves (d) of mice with the indicated treatments (n = 15 mice each group; ***p < 0.001, t-test; pooled two independent experiments). e Representative liver images of MYC-ON/Axin2-CreER/Arf1f/+ or MYC-ON/Axin2-CreER/Arf1f/f mice. f Liver surface tumor counts of e (n = 8 mice each group; ***p < 0.001, t-test; polled repeat two independent times). gi Arf1 inhibition induces the expression of CD8 and CD4 in the liver of MYC-ON liver tumor mice (n = 13 mice each group; ***p < 0.001, t-test; polled repeat three independent times). j Arf1 inhibition induces the expression of MHC-I and MHC II in the liver of MYC-ON liver tumor mice (n = 13 mice each group; ***p < 0.001, t-test; polled repeat three independent times). Data are shown as the mean ±  SEM. *p < 0.05, **p < 0.01, ***p < 0.001 by Student’s t-test. Scale bars are as indicated.
Fig. 4
Fig. 4. Prolonged survival of Lgr5/Apc and MYC-ON mice depends on the T cells.
a Intestinal tumor number in mice of the indicated genotypes treated with anti-CD4 (CD4) or/and anti-CD8 (CD8) antibodies. b Survival curves of mice with the indicated genotypes and treatments (n = 5 mice each group; *p < 0.05, **p < 0.01, ***p < 0.001, t-test; repeat two independent experiments). c Experimental setup for MYC-ON liver tumor mice treated with the indicated reagents. d Representative liver images of MYC-ON mice treated with the indicated reagents. Scale bars: 2.0 cm. e Liver surface tumor counts of MYC-ON treated with the indicated reagents (n = 10 mice per group; *p < 0.05, **p < 0.01, ***p < 0.001, t-test; pooled two independent experiments). f Survival curves of MYC-ON mice treated with the indicated reagents (n = 10 mice per group; *p < 0.05, **p < 0.01, ***p < 0.001, t-test; pooled two independent experiments). g Immunohistochemical staining of GFP in the indicated genotypes (n = 5 mice per group). hi Percent of survival (h) and intestine tumor number (i) in the indicated mice (n = 5 mice each group; **p < 0.01, ***p < 0.001, t-test; repeat two independent experiments). Data are shown as the mean ± SEM. *p < 0.05, **p < 0.01, ***p < 0.001 by Student’s t-test.
Fig. 5
Fig. 5. Arf1 inhibition triggers ER stress and induces DAMPs and DC infiltration.
ae Huh-7 cells were treated with control DMSO or GCA and then injected into athymic nude mice. After 3 weeks, the tumors from the treated cells were excised and stained for molecular markers. Calr, HMGB1, ERp46, and the lysosome protein LAMP1 were dramatically induced in the GCA-treated tumors (a and b). Nuclear HMGB1 moved to the extracellular space (b). The ER stress marker peIF2α and the ERp46 receptor PEAR1 were also significantly increased in GCA-treated tumors (c and d). Cleaved and active Caspase 1 p20 but not cleaved Caspase 3 was also dramatically induced in the GCA-treated tumor (e). f, g Direct treatment of Huh-7 cells with GCA induced the expression and translocation of HMGB1 (f) and the translocation of Calr (g) from the nucleus to the extracellular space. h Treatment of Huh-7 cells with the Arf1 inhibitor BFA or GCA induced ATP secretion from control but not Arf1 (sh-Arf1) knockdown cells (n = 5 wells cell each group, *p < 0.05, t-test; repeat three independent experiments). i Treatment of mice with Arf1 inhibitor GCA increased ATP release in vivo. j, k LRP1 and CD11c expression in the intestine of Lgr5/Apc or Lgr5/Arf1/Apc mice. l LRP1 and CD11c expression in the liver of MYC-ON liver tumor mice treated with the indicated reagents. Each experiment replicates three times. Data are shown as the mean ± /SEM. *p < 0.05, **p < 0.01 by Student’s t-test. Scale bars are as indicated.
Fig. 6
Fig. 6. Arf1 ablation induces anti-tumor immune responses through DAMPs.
a Experimental setup for Lgr5/Arf1/Apc mice. TAM: injection of tamoxifen. b Tumor numbers in mice treated with the indicated inhibitors. c Survival curves of Lgr5/Arf1/Apc mice treated with the indicated reagents (n = 5 mice each group; *p < 0.05, **p < 0.01, ***p < 0.001, t-test; repeat two independent experiments). d Experimental setup for the MYC-ON liver tumor mice. e Representative liver images of MYC-ON mice treated with the indicated reagents. f Number of liver surface tumors in MYC-ON mice treated with the indicated inhibitors (n = 5 mice per group; *p < 0.05, ***p < 0.001, t-test; repeat two independent experiments). g Tumor weight of wild-type or Rag1-KO C57BL/6J mice receiving B16-F10 cells treated with the indicated sh-RNAs (sh-Scram and sh-Arf1 in WT group, sh-Scram in Rag-KO group, n = 10 mice each group; sh-Arf1 in Rag-KO group, n = 9 mice; ***p < 0.001, t-test; polled two independent experiments). h Tumor weight of wild-type or IFNγ-KO BALB/c mice receiving CT26 cells treated with the indicated sh-RNAs (n = 10 mice each group; *p < 0.05, t-test; repeat two independent experiments). i Tumor weight of wild-type or DCs-KO C57BL/6J mice receiving B16-F10 cells treated with the indicated sh-RNAs (sh-Scram/WT, n = 8 mice; sh-Arf1/WT, n = 10 mice; sh-Scram/DCs-KO and sh-Arf1/DCs-KO, n = 7 mice; *p < 0.05, **p < 0.01, ***p < 0.001, t-test; repeat two independent experiments). j Tumor weight of wild-type or P2RX7-KO C57BL/6J mice receiving B16-F10 cells treated with the indicated sh-RNAs (sh-Scram/WT, n = 9 mice; sh-Arf1/WT, sh-Scram/P2RX7-KO and sh-Arf1/P2RX7-KO, n = 10 mice each group; *p < 0.05, ***p < 0.001, t-test; repeat two independent experiments). ko Tumor volume curves of BALB/c mice receiving transplants of murine colon carcinoma CT26 cells treated with the indicated sh-RNAs and inhibitors (k, sh-Scram n = 9 mice, other groups n = 10 mice; ln, n = 10 mice per group; o, sh-Scram/DMSO and sh-Scram/GSK2606414, n = 9 mice per group; sh-Arf1/DMSO and sh-Arf1/GSK2606414, n = 10 mice per group; *p < 0.05, **p < 0.01, ***p < 0.001, t-test; repeat two independent experiments). Data are shown as the mean ± SEM. Scale bars are as indicated.
Fig. 7
Fig. 7. Vaccination with Arf1-ablated cells protects animals from developing tumors.
a Experimental setup. B16-F10 cells that were transfected with sh-Arf1 or sh-Scram or treated with the Arf1 inhibitor GCA or DMSO were injected into the left side of C57BL/6J mice, and the mice were then re-challenged 1 week later with untreated B16-F10 cells on the right side. b, c Tumor sizes from B16-F10 cells treated with the indicated reagents and transplanted into C57BL/6J mice. Scale bars: 2 cm. d, e Tumor-free curves of B16-F10 cells treated with the indicated reagents and transplanted into C57BL/6J mice. f, g Tumor-volume curves of B16-F10 cells treated with the indicated reagents and transplanted into C57BL/6J mice. h Intestinal tumor number of mice with the indicated genotypes after treatment with isotype or an anti-PD1 antibody. i Tumor numbers of MYC-ON mice treated with the indicated reagents. j Tumor weights of MYC-ON mice treated with the indicated reagents. k Survival curves of MYC-ON mice treated with the indicated reagents. l Correlation analysis for the Arf1 expression level versus IFNγ signature from a human cancer database. m Proposed model depicting how Arf1 knockdown promotes metabolic stress, the induction of DAMPs, and immune cell infiltration and activation to attack tumors (bg: n = 10; h: n = 10; i: n = 8; j: isotype group, n = 7, anti-PD1 group, n = 8; k: n = 8 mice each group; *p < 0.05, **p < 0.01, ***p < 0.001 by Student’s t-test; polled two independent experiments). Data are shown as the mean ± SEM.

References

    1. Batlle E, Clevers H. Cancer stem cells revisited. Nat. Med. 2018;23:1124–1134. doi: 10.1038/nm.4409. - DOI - PubMed
    1. Lytle NK, Barber AG, Reya T. Stem cell fate in cancer growth, progression and therapy resistance. Nat. Rev. Cancer. 2018;18:669–680. doi: 10.1038/s41568-018-0056-x. - DOI - PMC - PubMed
    1. Shibue T, Weinberg RA. EMT, CSCs, and drug resistance: the mechanistic link and clinical implications. Nat. Rev. Clin. Oncol. 2017;14:611–629. doi: 10.1038/nrclinonc.2017.44. - DOI - PMC - PubMed
    1. Jones CL, et al. Inhibition of amino acid metabolism selectively targets human leukemia stem cells. Cancer Cell. 2018;34:724–740. doi: 10.1016/j.ccell.2018.10.005. - DOI - PMC - PubMed
    1. Singh SR, et al. The lipolysis pathway sustains normal and transformed stem cells in adult Drosophila. Nature. 2016;538:109–113. doi: 10.1038/nature19788. - DOI - PMC - PubMed

Publication types

MeSH terms

LinkOut - more resources