Clinical Trial
. 2020 Jan 10;11(1):219.
doi: 10.1038/s41467-019-13880-1.

Clonal kinetics and single-cell transcriptional profiling of CAR-T cells in patients undergoing CD19 CAR-T immunotherapy

Affiliations
Clinical Trial

Clonal kinetics and single-cell transcriptional profiling of CAR-T cells in patients undergoing CD19 CAR-T immunotherapy

Alyssa Sheih et al. Nat Commun. .

Abstract

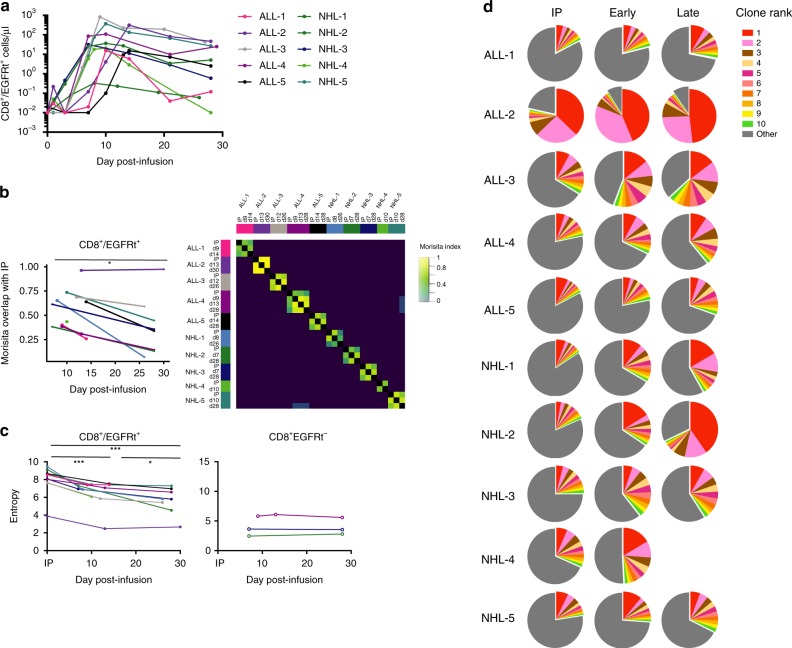
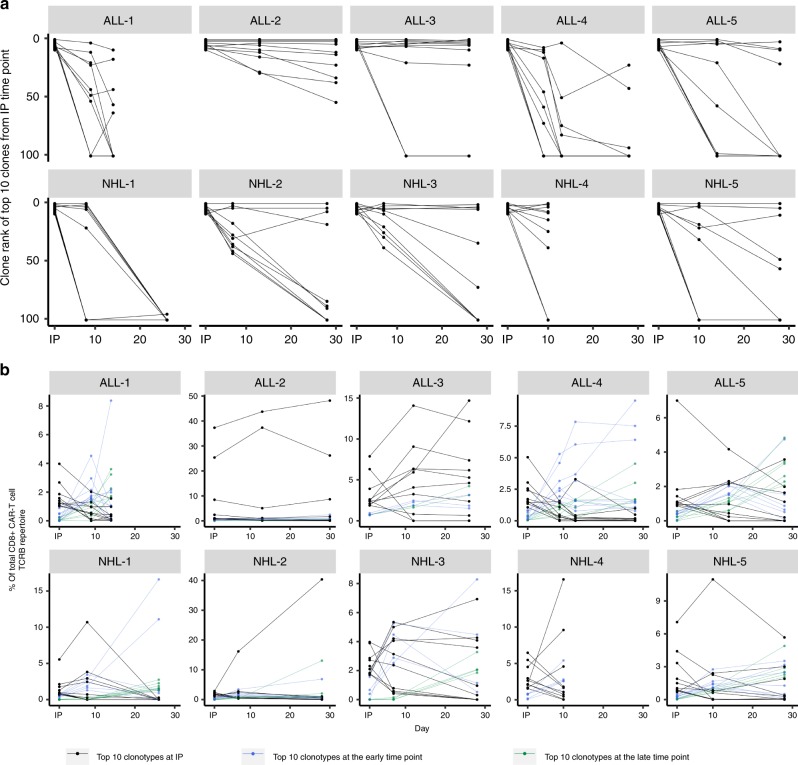
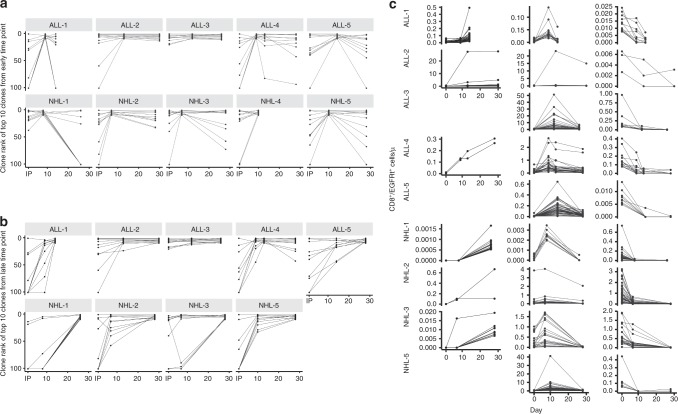
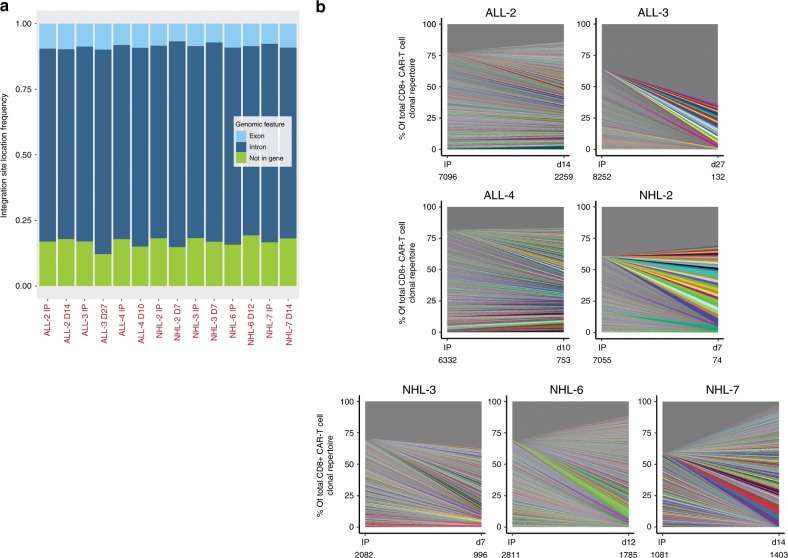
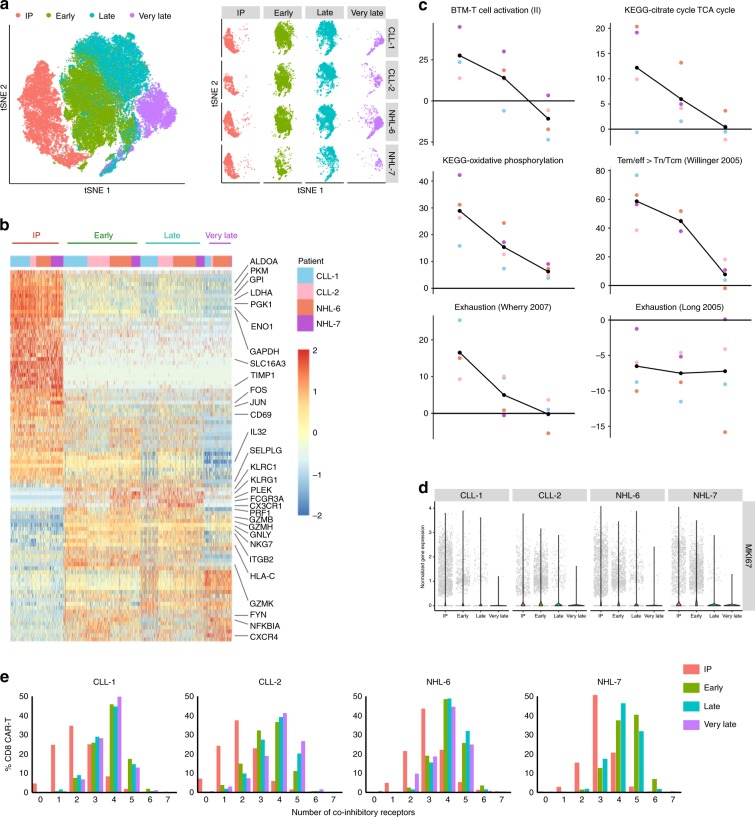
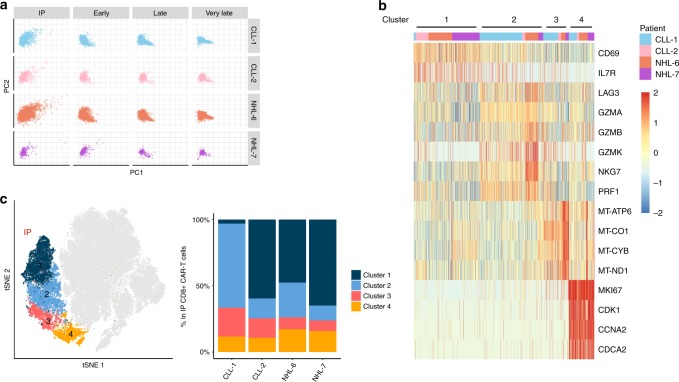
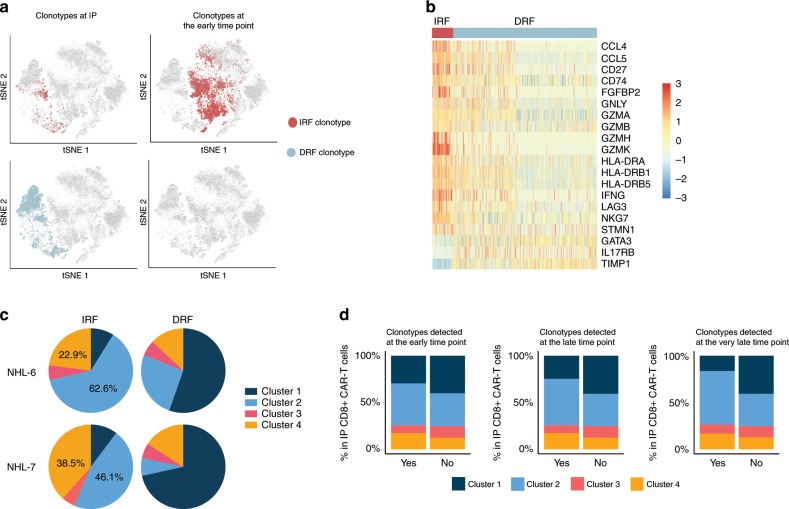
Chimeric antigen receptor (CAR) T-cell therapy has produced remarkable anti-tumor responses in patients with B-cell malignancies. However, clonal kinetics and transcriptional programs that regulate the fate of CAR-T cells after infusion remain poorly understood. Here we perform TCRB sequencing, integration site analysis, and single-cell RNA sequencing (scRNA-seq) to profile CD8+ CAR-T cells from infusion products (IPs) and blood of patients undergoing CD19 CAR-T immunotherapy. TCRB sequencing shows that clonal diversity of CAR-T cells is highest in the IPs and declines following infusion. We observe clones that display distinct patterns of clonal kinetics, making variable contributions to the CAR-T cell pool after infusion. Although integration site does not appear to be a key driver of clonal kinetics, scRNA-seq demonstrates that clones that expand after infusion mainly originate from infused clusters with higher expression of cytotoxicity and proliferation genes. Thus, we uncover transcriptional programs associated with CAR-T cell behavior after infusion.


Conflict of interest statement

S.R.R. received research funding from Juno Therapeutics, a Celgene company, has patents licensed to Juno Therapeutics, a Celgene company, has equity ownership in Celgene, and has served on advisory boards for Adaptive Biotechnologies, Cell Medica, Juno Therapeutics, a Celgene company, and NOHLA. D.G.M. received research funding from GlaxoSmithKline and Juno Therapeutics, a Celgene company. H.P.K. is a consultant to and has ownership interests with Rocket Pharma and Homology Medicines, is a consultant to CSL Behring and Magenta Therapeutics, and is an inventor on patent applications (#62/351,761, #62/428,994, and #PCT/US2017/037967) submitted by the Fred Hutchinson Cancer Research Center that cover the selection and use of cell populations for research and therapeutic purposes, as well as strategies to assess and/or produce cell populations with predictive engraftment potential. C.J.T. received research funding from Juno Therapeutics, a Celgene company, and Nektar Therapeutics, has patents licensed to Juno Therapeutics, a Celgene company, has served on advisory boards, has equity ownership in Caribou Biosciences, Eureka Therapeutics, and Precision Biosciences, and has served on advisory boards for Aptevo, Juno Therapeutics, a Celgene company, Kite, a Gilead Company, Nektar Therapeutics, Novartis, Allogene, Myeloid Therapeutics, and PACT Pharma. R.G. has received consulting income from Juno Therapeutics, Takeda, Infotech Soft, Celgene, has received research support from Janssen Pharmaceuticals and Juno Therapeutics, and declares ownership in Cellspace Biosciences. The remaining authors declare no competing financial interests. Companies funding this research did not have any role in the study design or data analysis and interpretation.

Figures

Fig. 1
Fig. 1. Clonal diversity of CD8+ CAR-T cells decreases after infusion.
a CD8+/EGFRt+ CAR-T cell counts in the blood of patients who received CAR-T cells manufactured from CD4+ and CD8+ TCM cells (n = 10 patients). Data represents the mean ± SEM. ALL acute lymphoblastic leukemia, NHL non-Hodgkin lymphoma. b The Morisita index was calculated for pairwise comparisons of the CD8+ CAR-T cell repertoire between all samples. Left, Morisita overlap index between the IP and the indicated times after adoptive transfer. Each line represents data from an individual patient. Right, heatmap of the Morisita index. The Morisita index was lower at late compared to early times after infusion (paired Mann–Whitney test, p < 0.05). c Decreased clonal diversity in CD8+ CAR-T cells after infusion. The Shannon entropy indices of the CD8+/EGFRt+ (CAR-T cell, left) and CD8+/EGFRt (non-CAR-expressing T cell, right) TCRB repertoires are shown. Statistical differences between samples were evaluated with paired t-tests. *p < 0.05, **p < 0.005, ***p < 0.001. d The relative frequencies of the top ten ranked clonotypes in the total CD8+ CAR-T cell TCRB repertoire in the IP and at the early and late time points after infusion are presented in pie charts. The top ten clonotypes are ranked by the number of copies of the TCRB sequence in each sample; the same color might not represent the same identical clonotype at each time point. Source data underlying Fig. 1a, c, and d are provided as a Source Data file.
Fig. 2
Fig. 2. Rank and relative frequency of the top ten clonotypes in the IP can change after infusion.
a The rank of the top ten CD8+ CAR-T cell clonotypes in the IP were tracked over time and shown at the early and late time points. All rank positions >100 were designated in the figure as having a rank position of 101. Each line represents an individual clonotype. b The relative frequencies of the top ten ranked CD8+ CAR-T cell clonotypes from the IP (black line), the early (blue line), and late (green line) time points were followed over time. Each line represents an individual clonotype. Source data are provided as a Source Data file.
Fig. 3
Fig. 3. Distinct CD8+ CAR-T cell clones exhibit different kinetic behaviors after infusion.
a The rank of the top ten CD8+ CAR-T cell clonotypes from the early time point are shown in the IP and at different time points after infusion. b The rank of the top ten CD8+ CAR-T cell clonotypes from the late time point are shown in the IP and at different time points after infusion. All rank positions >100 were designated in the figure as having a rank position of 101. Each line represents an individual clonotype. c The absolute counts of the top 30 CD8+ CAR-T cell clones from the IP, early, and late time points were tracked over time. The absolute count at Day 0 represents the absolute count of CD8+ CAR-T cells distributed in blood immediately after infusion, calculated based on the infusion dose. Left, clones whose absolute cell numbers increased in blood after infusion. Middle, clones whose absolute numbers increased in blood early after infusion then decreased. Right, clones whose absolute cell numbers decreased in blood after infusion. There were no increasing clones for ALL-3, ALL-5, and NHL-5. Each line represents an individual clone. Source data are provided as a Source Data file.
Fig. 4
Fig. 4. Integration site analysis suggests multiple clones contribute to CAR-T cell pools.
a Bar chart depicts the percentage of integration sites found within an exon, intron, or not in a gene for CD8+ CAR-T cells. b Graphs represent the contribution (% frequency) of all identified clones by integration site analysis in IP and blood samples collected after infusion (x axis). Each color ribbon represents a unique clone demonstrating ≥1% frequency of sequence reads in a given sample. All other clones are grouped into the gray ribbon at the top of each graph. The total number of unique clones identified in the sample is listed underneath the sample ID for each graph (below the x axis).
Fig. 5
Fig. 5. Single-cell transcriptome of infused CAR-T cells are distinct from CAR-T cells in blood.
a Left, t-SNE representation of 62,167 CD8+ CAR-T cells concatenated from the IP, early, late, and very late time points of four additional patients. Single cells from the early time point are overlaid on single cells at the late time point. Right, t-SNE analysis of concatenated CD8+ CAR-T cells from each time point in each patient. b Heatmap displaying the expression of genes that are differentially expressed between each time point with selected genes highlighted. Only genes that were differentially expressed between time points in all four patients are represented in the heatmap (FDR = 0.05, log2FC = 1.5). Color scale represents gene expression levels as a z-score. c GSEA using indicated gene sets was performed on CD8+ CAR-T cells isolated from the IP and blood at distinct time points after adoptive transfer. A combined Z-score was calculated for pairwise comparisons between CD8+ CAR-T cells from each post-infusion sample relative to the IP. A negative Z-score represents higher expression of the gene set in CD8+ CAR-T cells from the IP. Each point represents an individual patient. FDR = 0.01, absolute continuous Z-score > log2(1.5), absolute discrete Z-score > log2(1.5). d Violin plot of MKi67 gene expression at the IP, early, late, and very late time points. e Co-expression of zero to seven inhibitory markers, including PD-1, LAG-3, TIM-3, KLRG1, TIGIT, 2B4, and CD160 on CD8+ CAR-T cells from the IP and isolated at the early, late, and very late time points after infusion. Source data underlying Fig. 5e is provided as a Source Data file.
Fig. 6
Fig. 6. CD8+ CAR-T cells in the infusion product form four transcriptionally distinct clusters.
a PCA plot of single-cell gene expression residuals in CD8+ CAR-T cells isolated from the IP and blood at early, late, and very late time points. Gene expression residuals were calculated after adjusting for known sources of heterogeneity: the cellular detection rate, subject, and time point using MAST. Data were downsampled within each patient to account for differences in sample sizes between time points. b Unsupervised clustering was performed after concatenation of the scRNA-seq data across all time points and patients. Left, t-SNE plot highlighting the four transcriptionally distinct CD8+ CAR-T cell clusters identified in the IP. Each dot represents a single CD8+ CAR-T cell from the IP (colored) or from the early, late, and very late time points (gray). Right, the percentage of each identified cluster among CD8+ CAR-T cells in the IP is shown for each patient. c Heatmap displaying selected genes that are differentially expressed between clusters in the IP. Within each patient, differential gene expression analysis was performed by pairwise comparisons between clusters and only genes that were differentially expressed between clusters in all four patients were represented in the heatmap (FDR = 0.05, log2FC = 1.5). Color scale represents gene expression levels as a z-score.
Fig. 7
Fig. 7. Variable contribution of infused CAR-T clusters to in vivo repertoire.
a t-SNE plot showing the localization of IRF clonotypes (red) and DRF clonotypes (blue) in the IP (left) or at the early time point (right). Each dot represents a single CAR-T cell. b Heatmap displaying genes that are differentially expressed between IRF and DRF clones in the IP. Color scale represents gene expression levels as a z-score. c Pie charts depict the fraction of IRF or DRF clonotypes that are distributed among the four transcriptionally distinct clusters in the IP. The percent of cells in cluster 2 and 4 among IRF clonotypes are reported. d Bars depict the fraction of transcriptionally distinct clusters among CD8+ CAR-T cells in the IP that were either detected (Yes) or not detected (No) at the early (Left), late (Middle), or very late (Right) time points after infusion. Source data are provided as a Source Data file.

References

    1. Gardner RA, et al. Intent-to-treat leukemia remission by CD19 CAR T cells of defined formulation and dose in children and young adults. Blood. 2017;129:3322–3331. doi: 10.1182/blood-2017-02-769208. - DOI - PMC - PubMed
    1. Davila ML, et al. Efficacy and toxicity management of 19-28z CAR T cell therapy in B cell acute lymphoblastic leukemia. Sci. Transl. Med. 2014;6:224ra25. doi: 10.1126/scitranslmed.3008226. - DOI - PMC - PubMed
    1. Maude SL, et al. Chimeric antigen receptor T cells for sustained remissions in leukemia. N. Engl. J. Med. 2014;371:1507–1517. doi: 10.1056/NEJMoa1407222. - DOI - PMC - PubMed
    1. Turtle CJ, et al. CD19 CAR-T cells of defined CD4 + :CD8 + composition in adult B cell ALL patients. J. Clin. Invest. 2016;126:2123–2138. doi: 10.1172/JCI85309. - DOI - PMC - PubMed
    1. Kochenderfer JN, et al. Lymphoma remissions caused by anti-CD19 chimeric antigen receptor T cells are associated with high serum interleukin-15 levels. J. Clin. Oncol. 2017;35:1803–1813. doi: 10.1200/JCO.2016.71.3024. - DOI - PMC - PubMed

Publication types