. 2020 Jan 10;10(1):126.
doi: 10.1038/s41598-019-57022-5.

Experimental glaucoma model with controllable intraocular pressure history

Affiliations

Experimental glaucoma model with controllable intraocular pressure history

Kayla R Ficarrotta et al. Sci Rep. .

Abstract

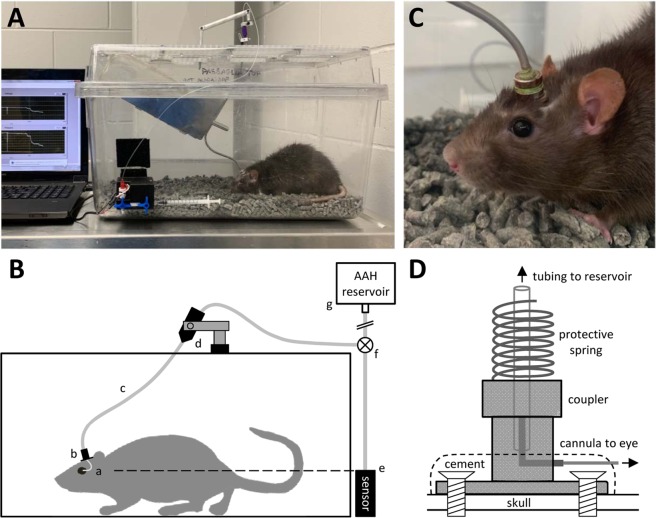
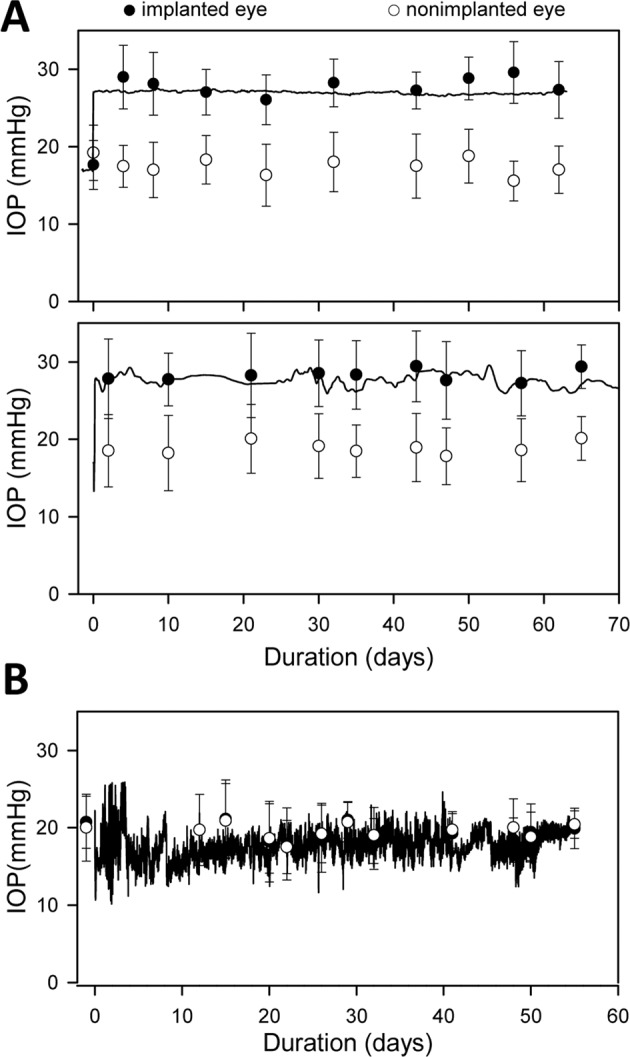
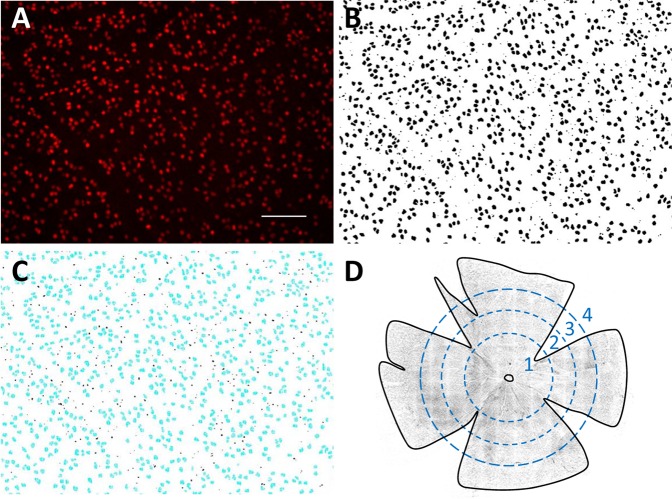
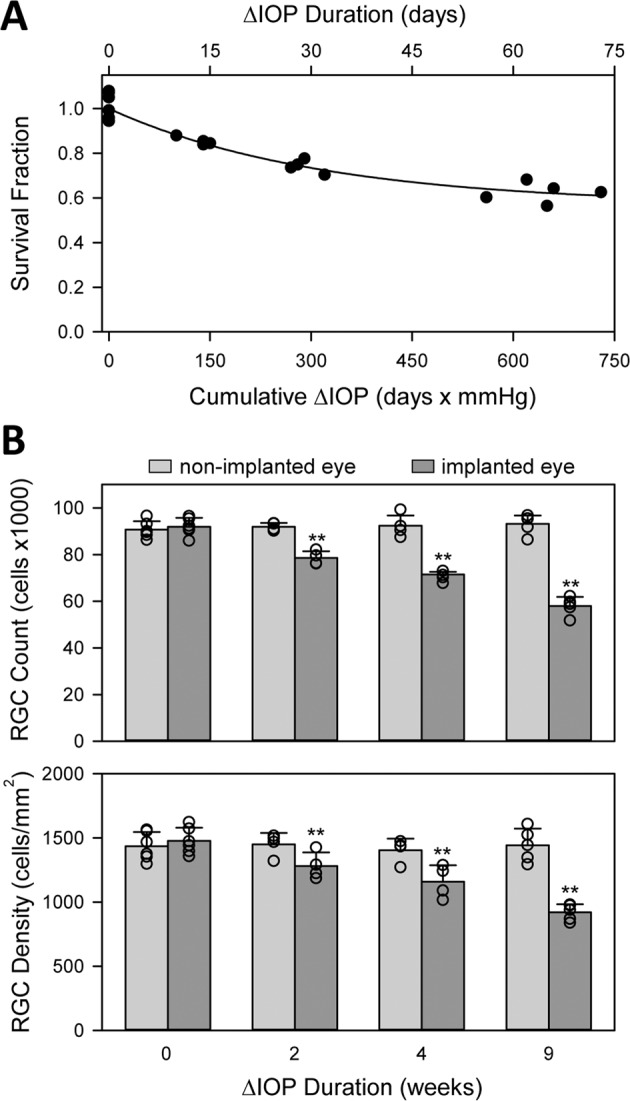
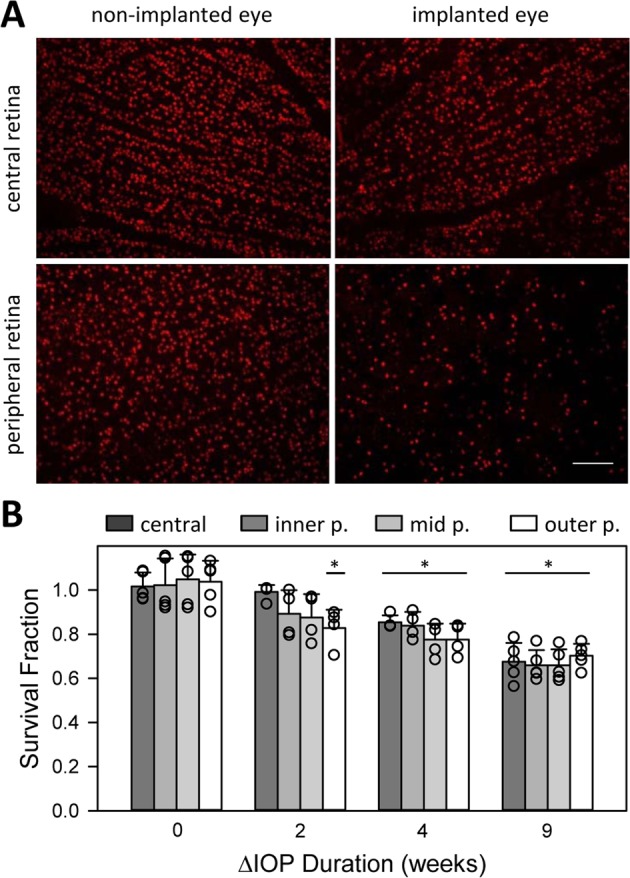
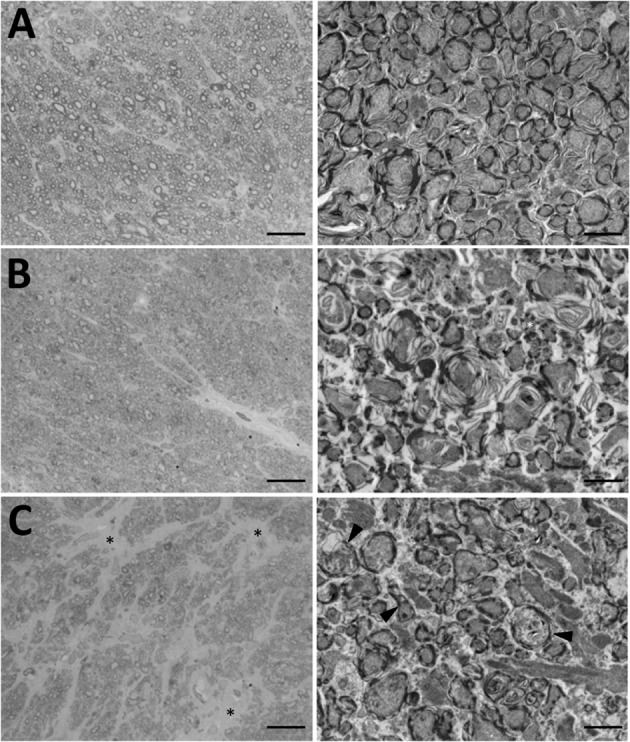
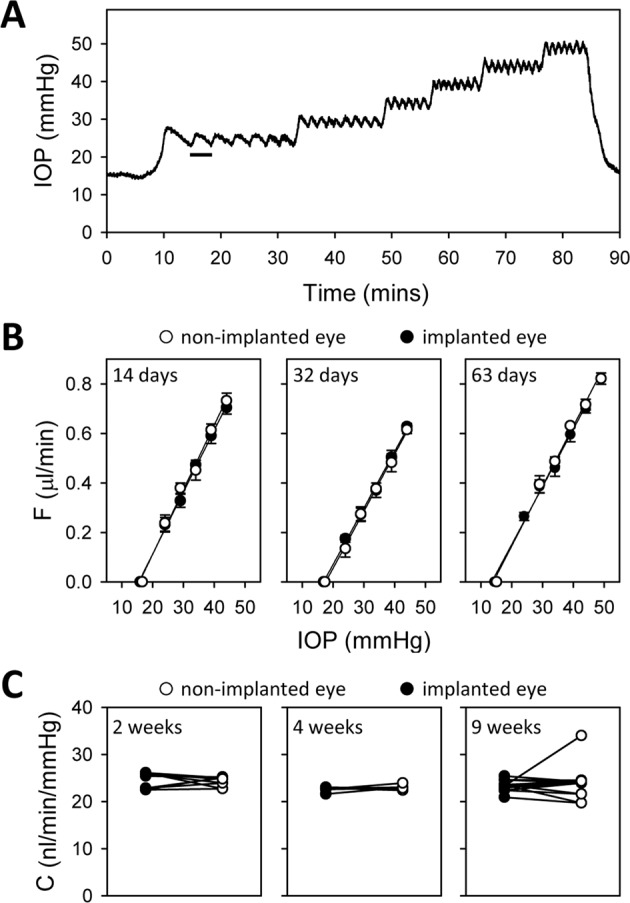
Glaucoma-like neuropathies can be experimentally induced by disturbing aqueous outflow from the eye, resulting in intraocular pressure (IOP) changes that are variable in magnitude and time course and permanent in duration. This study introduces a novel method of glaucoma induction that offers researchers round-the-clock measurement and reversible control of IOP for the first time. One eye of Brown-Norway rats was implanted with a cannula tethered to a pressure sensor and aqueous reservoir. IOP was raised 10 mmHg for weeks-to-months in treated animals and unaltered in control animals. Counts of Brn3a-expressing retinal ganglion cells (RGCs) in implanted eyes were indistinguishable from non-implanted eyes in control animals and 15 ± 2%, 23 ± 4%, and 38 ± 4% lower in animals exposed to 2, 4, and 9 weeks of IOP elevation. RGC loss was greater in peripheral retina at 2 weeks and widespread at longer durations. Optic nerves also showed progressive degeneration with exposure duration, yet conventional outflow facility of implanted eyes was normal (24.1 ± 2.9 nl/min/mmHg) even after 9-weeks elevation. Hence, this infusion-based glaucoma model exhibits graded neural damage with unimpaired outflow pathways. The model further revealed a potentially-significant finding that outflow properties of rat eyes do not remodel in response to chronic ocular hypertension.


Conflict of interest statement

The authors declare no competing interests.

Figures

Figure 1
Figure 1
Experimental setup. (A) Photo of chronic eye infusion system. (B) Schematic of system components. Rat eye is implanted with a fine cannula (a) that is connected, via a head-mounted plastic coupler (b) and flexible tubing that runs inside a metal spring (c), to a rotary swivel (d). The swivel connects the tubing to a pressure sensor (e) and a variable-height reservoir of AAH (g) via a 3-way stopcock (f). Dashed line indicates that the sensor is positioned at rat eye level. (C) Photo of the head-mounted coupler. (D) Schematic of coupler components. Bone screws and cement affix the coupler to the skull. A metal L-shaped stent inside the coupler connects the implanted cannula to external tubing, and a metal spring attached to the coupler protects the tubing from animal bites.
Figure 2
Figure 2
Cannula-implanted rat eyes. (A) Images of implanted eyes after 15 days (top left), 29 days (top right), 32 days (bottom left), and 63 days (bottom right) of IOP elevation. Arrowhead points to the cannula tip. (B) Close-up of cannula in the 29-day animal. (C) Fundus images of the implanted eye of the 63-day animal at experiment end (top) and a non-implanted eye (bottom).
Figure 3
Figure 3
IOP history of implanted eyes. (A) IOP record of an eye exposed to 63 days (top) and 74 days (bottom) of infusion-induced ocular hypertension. IOP was recorded every 5 minutes by a pressure sensor connected to the cannula, which was implanted on day 0. Filled and unfilled symbols respectively plot the IOP of implanted and non-implanted eyes measured by tonometry. Error bars give standard deviation of 6 tonometer readings. (B) IOP record and tonometry data of a control eye that was implanted but not exposed to ocular hypertension.
Figure 4
Figure 4
Counting retinal ganglion cells. (A) Raw image of Brn3a-labelled cells in a healthy rat retina. The image is a maximum-intensity projection of a stack of images collected along the z (depth) axis. Scale bar is 100 μm. (B) Image after applying a custom filter sequence and binary threshold to highlight labeled cells and a watershed function to separate overlapped cells. (C) Cells that were counted (blue) in the image using a size constraint of 15 to 300 µm2. (D) Image of a flat-mounted rat retina. Dashed circles subdivide the tissue into: (1) central, (2) inner peripheral, (3) mid peripheral, and (4) outer peripheral regions within which cell counts were tabulated. Circle radii correspond to 1.9, 2.8, and 3.7 mm in retinal space. Solid line outlines the tissue border for purpose of area measurement and cell density calculation.
Figure 5
Figure 5
IOP-induced loss of RGCs. (A) Fraction of surviving cells as a function of the duration of IOP elevation and cumulative IOP insult. Survival fraction (SF) was defined as the ratio of RGC counts in the implanted and non-implanted eyes. Points at 0 days are control animals in which a cannula was implanted for several weeks but IOP was not elevated. Solid line is a regression of the data to the equation: SF=1b(1eat). (B) Average RGC count (top) and density (bottom) in non-implanted and implanted eyes exposed to 0 weeks (controls) and approximately 2, 4, and 9 weeks of IOP elevation. Symbols give individual eye data. Error bars are standard deviations. Asterisks indicate statistically significant differences.
Figure 6
Figure 6
Regional variation in RGC loss. (A) Images of Brn3a-positive nuclei in the central (top) and peripheral (bottom) retina of the non-implanted (left) and implanted (right) eyes of an animal after 63 days of IOP elevation. Scale bar is 100 μm (B) Survival fraction of RGCs within central, inner peripheral, mid peripheral, and outer peripheral regions of the retina of animals exposed to 0 weeks (controls) and approximately 2, 4, and 9 weeks of IOP elevation. SF was computed for each region from the ratio of cell densities in the implanted and non-implanted eye. Symbols give individual eye data. Error bars give standard deviation. Asterisks indicate statistical differences from control animals.
Figure 7
Figure 7
IOP-induced injury to the optic nerve. (A) Cross-sections of the optic nerve of the non-implanted eye of an animal. (B,C) Cross-sections of the optic nerve of the implanted eye of animals exposed to 2 and 9 weeks of IOP elevation, respectively. Scale bars are 100 μm in light micrographs (left) and 2 μm in transmission electron micrographs (right). Arrowheads indicate several degenerating axons with disrupted membranes and axoplasms filled with cellular debris. Asterisks mark fields of gliosis.
Figure 8
Figure 8
Aqueous humor dynamics of IOP-elevated eyes. (A) IOP record of implanted eye of an anesthetized animal during outflow facility measurement. The bar indicates one duty cycle of the pump, which turned on and off to hold IOP at different levels above the resting IOP (15 mmHg). (B) Fluid outflow rate (F) at different IOP set points for the implanted (filled symbols) and non-implanted (unfilled symbols) eyes of animals exposed to 2 weeks (left), 4 weeks (middle), and 9 weeks (right) of IOP elevation. F was determined from measured duty cycles in A. Lines are regression fits to estimate the data slope, which determines conventional outflow facility (C). C, Measured C for the implanted and non-implanted eye of all animals in each exposure group.

References

    1. Bouhenni RA, Dunmire J, Sewell A, Edward DP. Animal models of glaucoma. J. Biomed. Biotechnol. 2012;2012:692609. doi: 10.1155/2012/692609. - DOI - PMC - PubMed
    1. John SW. Mechanistic insights into glaucoma provided by experimental genetics the cogan lecture. Invest. Ophthalmol. Vis. Sci. 2005;46:2649–2661. doi: 10.1167/iovs.05-0205. - DOI - PubMed
    1. McKinnon SJ, Schlamp CL, Nickells RW. Mouse models of retinal ganglion cell death and glaucoma. Exp. Eye Res. 2009;88:816–824. doi: 10.1016/j.exer.2008.12.002. - DOI - PMC - PubMed
    1. Almasieh M, Wilson AM, Morquette B, Cueva Vargas JL, Di Polo A. The molecular basis of retinal ganglion cell death in glaucoma. Prog. Retin. Eye Res. 2012;31:152–181. doi: 10.1016/j.preteyeres.2011.11.002. - DOI - PubMed
    1. Gaasterland D, Kupfer C. Experimental glaucoma in the rhesus monkey. Invest. Ophthalmol. 1974;13:455–457. - PubMed

Publication types