. 2020 Jan 10;10(1):134.
doi: 10.1038/s41598-019-56894-x.

In silico analysis of alternative splicing on drug-target gene interactions

Affiliations

In silico analysis of alternative splicing on drug-target gene interactions

Yanrong Ji et al. Sci Rep. .

Abstract

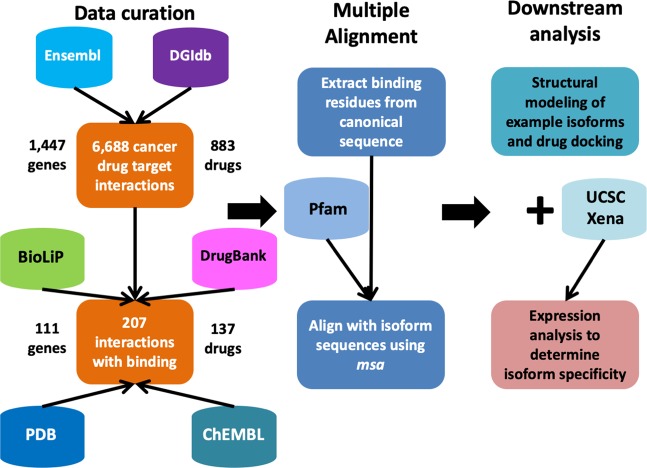
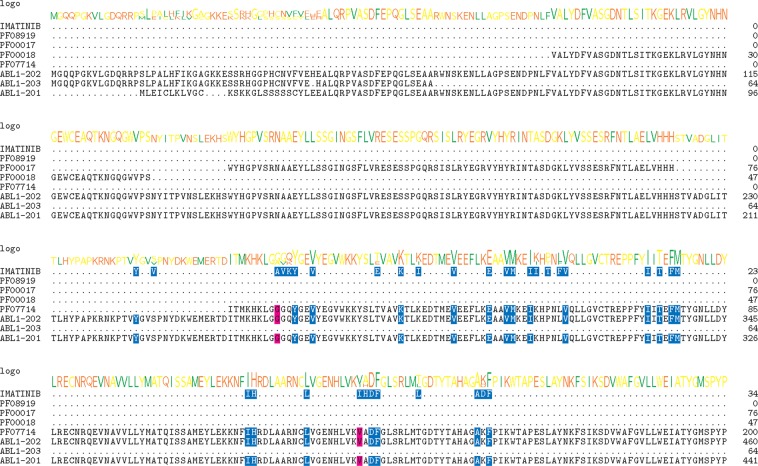
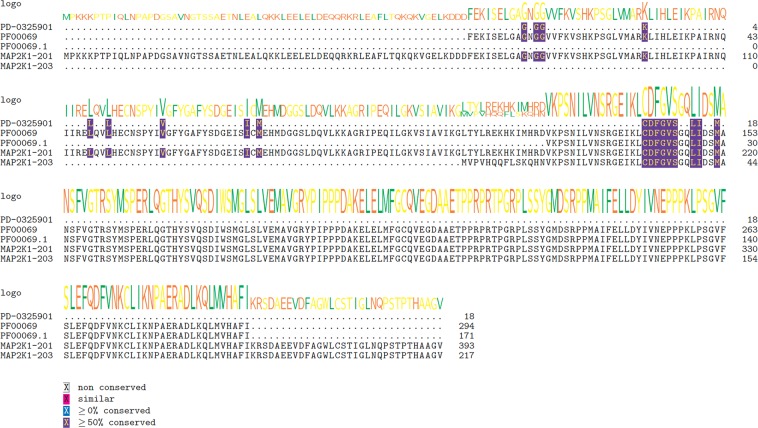
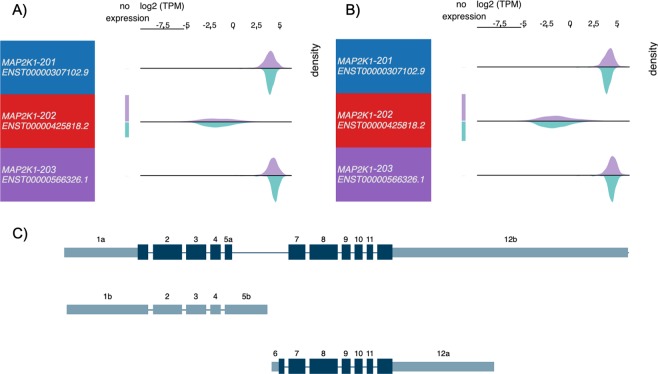
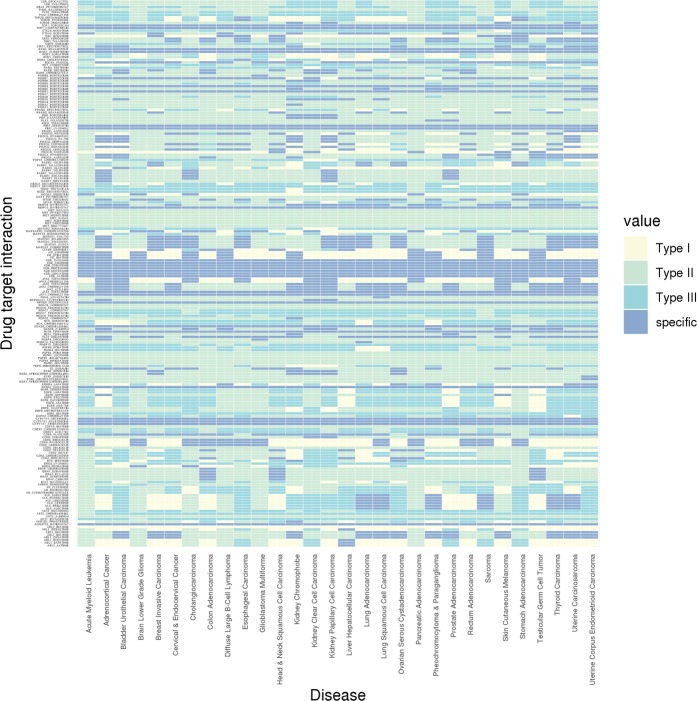
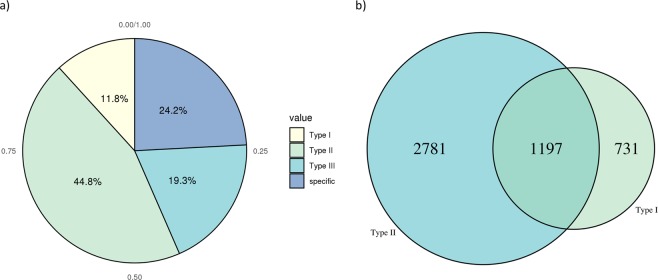
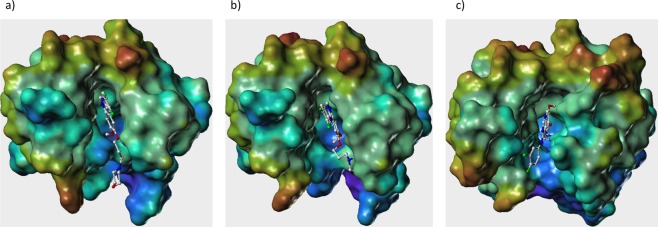
Identifying and evaluating the right target are the most important factors in early drug discovery phase. Most studies focus on one protein ignoring the multiple splice-variant or protein-isoforms, which might contribute to unexpected therapeutic activity or adverse side effects. Here, we present computational analysis of cancer drug-target interactions affected by alternative splicing. By integrating information from publicly available databases, we curated 883 FDA approved or investigational stage small molecule cancer drugs that target 1,434 different genes, with an average of 5.22 protein isoforms per gene. Of these, 618 genes have ≥5 annotated protein-isoforms. By analyzing the interactions with binding pocket information, we found that 76% of drugs either miss a potential target isoform or target other isoforms with varied expression in multiple normal tissues. We present sequence and structure level alignments at isoform-level and make this information publicly available for all the curated drugs. Structure-level analysis showed ligand binding pocket architectures differences in size, shape and electrostatic parameters between isoforms. Our results emphasize how potentially important isoform-level interactions could be missed by solely focusing on the canonical isoform, and suggest that on- and off-target effects at isoform-level should be investigated to enhance the productivity of drug-discovery research.


Conflict of interest statement

The authors declare no competing interests.

Figures

Figure 1
Figure 1
Workflow of the analysis pipeline.
Figure 2
Figure 2
Multiple sequence alignments of predicted interacting residues of Imatinib on different isoforms of ABL1 protein. Cluster Omega was applied to align the binding residues with isoform sequences using Bioconductor package msa. From top to down: predicted Imatinib interacting residues; aligned Pfam domains; ABL1-202; ABL1-203 and ABL1-201. Sequence logo of the consensus sequences were shown on top of each line. Blue shading indicates overlapping residues of a sequence with the predicted binding residues. Purple shading indicates ≥50% of all sequences are conserved with this residue. Pink shading indicates similar amino acids. Only regions near the predicted binding pockets were shown.
Figure 3
Figure 3
Multiple sequence alignments of predicted interacting residues of Erlotinib on different isoforms of EGFR protein. Cluster Omega was applied to align the binding residues with isoform sequences using Bioconductor package msa. From top to down: predicted Imatinib interacting residues; aligned Pfam domains (different versions represent different sequences with same Pfam ID); EGFR-206; EGFR-203; EGFR-207; EGFR-205; EGFR-202; EGFR-204 and EGFR-201. Sequence logo of the consensus sequences were shown on top of each line. Blue shading indicates overlapping residues of a sequence with the predicted binding residues. Purple shading indicates ≥50% of all sequences are conserved with this residue. Pink shading indicates similar amino acids. Only regions near the predicted binding pockets were shown.
Figure 4
Figure 4
Expression and exon structure of EGFR isoforms. 11 isoforms correspond to (top to down) EGFR-207, 202, 206, 203, 204, 201, 202 (removed in latest version), 208, 209, 205 and 210. Purple density indicates log2(TPM) from (A) TCGA Lung Adenocarcinoma (LUAD) samples or (B) TCGA Lung Squamous Cell Carcinoma (LUSC) samples; green density indicates those from GTEx normal lung samples. Exon plot (C) follows the same order as density plots. All plots are generated using UCSC Xena browser.
Figure 5
Figure 5
Multiple sequence alignments of predicted interacting residues of PD-0325901 on different isoforms of MAP2K1 protein. Cluster Omega was applied to align the binding residues with isoform sequences using Bioconductor package msa. From top to down: predicted Imatinib interacting residues; aligned Pfam domains (different versions represent different sequences with same Pfam ID); MAP2K1-201 and MAP2K1-203. Sequence logo of the consensus sequences were shown on top of each line. Blue shading indicates overlapping residues of a sequence with the predicted binding residues. Purple shading indicates ≥50% of all sequences are conserved with this residue. Pink shading indicates similar amino acids.
Figure 6
Figure 6
Expression and exon structure of MAP2K1 isoforms. Three isoforms correspond to (top to down) MAP2K1-201, MAP2K1-202 and MAP2K1-203. Purple density indicates log2(TPM) from (A) TCGA Lung Adenocarcinoma (LUAD) samples or (B) TCGA Lung Squamous Cell Carcinoma (LUSC) samples; green density indicates those from GTEx normal lung samples. Exon plot (C) follows the same order as density plots. All plots are generated using UCSC Xena browser.
Figure 7
Figure 7
Heatmap of isoform specificity profile for 207 drug target interactions in 33 types of cancers. Type I: targets ≥2 isoforms when at least one is downregulated; Type II: ignores at least one upregulated isoform in cancer; Type III: both Type I and II.
Figure 8
Figure 8
Summary of isoform specificity of different drugs. (a) Pie chart showing percentages of the 4 types. Type I: targets ≥2 isoforms when at least one is downregulated; Type II: ignores at least one upregulated isoform in cancer; Type III: both Type I and II. (b) Venn diagram showing counts of Type I, Type II and Type III (overlap of Type I and II). Type I: targets ≥2 isoforms when at least one is downregulated; Type II: ignores at least one upregulated isoform in cancer; Type III: both Type I and II.
Figure 9
Figure 9
Ligand-binding pocket of EGFR isoforms (a) EGFR-201 (b) EGFR-206, and (c) EGFR-207, with binding of Gefinitib.

References

    1. Prasad V, Mailankody S. Research and Development Spending to Bring a Single Cancer Drug to Market and Revenues After Approval. JAMA Intern Med. 2017;177:1569–1575. doi: 10.1001/jamainternmed.2017.3601. - DOI - PMC - PubMed
    1. DiMasi JA, Grabowski HG, Hansen RW. Innovation in the pharmaceutical industry: New estimates of R&D costs. J Health Econ. 2016;47:20–33. doi: 10.1016/j.jhealeco.2016.01.012. - DOI - PubMed
    1. Hwang TJ, et al. Failure of Investigational Drugs in Late-Stage Clinical Development and Publication of Trial Results. JAMA Intern Med. 2016;176:1826–1833. doi: 10.1001/jamainternmed.2016.6008. - DOI - PubMed
    1. Siramshetty VB, et al. WITHDRAWN–a resource for withdrawn and discontinued drugs. Nucleic Acids Res. 2016;44:D1080–1086. doi: 10.1093/nar/gkv1192. - DOI - PMC - PubMed
    1. Pal S, Gupta R, Davuluri RV. Alternative transcription and alternative splicing in cancer. Pharmacol Ther. 2012;136:283–294. doi: 10.1016/j.pharmthera.2012.08.005. - DOI - PubMed

Publication types