. 2020 Jan 9;3(1):17.
doi: 10.1038/s42003-019-0740-8.

Mental models use common neural spatial structure for spatial and abstract content

Affiliations

Mental models use common neural spatial structure for spatial and abstract content

Katherine L Alfred et al. Commun Biol. .

Abstract

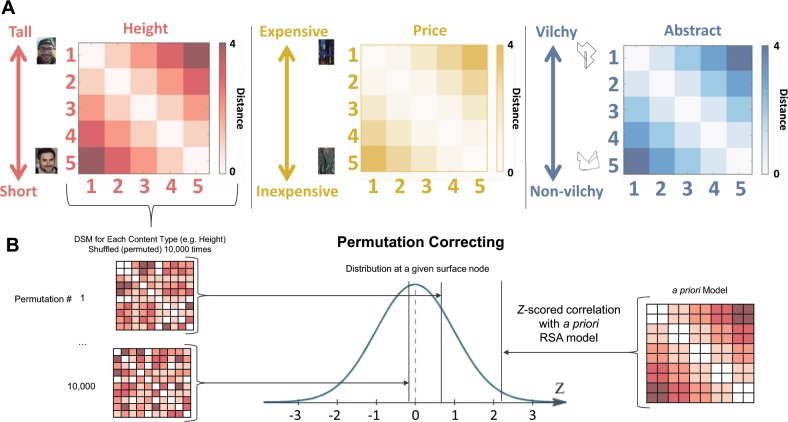
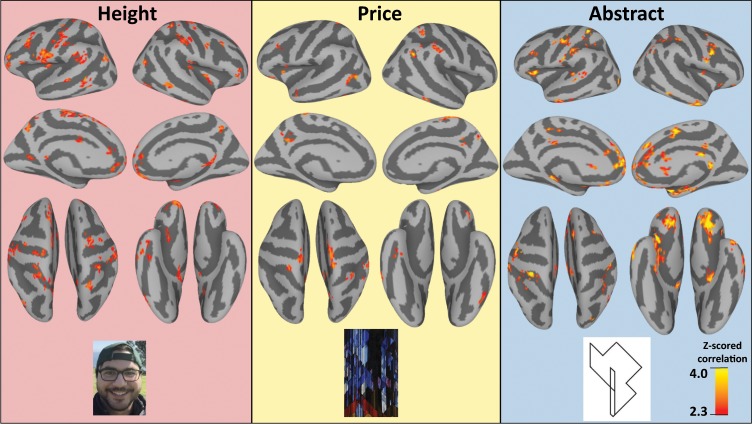
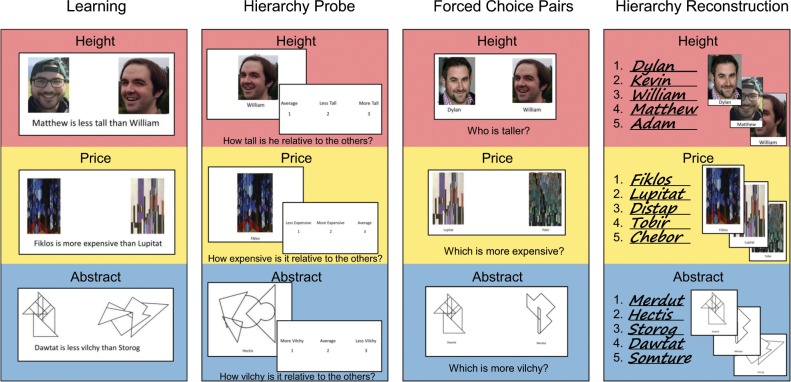
Mental models provide a cognitive framework allowing for spatially organizing information while reasoning about the world. However, transitive reasoning studies often rely on perception of stimuli that contain visible spatial features, allowing the possibility that associated neural representations are specific to inherently spatial content. Here, we test the hypothesis that neural representations of mental models generated through transitive reasoning rely on a frontoparietal network irrespective of the spatial nature of the stimulus content. Content within three models ranges from expressly visuospatial to abstract. All mental models participants generated were based on inferred relationships never directly observed. Here, using multivariate representational similarity analysis, we show that patterns representative of mental models were revealed in both superior parietal lobule and anterior prefrontal cortex and converged across stimulus types. These results support the conclusion that, independent of content, transitive reasoning using mental models relies on neural mechanisms associated with spatial cognition.


Conflict of interest statement

The authors declare no competing interests.

Figures

Fig. 1
Fig. 1. Behavioral results by task and session by content type.
All error bars display standard error (SE). a Accuracy for the Paired Forced Choice task by session. By the fMRI session, all participants had learned the hierarchies for each content type to criterion. b Spearman’s rho for the hierarchy recall by session. Though the participant-generated rankings for the Abstract content type did not correlate with the correct rankings as well as Height or Price, participants had learned the spaces well enough that they were not consistently making errors.
Fig. 2
Fig. 2
a Dissimilarity matrices for each condition. Each of the items within each content type was modeled to be 1 rank distance from its neighboring objects. The diagonal for each of the matrices is 0 and was excluded from analyses. b Method of correcting for multiple comparisons. For each content type, the dissimilarity matrix was permuted 10,000 times to create a distribution based on possible outcomes for the data. For each surface node, the actual correlation value resulting from the a priori model was z-scored using that distribution of potential correlation outcomes. This z-scored correlation value represents both correlation strength and reliability.
Fig. 3
Fig. 3. Permutation-corrected cortical surface maps for each of the representational similarity analyses by content type.
The z-scored correlations are indicative of correlation strength and reliability above the level of noise present in this dataset (permutation-corrected correlations, see Fig. 2B for further elaboration).
Fig. 4
Fig. 4. Common brain regions representing mental models across content types.
For all content-specific z-maps (Fig. 3), values below the significance threshold were removed. The three content-specific z-maps were then averaged (including 0 values for regions that did not reach significance in permutation correcting) to create the content-average map representing the common mental model structure across content types. Therefore, the z-values in this figure are averages of the permutation-corrected z-values from the content-specific maps (and as a result this scale is lower than that of Fig. 3). The average z-map was then cluster thresholded using a bootstrapped cluster significance level of p < .05, corrected (minimum area = 120 mm2), so only values within significant clusters are displayed. The full cluster list can be seen in Table 1. Inserts display the conjunction map for each of the significant clusters. Both the right IPS cluster and the left inferior frontal cortex show overlap between all three content types. This average map was overlaid on top of term-based automated meta-analysis generated using NeuroSynth (“spatial” association map). The indicated right IPS cluster is the only cluster from the previous analysis that overlaps with the NeuroSynth “spatial” association map. See note in Table 1 for explanation of average z-value calculation.
Fig. 5
Fig. 5. Overview of tasks and materials.
Each task (Learning, Hierarchy Probe, Forced Choice Pairs, and Hierarchy Reconstruction) was present in each of the three content conditions. The red area shows the version of the task with the Height condition, the green area shows the version for the Price condition, and the blue area shows the version for the Abstract condition.
Fig. 6
Fig. 6. Experimental session timeline.
All participants underwent two half-hour training sessions where they were trained on the order of the items in each content domain. Within each content type block in each training session, participants completed a set of tasks in a fixed order to learn the hierarchy and practice the tasks they would need to do in the fMRI session. In each of the blocks in the Training Sessions, participants first observed pairwise comparisons of only adjacent pairs for each content type (e.g., comparing paintings 1 and 2, and not paintings 1 and 4). Participants then completed the Hierarchy Probe, Forced Choice Pairs, and the Hierarchy Recall before proceeding to the next content block. The ordering of these tasks within each content block in the training sessions was always in this set order. Both of the training sessions were 24–48 h apart and the second training session was 24–48 h before the fMRI session. In the fMRI session, participants completed a short review of the content presented in the Learning portion of the training sessions while anatomical scans were running at the beginning. In each content block, participants completed the Hierarchy Probe and Forced Choice Pairs tasks. Out of the scanner, participants completed the Hierarchy Recall for all content types and the Post Experimental Questionnaire.
Fig. 7
Fig. 7. An example of one of the fMRI session hierarchy probe trials for the Height condition.
There was a variable length fixation period at the start of the trial (inter-trial interval), then the participant then saw the picture of one of the items they had reasoned about in training. There was another variable length fixation period, then participants were presented with a mapping of responses and button presses to respond. The mappings changed pseudo-randomly on each trial so that participants could not prepare a button response earlier in the trial. Only the 5 s period where the participant was being shown the item from the hierarchy and was considering its relative height was used in the imaging analysis. The fixation time was used as baseline for GLM comparisons of items to baseline. The button response portion of each trial was modeled as a regressor of no interest and not analyzed further.

References

    1. Johnson-Laird, P. N. Mental models and human reasoning. Proc. Natl Acad. Sci. USA107, 18243–18250 (2007). - PMC - PubMed
    1. Goel V. Anatomy of deductive reasoning. Trends Cogn. Sci. 2007;11:435–441. doi: 10.1016/j.tics.2007.09.003. - DOI - PubMed
    1. Knauff M, Fangmeier T, Ruff C, Johnson-Laird P. Reasoning, models, and images: behavioral measures and cortical activity. J. Cogn. Neurosci. 2003;15:559–573. doi: 10.1162/089892903321662949. - DOI - PubMed
    1. Knauff M. A neuro-cognitive theory of deductive relational reasoning with mental models and visual images. Spat. Cognition Comput. 2009;9:109–137. doi: 10.1080/13875860902887605. - DOI
    1. Tsujii T, Sakatani K, Masuda S, Akiyama T, Watanabe S. Evaluating the roles of the inferior frontal gyrus and superior parietal lobule in deductive reasoning: an rTMS study. NeuroImage. 2011;58:640–646. doi: 10.1016/j.neuroimage.2011.06.076. - DOI - PubMed

Publication types