. 2020 Jan 8;3(1):14.
doi: 10.1038/s42003-019-0742-6.

A method to disentangle and quantify host anabolic turnover in photosymbiotic holobionts with subcellular resolution

Affiliations

A method to disentangle and quantify host anabolic turnover in photosymbiotic holobionts with subcellular resolution

Emma Gibbin et al. Commun Biol. .

Abstract

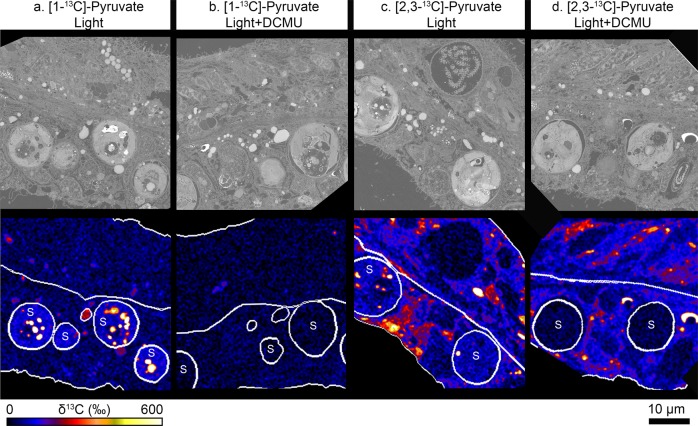
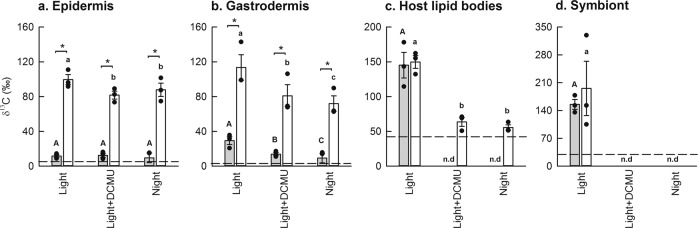
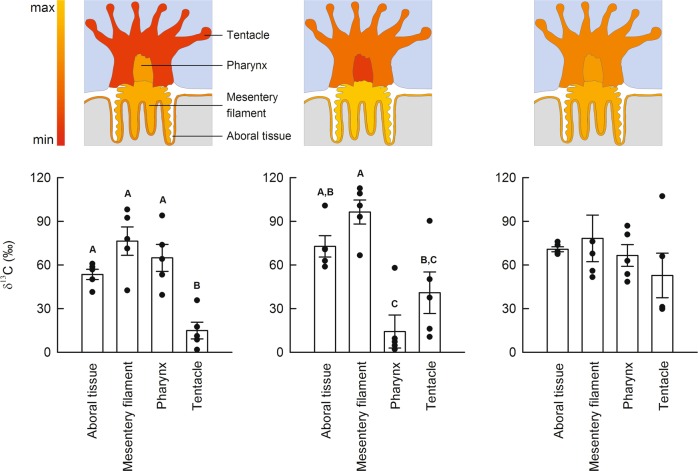
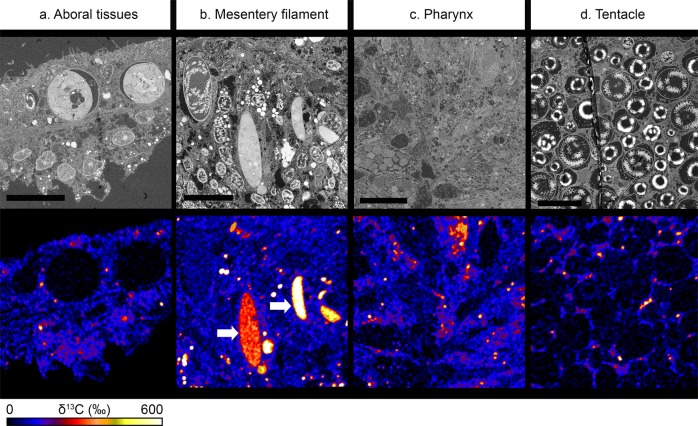
A wide range of organisms host photosynthesizing symbionts. In these animals the metabolic exchange between host and symbionts has prevented in situ host anabolic turnover to be studied without the confounding effect of translocated photosynthates. Using the symbiotic coral Stylophora pistillata as a model organism and [1-13C]-pyruvate and [2,3-13C]-pyruvate in different incubation conditions (light, light + DCMU, and darkness), we employed NanoSIMS isotopic imaging to quantify host anabolism, with and without translocated metabolites from their photosynthesizing dinoflagellate symbionts. Under our experimental conditions, host de novo lipid synthesis accounted for ~40% of the total holobiont lipid reserve, and dinoflagellate recycling of metabolic 13CO2 enhanced host tissue 13C-enrichment by 13-22% in the epidermis, 40-58% in the gastrodermis, and 135-169% in host lipid bodies. Furthermore, we show that host anabolic turnover in different tissue structures differs, in a manner consistent with the localisation, function and cellular composition of these structures.


Conflict of interest statement

The authors declare no competing interests.

Figures

Fig. 1
Fig. 1. Isolating host anabolism using position-specific 13C-labelling of pyruvate.
Corals were incubated with differentially labelled pyruvate, in the presence or absence of the photosynthetic inhibitor DCMU, for 12 h. Scanning electron microscopy (top row) images and their correlative NanoSIMS image (bottom row) are shown for corals labelled with a [1-13C]-pyruvate in the light; b [1-13C]-pyruvate in the light + DCMU; c [2,3-13C]-pyruvate in the light, and d [2,3-13C]-pyruvate in the light + DCMU. Circles labelled with ‘S’ show the position of the algal symbionts in their hosts’ oral gastrodermis, while unmarked circles show the position of host lipid bodies. Note that only a couple of host lipid bodies are circled for illustration purposes; these ROIs do not reflect the real abundance of lipids in the tissue, all of which were included in the analysis. See text for an explanation of the differential labelling patterns.
Fig. 2
Fig. 2. Quantitative analysis of anabolism following incubation with position-specific 13C-labelled pyruvate.
Shown is the relative assimilation of 13C (mean ± SE of n = 3 coral colonies) after exposure to either [1-13C]-pyruvate (grey) or [2,3-13C]-pyruvate (white), in the host epidermis a; host gastrodermis b; host lipid bodies c; and algal symbionts d. Incubations were conducted under several treatments: in the light, with and without the inhibition of photosynthesis (i.e., ±DCMU), and at night. Asterisks denote significant differences (α = 0.004) between pyruvate types, within a treatment. Majuscule letters show significant differences between treatments in corals exposed to [1-13C]-pyruvate, and lowercase letters show significant differences between treatments in corals exposed to [2,3-13C]-pyruvate. The dashed line represents the sensitivity threshold of the NanoSIMS for each region of interest (calculated as the mean + 3-sigma, of the same area in an identically prepared unlabelled control). If 13C-‘enrichments’ fell below this limit it was considered not detectable (n.d.).
Fig. 3
Fig. 3. Intra-specific variation in anabolism between structures with different biological functions in a coral polyp.
Individual polyps (n = 3) originating from corals incubated with [2,3-13C]-pyruvate in the light + DCMU treatment, were imaged to determine whether host anabolism alone (i.e., without the symbiont contribution) differs between regions of the polyp. Four regions of interest were identified: aboral tissue layers, mesentery filaments, pharynx and tentacle. The relative anabolic assimilation of 13C (denoted by majuscule letters) differed substantially between regions of interest within individual polyps. Shown are schematic representations of the allocation of 13C (expressed relative to the highest enrichment level measured) and the quantitative data (mean ± SE, n = 5 images per structure per colony).
Fig. 4
Fig. 4. Cellular-level resolution in anabolism within structures of the coral polyp.
Four regions of interest were identified in the coral polyp: the aboral tissue layers a, mesentery filaments b, pharynx c, and tentacle d. These regions were first imaged by scanning electron microscopy and then by NanoSIMS imaging. The heterogeneity of the labelling shows that there is differential anabolic activity at the level of tissue and cells. Note the localized accumulation of [2,3-13C]-pyruvate-derived 13C in secretory-type cells in the mesentery filaments (white arrows, only present in panel b). Scale bar represents 10 µm.

References

    1. Akram M. Citric acid cycle and role of its intermediates in metabolism. Cell Biochem. Biophys. 2014;68:475–478. doi: 10.1007/s12013-013-9750-1. - DOI - PubMed
    1. Belitsky, B. R. Bacillus subtilis and its closest relatives: from genes to cells. In Biosynthesis of Amino acids of the Glutamate and Aspartate Families, Alanine, and Polyamines (eds Sonenshein, A. L., Hoch, J. A. & Losick, R.) 203–231 (American Society of Microbiology, Washington, DC, 2002).
    1. Hoppe P, Cohen S, Meibom A. NanoSIMS: technical aspects and applications in cosmochemistry and biological geochemistry. Geostand. Geoanal. Res. 2003;37:111–154. doi: 10.1111/j.1751-908X.2013.00239.x. - DOI
    1. Nuñez J, Renslow R, Cliff JB, III, Anderton CR. NanoSIMS for biological applications: current practices and analyses. Biointerphases. 2018;13:03B301. doi: 10.1116/1.4993628. - DOI - PubMed
    1. Takado Y, et al. Imaging the time-integrated cerebral metabolic activity with subcellular resolution through nanometer-scale detection of biosynthetic products deriving from 13C-glucose. J. Chem. Neuroanat. 2015;69:7–12. doi: 10.1016/j.jchemneu.2015.09.003. - DOI - PubMed

Publication types