. 2020 Mar 18;48(5):2372-2387.
doi: 10.1093/nar/gkz1214.

Artificial escape from XCI by DNA methylation editing of the CDKL5 gene

Affiliations

Artificial escape from XCI by DNA methylation editing of the CDKL5 gene

Julian A N M Halmai et al. Nucleic Acids Res. .

Abstract

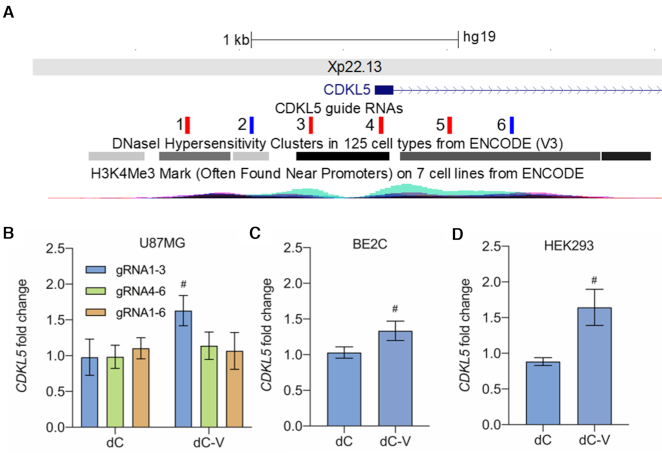
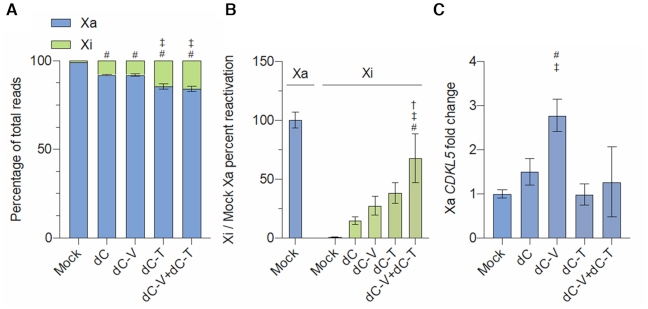
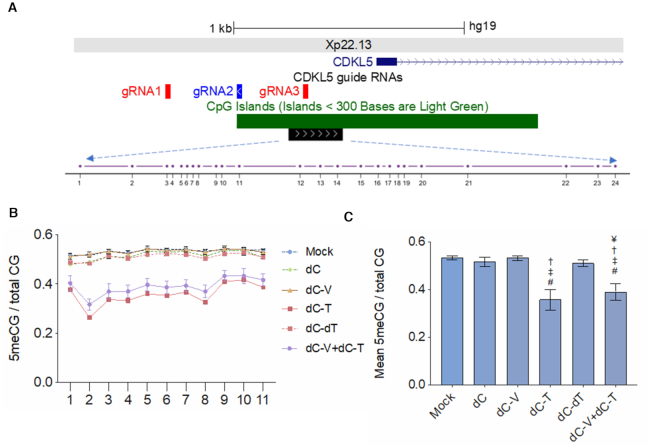
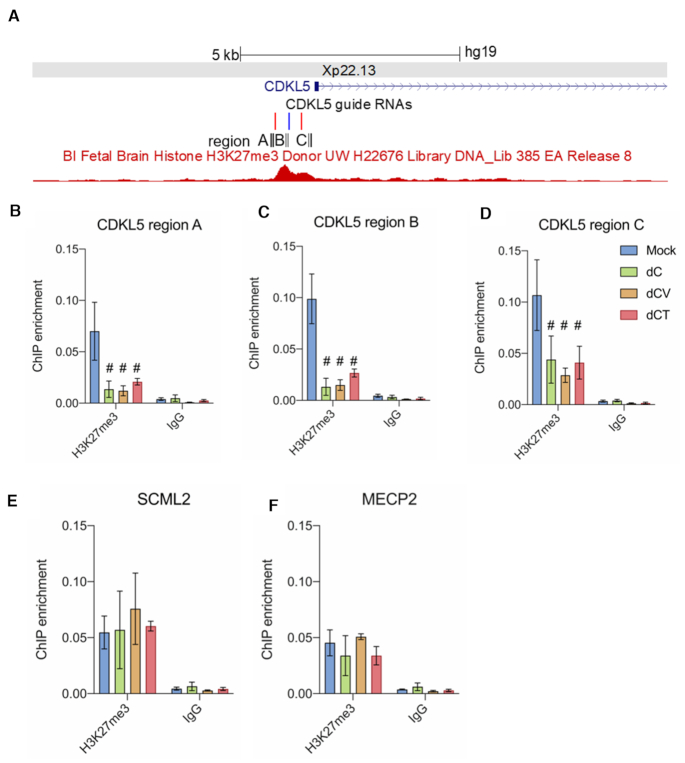
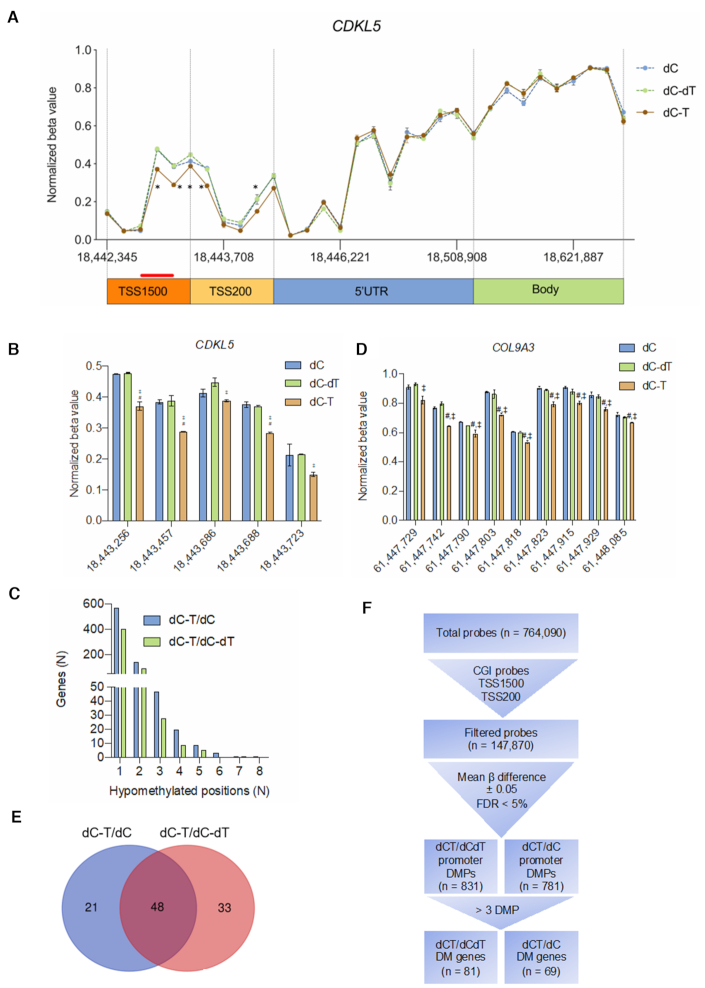
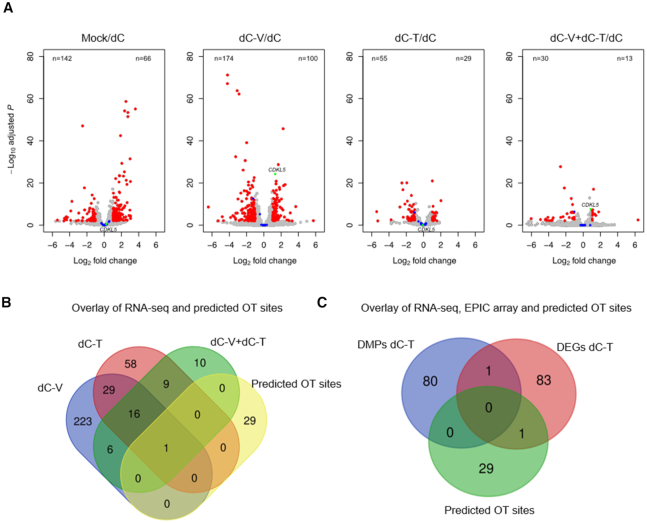
A significant number of X-linked genes escape from X chromosome inactivation and are associated with a distinct epigenetic signature. One epigenetic modification that strongly correlates with X-escape is reduced DNA methylation in promoter regions. Here, we created an artificial escape by editing DNA methylation on the promoter of CDKL5, a gene causative for an infantile epilepsy, from the silenced X-chromosomal allele in human neuronal-like cells. We identify that a fusion of the catalytic domain of TET1 to dCas9 targeted to the CDKL5 promoter using three guide RNAs causes significant reactivation of the inactive allele in combination with removal of methyl groups from CpG dinucleotides. Strikingly, we demonstrate that co-expression of TET1 and a VP64 transactivator have a synergistic effect on the reactivation of the inactive allele to levels >60% of the active allele. We further used a multi-omics assessment to determine potential off-targets on the transcriptome and methylome. We find that synergistic delivery of dCas9 effectors is highly selective for the target site. Our findings further elucidate a causal role for reduced DNA methylation associated with escape from X chromosome inactivation. Understanding the epigenetics associated with escape from X chromosome inactivation has potential for those suffering from X-linked disorders.


Figures

Figure 1.
Figure 1.
Programmable transcription of the CDKL5 gene. (A) UCSC genome browser snapshot of the target sites of the six sgRNAs directed against the CDKL5 promoter on Xp22.13. DNase hypersensitive sites and H3K4me3, often found near promoters are derived from ENCODE. Sense sgRNAs are shown in blue, antisense sgRNAs in red. (B) CDKL5 mRNA fold change relative to mock-treated cells in U87MG cells determined by RT-qPCR resulting from programmable transcription using a dCas9-no effector (dC) or dCas9-VP64 (dC-V) in combination with different pools of three to six sgRNAs targeted to the CDKL5 promoter 48 h after transient transfection. #Significantly different from dCas9 sgRNAs 1–3, n = 3 independent experiments, Tukey's HSD, P < 0.05. (C) CDKL5 mRNA fold change relative to mock-treated cells in BE2C determined by RT-qPCR resulting from programmable transcription using dCas9-no effector or dCas9-VP64 co-expressed with sgRNAs 1–3 48 h after transient transfection. (D) CDKL5 mRNA fold change relative to mock-treated cells in Lenti-X 293T determined by RT-qPCR resulting from programmable transcription using dCas9-no effector or dCas9-VP64 co-expressed with sgRNAs 1–3 48 h after transient transfection. #Significantly different from dCas9 sgRNAs 1–3, n = 3 independent experiments, Student's t-test P <0.05.
Figure 2.
Figure 2.
Targeted reactivation of CDKL5 from the inactive X allele. (A) Allele specific read counts for the mRNA expression of the active (Xa) or inactive (Xi) CDKL5 allele of mock-treated SH-SY5Y or after constitutive expression of dCas9 effector domains dCas9 (dC), dCas9-VP64 (dC-V), dCas9-TET1CD (dC-T) or a combination of dCas9-VP64 and dCas9-TET1CD (dC-V+dC-T) and sgRNAs 1–3 after 21 days post-transduction. #Significantly different from mock-treated, significantly different from dCas9, n = 3 independent experiments, Tukey's HSD, P < 0.05. (B) Relative Xi CDKL5 mRNA expression of mock-treated or stably transduced SH-SY5Y relative to CDKL5 Xa mRNA expression of mock-treated cells as determined by allele-specific RT-qPCR after 21 days post-transduction. #Significantly different from dC, significantly different from dC-V, significantly different from dC-T, n = 3 independent experiments, Tukey's HSD, P < 0.05 (C) Relative Xa CDKL5 mRNA expression in mock-treated and stably transduced SH-SY5Y cells determined by allele-specific RT-qPCR after 21 days post-transduction. #Significantly different from mock-treated, significantly different from dCas9, n = 3 independent experiments, Tukey's HSD, all P < 0.05.
Figure 3.
Figure 3.
dCas9-TET1CD causes removal of DNA methylation from the CDKL5 CGI promoter. (A) UCSC genome browser snapshot of the target sites of sgRNAs 1–3 directed against the CDKL5 promoter on Xp22.13 and a large CpG Island (>1 kb) spanning the transcriptional start site of CDKL5. The black box represents a >200 bp region assessed for targeted DNA methylation changes containing 24 individual CpG dinucleotides (drawn to scale). (B) 5-methylcytosine levels in a CpG context (5meCG) over total CpG context as assessed by targeted bisulfite sequencing across 11 CpG dinucleotides in mock-treated cells or cells transduced to constitutively express dCas9-no effector (dC) or dCas9 fused to either VP64 (dC-V) or TET1CD (dC-T), a combination thereof (dC-V+dC-T) or a catalytically inactive TET1CD (dC-dT). X-axis depicts the individual CpG position relative to the amplicon (not drawn to scale). (C) Mean 5-methylcytosine levels in a CpG context over all 11 CpG dinucleotides in all treatment groups. #Significantly different from mock-treated cells, significantly different from dCas9, significantly different from dC-dT, ¥significantly different from dC-T, n = 3 independent experiments, Tukey's HSD, all P < 0.05.
Figure 4.
Figure 4.
Depletion of the XCI hallmark histone modification H3K27me3. (A) UCSC genome browser snapshot of the target sites of sgRNAs 1–3 directed against the CDKL5 promoter on Xp22.13 and H3K27me3 peaks derived from ENCODE. Black boxes show the regions assessed by ChIP-qPCR. (B) Input normalized H3K27me enrichment levels determined by ChIP-qPCR in region A of the CDKL5 promoter in mock-treated cells or cells transduced to constitutively express dCas9-no effector (dC) or dCas9 fused to either VP64 (dC-V) or TET1CD (dC-T). (C) Input normalized H3K27me enrichment levels determined by ChIP-qPCR in region B of the CDKL5 promoter. (D) Input normalized H3K27me enrichment levels determined by ChIP-qPCR in region C of the CDKL5 promoter. (E) Input normalized H3K27me enrichment levels determined by ChIP-qPCR in the promoter of the nearest neighboring gene promoter, SCML2. (F) Input normalized H3K27me enrichment levels determined by ChIP-qPCR in the promoter of a distal gene, MECP2, that serves as a negative control. #Significantly different from mock-treated cells, n = 3 independent experiments, P < 0.05.
Figure 5.
Figure 5.
Global DNA hypomethylation due to constitutive dCas9-TET1CD expression. (A) Thirty-two CpG positions shown with their respective location on the X-chromosome (hg19) from the 850K MethylationEPIC array across the CDKL5 promoter were used to assess gene-wide changes in DNA methylation levels represented as changes in the beta value of the TSS200, TSS1500, 5′UTR and gene body of CDKL5. After transduction with dCas9-no effector (dC), dCas9-TET1CD (dC-T) and a catalytically inactive TET1CD (dC-dT), we found reduced DNA methylation levels in the TSS1500 and TSS200 region of cells transduced with dCas9-TET1CD. The red line demonstrates the sgRNA binding sites in the CDKL5 promoter. *Significantly differentially methylated positions for further assessment. (B) Side-by-side assessment of significantly differentially methylated positions in the CDKL5 promoter with a mean difference in beta value of <0.05. #Significantly different from dC, significantly different from dC-dT, n = 2 independent experiments, FDR < 5%. (C) Histogram of the number of genes by the number of significantly hypomethylated sites of dCas9-TET1CD transduced cells when compared to dCas9 or a catalytically inactive TET1 fused to dCas9 demonstrates that the majority of genes shows only a single probe falling within the respective promoter region. (D) Side-by-side assessment of significantly differentially methylated positions in the COL9A3 promoter with a mean difference in beta value of <0.05. #Significantly different from dC, significantly different from dC-dT, n = 2 independent experiments, FDR < 5%. (E) Venn diagram of shared genes between dCas9-TET1CD comparisons with dCas9 or a catalytically inactive TET1CD mutant shows an overlap of 48 genes between the two groups. (F) A flow chart diagram representing the analysis pipeline for genome-wide methylation effects of dCas9-TET1CD, starting from a total number of probes, down to significantly differentially methylated sites and ultimately differentially methylated genes.
Figure 6.
Figure 6.
Off-target analysis of CRISPR/dCas9 effectors by RNA-seq. (A) Volcano plot of significance (FDR adjusted P value) versus fold change for differential DESeq2 expression analysis of mock-treated, dCas9-VP64 (dC-V), dCas9-TET1CD (dC-T) or dCas9-VP64 and dCas9-TET1CD (dC-V+dC-T) guided by sgRNAs 1–3 to the CDKL5 promoter compared to a dCas9-no effector control (dC). Differentially expressed genes are highlighted in red (FDR < 1%, log fold change >1), predicted CRISPR off-target sites are highlighted in blue and the CDKL5 target gene is highlighted in green. The number of downregulated genes is found in the upper left of each panel, the number of upregulated genes is found in the upper right of each panel. (B) Venn diagram showing the overlap of differentially expressed genes between all conditions and the putative off-target list. A single gene, CNTNAP2 is shared between all four groups as a putative off-target. (C) Venn diagram showing the overlap between differentially expressed genes and differentially methylated positions identified in a comparison between dCas9-TET1CD and dCas9 and potential CRISPR off-targets.

References

    1. Cavalli G., Heard E.. Advances in epigenetics link genetics to the environment and disease. Nature. 2019; 571:489–499. - PubMed
    1. Allshire R.C., Madhani H.D.. Ten principles of heterochromatin formation and function. Nat. Rev. Mol. Cell Biol. 2017; 19:229. - PMC - PubMed
    1. Bonev B., Cavalli G.. Organization and function of the 3D genome. Nat. Rev. Genet. 2016; 17:661–678. - PubMed
    1. Horvath S. DNA methylation age of human tissues and cell types. Genome Biol. 2013; 14:R115. - PMC - PubMed
    1. Feinberg A.P. The key role of epigenetics in human disease prevention and mitigation. N. Engl. J. Med. 2018; 378:1323–1334. - PMC - PubMed

Publication types

MeSH terms