. 2020 May;41(7):1754-1764.
doi: 10.1002/hbm.24907. Epub 2020 Jan 10.

Measurement of ultra-fast signal progression related to face processing by 7T fMRI

Affiliations

Measurement of ultra-fast signal progression related to face processing by 7T fMRI

Uk-Su Choi et al. Hum Brain Mapp. 2020 May.

Abstract

Given that the brain is a dynamic system, the temporal characteristics of brain function are important. Previous functional magnetic resonance imaging (fMRI) studies have attempted to overcome the limitations of temporal resolution to investigate dynamic states of brain activity. However, finding an fMRI method with sufficient temporal resolution to keep up with the progress of neuronal signals in the brain is challenging. This study aimed to detect between-hemisphere signal progression, occurring on a timescale of tens of milliseconds, in the ventral brain regions involved in face processing. To this end, we devised an inter-stimulus interval (ISI) stimulation scheme and used a 7T MRI system to obtain fMRI signals with a high signal-to-noise ratio. We conducted two experiments: one to measure signal suppression depending on the ISI and another to measure the relationship between the amount of suppression and the ISI. These two experiments enabled us to measure the signal transfer time from a brain region in the ventral visual stream to its counterpart in the opposite hemisphere through the corpus callosum. These findings demonstrate the feasibility of using fMRI to measure ultra-fast signals (tens of milliseconds) and could facilitate the elucidation of further aspects of dynamic brain function.

Keywords: fMRI; inter-stimulus interval; interhemispheric transfer time.


Figures

Figure 1
Figure 1
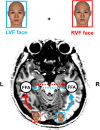
Flow of signal input to FFA from the visual fields. A face shown in the left visual field is projected into the right V1, and the signal is passed up to the right FFA (sky‐blue solid line) and also transferred to the left FFA (sky‐blue dotted line). In the same way, the face shown in the right visual field is projected into the left V1 and then passed up to the left FFA (red solid line) and the right FFA (red dotted line). LVF indicates the left visual hemifield and RVF indicates the right visual hemifield. FFA, fusiform face area
Figure 2
Figure 2
A model of the actual interval between two stimuli (L and R), as seen at the right FFA. Parts (a) and (b) show the actual intervals of conditions LR and RL, respectively. The actual intervals at the right FFA vary depending on the order of stimulation in the stimulus pair because of the transfer time (IHTT) between hemispheres. The actual interval for LR is longer (a) than that for condition RL (b). As the physical interval (ISI) is the same, the subtraction of the actual interval for condition RL from the actual interval for condition LR becomes 2*IHTT in this model
Figure 3
Figure 3
Stimulus conditions in the first experiment (a) and the second experiment (b). (a) Four different conditions: L (single face stimulation in the left visual field); R (single face stimulation in the right visual field); LR (paired stimuli, first face stimulation in the left visual field and second face stimulation in the right visual field, with an ISI of 33.2 ms); and RL (paired stimuli, first face stimulus in the right visual field and second face stimulus in the left visual field, with an ISI of 33.2 ms). (b) Four different conditions: L (single face stimulus in the left visual field) and LLs (paired face stimuli presented at the same location of the left visual field with ISIs of 16.6, 33.2, and 49.8 ms). ISI, inter‐stimulus interval
Figure 4
Figure 4
Target ROIs of the right OFA (a), the left OFA (b), the right FFA (c), and the left FFA (d), which were identified by the localization experiment: an example from one subject. In the first experiment, the right FFAs from 22 subjects, the left FFAs from 21 subjects, the right OFAs from 13 subjects, and the left OFAs from 13 subjects were identified (p < .05, FDR corrected). In the second experiment, the right FFAs from 12 subjects, the left FFAs from 11 subjects, the right OFAs from 12 subjects, and the left OFAs from nine subjects were identified (p < .05, FDR corrected). FFA, fusiform face area; OFA, occipital face area
Figure 5
Figure 5
Estimated beta values from the first experiment in the OFA and FFA of both hemispheres. The only significant difference was between LR and RL in the right FFA. ** indicates p < .01 after correction for multiple comparisons. Error bars indicate the standard error of the mean. FFA, fusiform face area; OFA, occipital face area
Figure 6
Figure 6
Estimated beta values from the second experiment in the FFA of the right hemisphere. There were significant differences between LL16.6 and LL49.8. * indicates p < .05 after correction for multiple comparisons. Error bars indicate the standard error of the mean. FFA, fusiform face area
Figure 7
Figure 7
The right V1 identified by the localization experiment in the first experiment (a). Estimated beta value from the right V1 (b). The V1s from 22 subjects (p < .05, FDR corrected). The dotted white line in (a) indicates a calcarine sulcus in V1. *** indicates p < .001 after correction for multiple comparisons. Error bars indicate the standard error of the mean
Figure 8
Figure 8
Comparison of the suppression ratio for the bilaterally presented stimuli with a transfer time of zero; that is, including only the “physical interval LR” or “physical interval RL” with an ISI of 33.2 ms (physical interval 33.2 ms), and the stimuli presented at the same locations (ISI 33.2 ms). There was no significant difference between them (p = .88, two‐sample t test). The notation n.s. indicates that the difference is not significant
Figure 9
Figure 9
Comparison of beta values for stimulus condition L at the right V1 between the first and second experiments (p = .59). The notation n.s. indicates that the difference is not significant

Similar articles

References

    1. Baldauf, D. , & Desimone, R. (2014). Neural mechanisms of object‐based attention. Science, 344, 424–427. http://science.sciencemag.org/content/344/6182/424 - PubMed
    1. Barca, L. , Cornelissen, P. , Simpson, M. , Urooj, U. , Woods, W. , & Ellis, A. W. (2011). The neural basis of the right visual field advantage in reading: An MEG analysis using virtual electrodes. Brain Lang, 118, 53–71. http://www.sciencedirect.com/science/article/pii/S0093934X10001495 - PubMed
    1. Barnett, K. J. , & Corballis, M. C. (2005). Speeded right‐to‐left information transfer: The result of speeded transmission in right‐hemisphere axons? Neuroscience Letters, 380, 88–92. http://www.sciencedirect.com/science/article/pii/S0304394005000637 - PubMed
    1. Bayard, S. , Gosselin, N. , Robert, M. , & Lassonde, M. (2004). Inter‐ and intra‐hemispheric processing of visual event‐related potentials in the absence of the corpus callosum. Journal of Cognitive Neuroscience, 16, 401–414. 10.1162/089892904322926746 - DOI - PubMed
    1. Brown, W. S. , Larson, E. B. , & Jeeves, M. A. (1994). Directional asymmetries in interhemispheric transmission time: Evidence from visual evoked potentials. Neuropsychologia, 32, 439–448. http://www.sciencedirect.com/science/article/pii/0028393294900892 - PubMed

Publication types