. 2020 Mar 18;105(6):975-991.e7.
doi: 10.1016/j.neuron.2019.12.015. Epub 2020 Jan 8.

Deep Multilayer Brain Proteomics Identifies Molecular Networks in Alzheimer's Disease Progression

Affiliations

Deep Multilayer Brain Proteomics Identifies Molecular Networks in Alzheimer's Disease Progression

Bing Bai et al. Neuron. .

Erratum in

  • Deep Multilayer Brain Proteomics Identifies Molecular Networks in Alzheimer's Disease Progression.
    Bai B, Wang X, Li Y, Chen PC, Yu K, Dey KK, Yarbro JM, Han X, Lutz BM, Rao S, Jiao Y, Sifford JM, Han J, Wang M, Tan H, Shaw TI, Cho JH, Zhou S, Wang H, Niu M, Mancieri A, Messler KA, Sun X, Wu Z, Pagala V, High AA, Bi W, Zhang H, Chi H, Haroutunian V, Zhang B, Beach TG, Yu G, Peng J. Bai B, et al. Neuron. 2020 May 20;106(4):700. doi: 10.1016/j.neuron.2020.04.031. Neuron. 2020. PMID: 32437656 Free PMC article. No abstract available.

Abstract

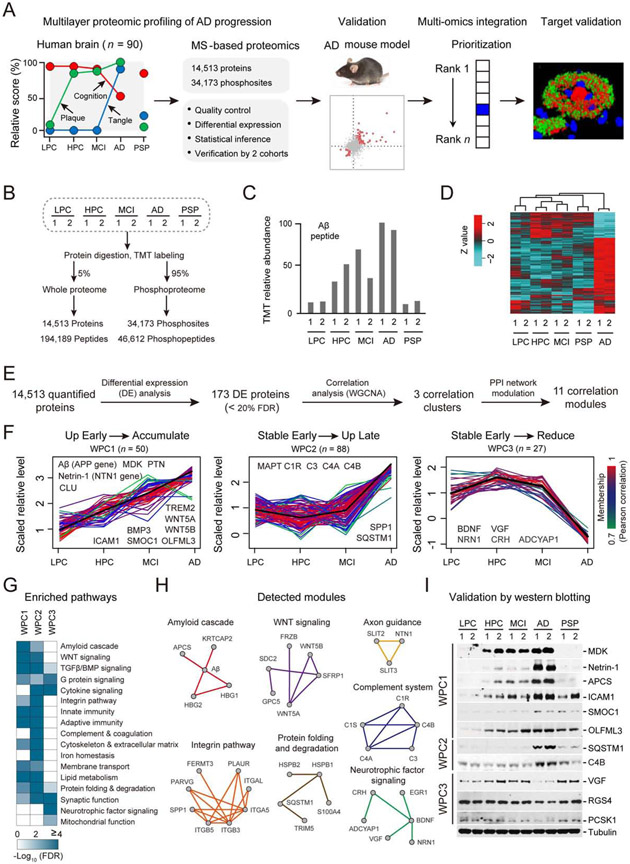
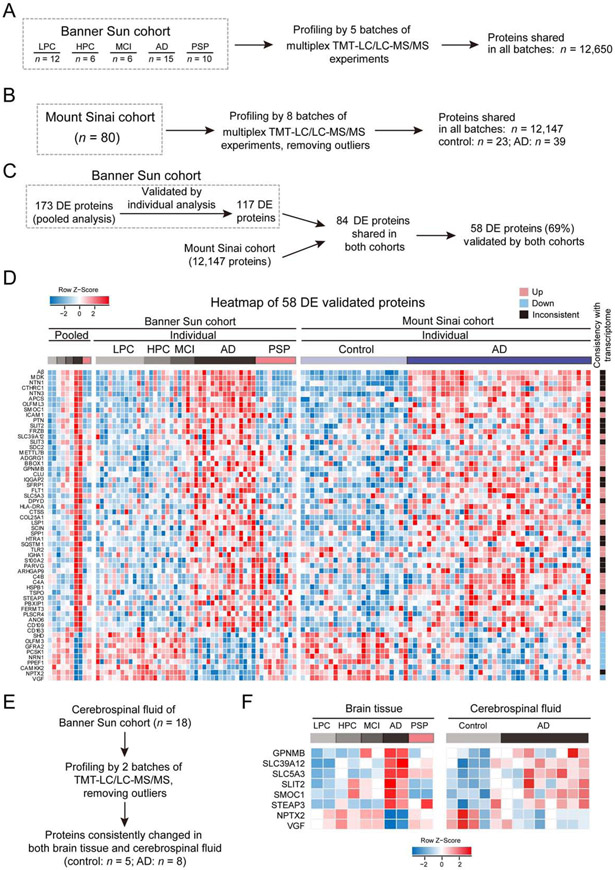
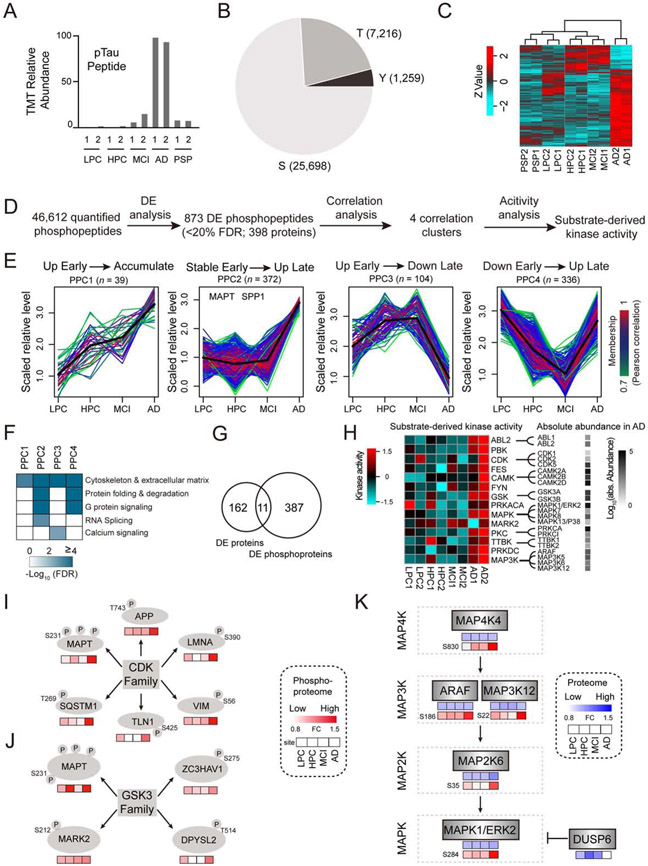
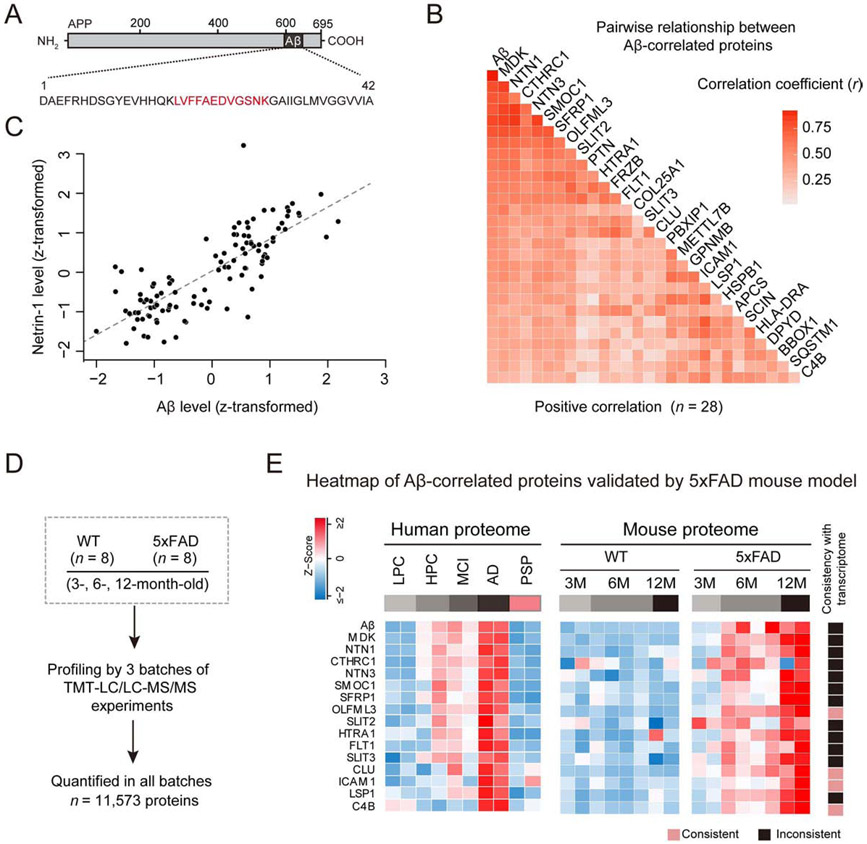
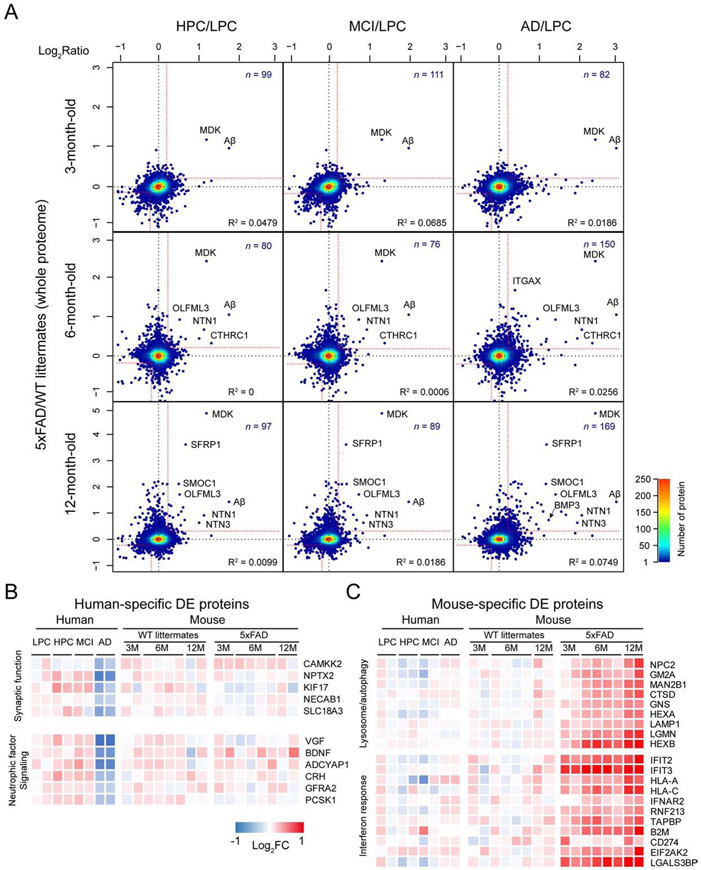
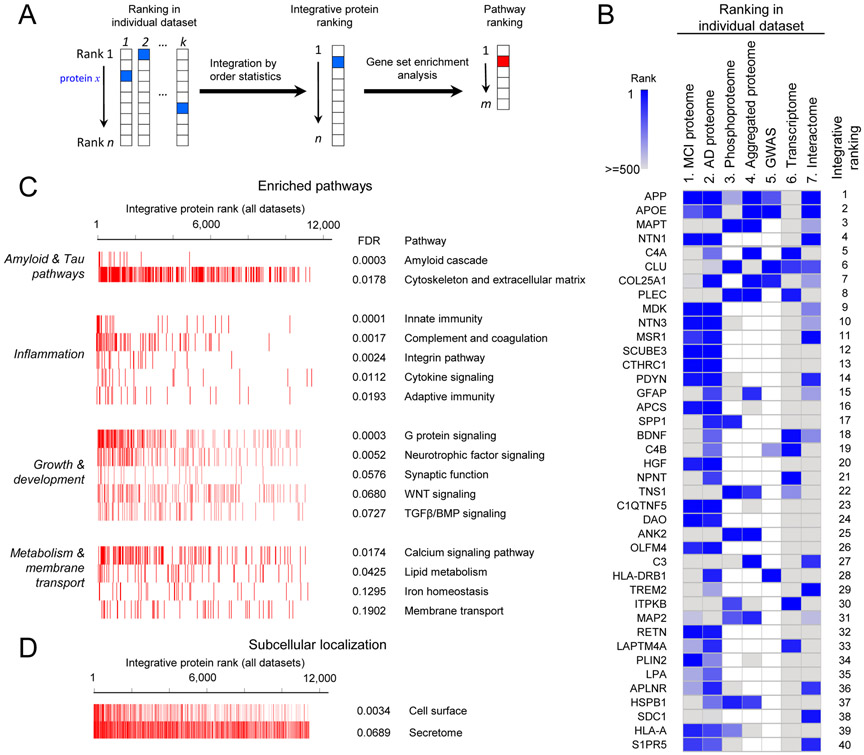
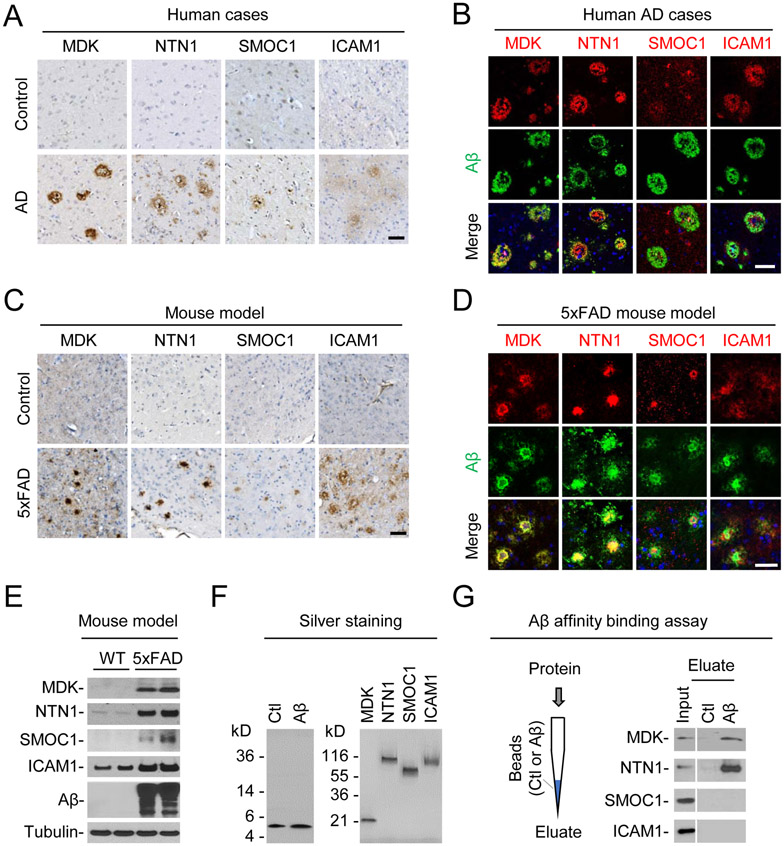
Alzheimer's disease (AD) displays a long asymptomatic stage before dementia. We characterize AD stage-associated molecular networks by profiling 14,513 proteins and 34,173 phosphosites in the human brain with mass spectrometry, highlighting 173 protein changes in 17 pathways. The altered proteins are validated in two independent cohorts, showing partial RNA dependency. Comparisons of brain tissue and cerebrospinal fluid proteomes reveal biomarker candidates. Combining with 5xFAD mouse analysis, we determine 15 Aβ-correlated proteins (e.g., MDK, NTN1, SMOC1, SLIT2, and HTRA1). 5xFAD shows a proteomic signature similar to symptomatic AD but exhibits activation of autophagy and interferon response and lacks human-specific deleterious events, such as downregulation of neurotrophic factors and synaptic proteins. Multi-omics integration prioritizes AD-related molecules and pathways, including amyloid cascade, inflammation, complement, WNT signaling, TGF-β and BMP signaling, lipid metabolism, iron homeostasis, and membrane transport. Some Aβ-correlated proteins are colocalized with amyloid plaques. Thus, the multilayer omics approach identifies protein networks during AD progression.

Keywords: Alzheimer’s disease; biomarker; cerebrospinal fluid; genomics; mass spectrometry; multi-omics; phosphoproteome; proteome; proteomics; systems biology.


Conflict of interest statement

Declaration of Interests The authors declare no competing interests.

Figures

Figure 1.
Figure 1.. Whole proteome profiling of AD progression reveals disease stage-dependent proteins/pathways.
(A) Strategy for multilayer profiling of proteome and phosphoproteome in AD cases and the 5xFAD mouse model, and multi-omics data integration. The y-axis shows the relative pathology scores for cognition, plaque, and tangle. (B) Summary of temporal profiling of five groups of human brain tissue, with each group containing two independent pools. Each pool contained samples from 9 cases. (C) MS data showing the Aβ level in each group. The relative TMT intensities of the Aβ peptide are shown. (D) Clustering analysis of the proteomics dataset based on the changed proteins. The TMT intensities (log2 Z-score transformed) of each protein (rows) across five disease groups (columns) are indicated in a colored scale. (E) Bioinformatics pipeline for identifying DE proteins followed by clustering and module analyses. (F) Three major clusters (WPC1-3) of DE proteins defined by the WGCNA program. Each line represent one protein. The intensity of each protein is log2 Z-score transformed (mean-centered and scaled by standard deviation). The line color indicates the degree of pattern correlation between each protein and eigenvalue of the cluster. Proteins discussed in the text are shown. (G) Enriched pathways in the WPC proteins by Fisher’s Exact Test. Significantly enriched pathways (FDR < 20%) are shown. (H) Detected PPI modules in WPCs. (I) Validation of selected DE proteins by western blotting with the loading control (tubulin). See also Figure S1-S3 and Data S1-S3.
Figure 2.
Figure 2.. Validation of AD-related proteins by profiling individual human samples in both Banner Sun and Mount Sinai cohorts
(A) Analysis of Banner Sun individual cohort. A total of 49 Banner Sun individual cases were measured with TMT-LC/LC-MS/MS in 5 batches. (B) Analysis of 80 human cases from Mount Sinai cohort. After removing outliers, 62 cases (23 controls and 39 AD cases) were analyzed. (C) Bioinformatics pipeline for validating DE proteins by individual cases from two cohorts. (D) Validated DE proteins in three datasets (Banner Sun pooled samples, Banner Sun individual samples, and Mount Sinai individual samples). Each protein is represented by a colored box after log2 Z-score conversion. The heat map on the far right indicates consistent (up or down) or inconsistent changes between proteome and transcriptome. (E) Analysis of CSF samples from Banner Sun cohort. After removing outliers, 5 controls and 8 AD cases were analyzed. (F) Consistent protein changes of 8 proteins in AD brain tissue and CSF. See also Figure S4 and Data S4.
Figure 3.
Figure 3.. Profiling of protein phosphorylation events in AD.
(A) Measurements of Tau phosphorylation by MS. The relative TMT intensities of a phosphor-Tau peptide in five disease groups are shown. (B) Distribution of phospho-Ser/Thr/Tyr in the identified phosphosites. (C) Clustering analysis of the altered phosphopeptides in human samples. The TMT intensities (log2 Z-score transformed) of phosphopeptides (rows) across five disease groups (columns) are indicated in a colored scale. (D) Bioinformatics pipeline for identifying DE phosphopeptides, clustering analysis, and kinase activity analysis. (E) Four major phosphoproteome clusters (PPC1-4) of DE phosphopeptides by WGCNA. Each line represents one phosphopeptide. The line color indicates the degree of pattern correlation between each phosphopeptide and eigenvalue of the cluster. Phosphoproteins discussed in the text are shown. (F) Enriched pathways among the PPC proteins by Fisher’s Exact Test. Significantly enriched pathways (FDR < 20%) are shown. (G) Overlap of DE proteome and phosphoproteome. (H) Kinase activities computed from related substrates by the IKAP algorithm, with the absolute abundance of kinase family members shown in a black to white gradient. (I-J) Substrate phosphorylation levels of specific kinases in four groups of AD samples. The levels of each phosphosite in the four disease groups (LPC, HPC, MCI and AD) are represented by boxes filled with red gradients. FC: fold change. (K) Potential activation of the MAPK pathway based on MS measurements of the whole proteome and phosphoproteome. The levels of each protein and its phosphosites in the four groups of human samples (LPC, HPC, MCI and AD) are represented by boxes filled with red and blue gradients, respectively. The missing values are shown in white boxes. See also Figure S5, Data S2 and Data S5.
Figure 4.
Figure 4.. Aβ-correlated proteins in AD and the 5xFAD mouse model.
(A) Measurement of Aβ by MS based on its tryptic peptide (red). (B) Correlation analysis of Aβ and DE proteins in 121 human cases. The degree of correlation was assessed by Pearson correlation coefficients and corresponding p values. Proteins were ranked by correlation coefficient values (p < 0.001). (C) An example protein correlates well with Aβ. The MS measured intensities in samples were Z-transformed (i.e. mean-centered and scaled by standard deviation). (D) Analysis of whole proteome in 5xFAD (3, 6, 12 months of age). (E) human Aβ-correlated proteins validated in 5xFAD, represented by colored boxes after Z score conversion. The heat map on the far right indicates consistent and inconsistent changes between proteome and transcriptome in the mice. See also Data S6.
Figure 5.
Figure 5.. Human-mouse proteomic comparison.
(A) Whole proteome comparison between human cases and 5xFAD. The human HPC, MCI, and AD data were normalized by LPC, while the 5xFAD results were normalized by WT. Each dot represents one protein, and the color shows the dot density. Proteins with consistent changes are shown in the up-right and down-left corners separated by red cutoff lines. (B) Examples of enriched pathways for human-specific DE proteins. The value of fold-change is indicated by a colored scale. (C) Examples of activated pathways for 5xFAD-specific DE proteins. See also Data S6.
Figure 6.
Figure 6.. Prioritization of proteins/genes in AD by multi-omics.
(A) Strategy for ranking proteins and pathways. The proteins were first sorted by integrated order statistics, and were then used for pathway ranking by gene set enrichment analysis. (B) The ranking list by combining 7 datasets. In the interactome, each protein was scored by its distance to the proteins encoded by known AD genes (APP, PSEN1/2, APOE, TREM2, and UNC5C). The integrative ranks of top 40 proteins are shown by boxes of two color gradient, while missing values are indicated by white boxes. (C) Pathway enrichment by GSEA, categorized into four groups. The bar-code plot indicates the position of the proteins on the sorted rank. (D) Protein enrichment by subcellular localization. See also Data S7.
Figure 7.
Figure 7.. Characterization of selected protein targets in AD and 5xFAD.
(A) Immunohistochemistry in human brain sections of control and AD cases (frontal cortex). Immunoreactivity was developed with DAB chromogen (brown), with counterstaining of hematoxylin for nuclei (blue). Scale bar: 50 μm. (B) Immunofluorescence labeling in AD brain sections of the selected proteins (red), Aβ (green) and nuclei (blue by DAPI). Scale bar: 50 μm. (C) Immunohistochemistry of the selected proteins in WT and 5xFAD mice (12 month old). Scale bar = 50 μm. (D) Immunofluorescence labeling of selected proteins (red), Aβ (green) and nuclei (blue by DAPI) in 5xFAD cortex (12 month old). Scale bar: 50 μm. (E) Western blotting in WT and 5xFAD samples (12 month old, hippocampus). (F) Silver staining of Aβ40 and scramble (Ctl) peptides and human recombinant proteins. (G) Affinity binding assay between Aβ40 and the recombinant proteins. Aβ40 and scramble (Ctl) peptides were biotinylated and bound to streptavidin beads packed in mini-columns. Individual recombinant proteins were loaded on the columns, followed by wash and elution. The input and eluate were analyzed by western blotting. See also Figure S6.

References

    1. Aebersold R, and Mann M (2016). Mass-spectrometric exploration of proteome structure and function. Nature 537, 347–355. - PubMed
    1. Aerts S, Lambrechts D, Maity S, Van Loo P, Coessens B, De Smet F, Tranchevent LC, De Moor B, Marynen P, Hassan B, et al. (2006). Gene prioritization through genomic data fusion. Nat Biotechnol 24, 537–544. - PubMed
    1. Allen M, Carrasquillo MM, Funk C, Heavner BD, Zou F, Younkin CS, Burgess JD, Chai HS, Crook J, Eddy JA, et al. (2016). Human whole genome genotype and transcriptome data for Alzheimer's and other neurodegenerative diseases. Sci Data 3, 160089. - PMC - PubMed
    1. Allison DB, Cui X, Page GP, and Sabripour M (2006). Microarray data analysis: from disarray to consolidation and consensus. Nat Rev Genet 7, 55–65. - PubMed
    1. Altelaar AF, Munoz J, and Heck AJ (2013). Next-generation proteomics: towards an integrative view of proteome dynamics. Nat Rev Genet 14, 35–48. - PubMed

Publication types