. 2020 Jan:29:101378.
doi: 10.1016/j.redox.2019.101378. Epub 2019 Nov 9.

7-O-Esters of taxifolin with pronounced and overadditive effects in neuroprotection, anti-neuroinflammation, and amelioration of short-term memory impairment in vivo

Affiliations

7-O-Esters of taxifolin with pronounced and overadditive effects in neuroprotection, anti-neuroinflammation, and amelioration of short-term memory impairment in vivo

Sandra Gunesch et al. Redox Biol. 2020 Jan.

Abstract

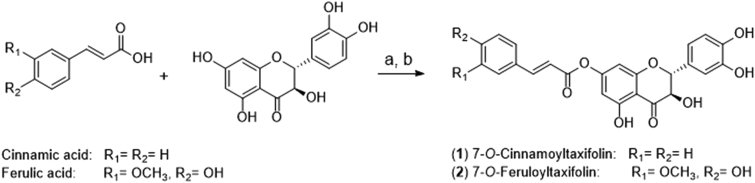
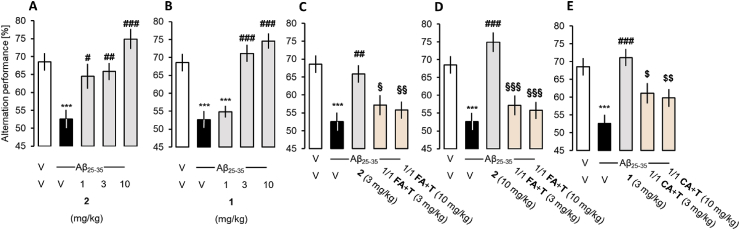
Alzheimer's disease (AD) is a multifactorial disease and the most common form of dementia. There are no treatments to cure, prevent or slow down the progression of the disease. Natural products hold considerable interest for the development of preventive neuroprotectants to treat neurodegenerative disorders like AD, due to their low toxicity and general beneficial effects on human health with their anti-inflammatory and antioxidant features. In this work we describe regioselective synthesis of 7-O-ester hybrids of the flavonoid taxifolin with the phenolic acids cinnamic and ferulic acid, namely 7-O-cinnamoyltaxifolin and 7-O-feruloyltaxifolin. The compounds show pronounced overadditive neuroprotective effects against oxytosis, ferroptosis and ATP depletion in the murine hippocampal neuron HT22 cell model. Furthermore, 7-O-cinnamoyltaxifolin and 7-O-feruloyltaxifolin reduced LPS-induced neuroinflammation in BV-2 microglia cells as assessed by effects on the levels of NO, IL6 and TNFα. In all in vitro assays the 7-O-esters of taxifolin and ferulic or cinnamic acid showed strong overadditive activity, significantly exceeding the effects of the individual components and the equimolar mixtures thereof, which were almost inactive in all of the assays at the tested concentrations. In vivo studies confirmed this overadditive effect. Treatment of an AD mouse model based on the injection of oligomerized Aβ25-35 peptide into the brain to cause neurotoxicity and subsequently memory deficits with 7-O-cinnamoyltaxifolin or 7-O-feruloyltaxifolin resulted in improved performance in an assay for short-term memory as compared to vehicle and mice treated with the respective equimolar mixtures. These results highlight the benefits of natural product hybrids as a novel compound class with potential use for drug discovery in neurodegenerative diseases due to their pharmacological profile that is distinct from the individual natural components.

Keywords: Alzheimer's disease; Flavonoids; In vivo studies; Microglia; Natural product hybrids; Phenolic acids.


Figures

Image 1
Graphical abstract
Fig. 1
Fig. 1
A) Chemical structures of the flavonolignan silibinin and the flavonoids taxifolin and quercetin. Structural differences between the natural products silibinin and taxifolin are highlighted in blue. B) Target compounds 7-O-cinnamoyltaxifolin (1) and 7-O-feruloyltaxifolin (2). (For interpretation of the references to color in this figure legend, the reader is referred to the Web version of this article.)
Scheme 1
Scheme 1
Synthesis of 7-O-cinnamoyltaxifolin (1, 43% yield) and 7-O-feruloyltaxifolin (2, 27% yield). a) acid, oxalyl chloride, DMF, dry THF, 1 h, room temperature; b) taxifolin, triethylamine, dry THF, 2 h, room temperature after addition of the respective acyl chloride.
Fig. 2
Fig. 2
Oxytosis assay in HT22 hippocampal nerve cells. 25 μM Quercetin served as a positive control (white) while 5 mM glutamate was used to induce toxicity (red). A) Neuroprotective effect of 7-O-cinnamoyltaxifolin (1) and the controls taxifolin (T), cinnamic acid (CA) and the equimolar mixture of taxifolin and cinnamic acid (T + CA). B) Neurotoxicity of the compounds taxifolin (T), cinnamic acid (CA), the one-to-one mixture (T + CA) and compound 1. C) Neuroprotective effect of 7-O-feruloyltaxifolin (2) and the controls taxifolin (T), ferulic acid (FA) and the one-to-one mixture of taxifolin and ferulic acid (T + FA). D) Neurotoxic effect of the compounds taxifolin (T), ferulic acid (FA), the equimolar mixture (T + FA) and compound 2. Data is presented as means ± SEM of three independent experiments and results refer to untreated control cells (black). Statistical analysis was rendered using One-way ANOVA followed by Dunnett's multiple comparison posttest using GraphPad Prism 5 referring to cells treated with 5 mM glutamate only in A) and C) or to untreated control cells in B) and D). Levels of significance: *p < 0.01; ***p < 0.001. (For interpretation of the references to color in this figure legend, the reader is referred to the Web version of this article.)
Fig. 3
Fig. 3
Ferroptosis was induced in HT22 cells with 300 nM RSL3. A) Neuroprotective effect of 7-O-cinnamoyltaxifolin (1) and the controls taxifolin (T), cinnamic acid (CA) and the equimolar mixture of taxifolin and cinnamic acid (T + CA). B) Neuroprotective effect of 7-O-feruloyltaxifolin (2) and the controls taxifolin (T), ferulic acid (FA) and the one-to-one mixture of taxifolin and ferulic acid (T + FA). For both A) and B), data is presented as means ± SEM of three independent experiments and results refer to untreated control cells (black). Statistical analysis was rendered using One-way ANOVA followed by Dunnett's multiple comparison posttest using GraphPad Prism 5 referring to cells treated with 300 nM RSL3 only (red). Levels of significance: *p < 0.01; ***p < 0.001. (For interpretation of the references to color in this figure legend, the reader is referred to the Web version of this article.)
Fig. 4
Fig. 4
HT22 cells were treated with 20 μM iodoacetic acid (IAA) to induce ATP depletion in the absence or presence of the compounds. A) Protective effect of 7-O-cinnamoyltaxifolin (1) and the controls taxifolin (T), cinnamic acid (CA) and the equimolar mixture of taxifolin and cinnamic acid (T + CA). B) Protective effect of 7-O-feruloyltaxifolin (2) and the controls taxifolin (T), ferulic acid (FA) and the one-to-one mixture of taxifolin and ferulic acid (T + FA). For both A) and B), data is presented as means ± SEM of three independent experiments and results refer to untreated control cells (black). Statistical analysis was rendered using One-way ANOVA followed by Dunnett's multiple comparison posttest using GraphPad Prism 5 referring to cells treated with 20 μM IAA only (red). Levels of significance: ***p < 0.001. (For interpretation of the references to color in this figure legend, the reader is referred to the Web version of this article.)
Fig. 5
Fig. 5
Dose dependent effects of 7-O-cinnamoyltaxifolin 1 (A) and 7-O-feruloyltaxifolin 2 (B) and the equimolar mixtures (T + CA in A and T + FA in B) on total glutathione (tGSH) levels in HT22 cells in the absence (black lines) or presence (blue lines) of 5 mM glutamate (Glu) to induce oxytosis. GSH levels were measured in a chemical assay after 24 h and normalized to total protein. Results are given as mean ± SEM and were analyzed by One-way ANOVA followed by Dunnett's multiple comparison posttest using GraphPad Prism 5 referring to cells with no compound added. Levels of significance: *p < 0.05, **p < 0.01. (For interpretation of the references to color in this figure legend, the reader is referred to the Web version of this article.)
Fig. 6
Fig. 6
Effects of 1 and 2 and the respective controls on the production of NO and pro-inflammatory cytokines IL6 and TNFα by LPS-treated BV-2 microglia cells. Cells were treated overnight with 50 ng/mL LPS alone or in the presence of 7-O-cinnamoyltaxifolin (1), cinnamic acid (CA), taxifolin (T) and the one-to-one mixture of both (T + CA) (A and C) or with 7-O-feruloyltaxifolin (2), ferulic acid (FA), taxifolin (T) and the equimolar mixture of the individual components (T + FA) (B and D). Supernatants were cleared and NO was quantified by the Griess assay. Data in in A and B are given as means ± SEM and relative to BV-2 cells treated with LPS only, which were set as 100%. One-way ANOVA was used for statistical analysis followed by Dunnett's multiple comparison posttest. Levels of significance: *p < 0.05, **p < 0.01, ***p < 0.001. C) The effect of 10 μM 1 on levels of the pro-inflammatory cytokines IL6 and TNFα after LPS-treatment was assessed using ELISAs as was the effect of 10 μM 2 on IL6 (D). For C) and D) Results are presented as percent (%) of the values obtained for treatment with LPS alone, which were set as 100% and are shown means ± SEM. Levels of significance: *p < 0.05, **p < 0.01 of One-way ANOVA followed by Tukey's posttest.
Fig. 7
Fig. 7
Correlation of 7-O-cinnamoyltaxifolin 1 and Nrf2 in BV-2 microglia cells. A) Cells were treated for 4 h with DMSO as control or with increasing concentrations of 1, taxifolin (T) or the equimolar mixture of taxifolin and cinnamic acid (T + CA). Nuclear fractions of BV-2 cells were prepared and analyzed by Western blot for Nrf2 using a specific antibody. Levels of Nrf2 were normalized to actin and a representative blot is shown. B) Transfection of BV-2 cells with control siRNA or Nrf2 siRNA. Nuclei of cells incubated with 1 or vehicle (DMSO control) for 4 h were analyzed by Western blots for Nrf2. C) Griess assay for NO quantification of transfected cells treated with increased concentrations of 7-O-cinnamoyltaxifolin 1.
Fig. 8
Fig. 8
Cellular uptake of compound 1. A) 50 ng of taxifolin (T), cinnamic acid (CA), quercetin (Q) and 7-O-cinnamoyltaxifolin (1) were submitted to HPLC as reference for the compounds' retention times. B) 50 μM 1 were added to BV-2 cells and cells were immediately lysed (a), or incubated for 30 min (b), 90 min (c) or 4 h (d) prior to lysis and sample preparation. C) Incubation of 50 μM 1 for 30 min in medium only did not lead to compound conversion (a). (b): blank chromatogram with medium only. D) MS spectrum of the first HPLC peak (43.9 min) after incubating 1 for 30 min with BV-2 cells. The signal at m/z = 435.11 corresponds to 1 and was isolated for MS/MS fragmentation (inset) where m/z = 131.05 and m/z = 305.07 were detected corresponding to cinnamic acid and taxifolin, respectively. E) MS spectrum of the 48.9 min fraction gave a signal at m/z = 433.09 and the MS/MS fragmentation (inset) of the selected ion at m/z = 131.05 and m/z = 303.05 fit the m/z values of cinnamic acid and quercetin.
Fig. 9
Fig. 9
Effect of the compounds on Aβ25-35-induced spontaneous alternation deficits in mice. V – vehicle, 2 – 7-O-feruloyltaxifolin, 1 – 7-O-cinnamoyltaxifolin, FA – ferulic acid, T – taxifolin, CA – cinnamic acid. Data shows mean ± SEM. ANOVA: F(4,59) = 8.77, p < 0.001, n = 11–12 per group in A); F(4,58) = 19.97, p < 0.001, n = 11–12 in B); F(7,95) = 7.35, p < 0.001, n = 11–12 in C) and D); F(7,95) = 8.54, p < 0.001, n = 11–12 in E). ***p < 0.01 vs. (V + V)-treated group; #p < 0.05, ##p < 0.01, ###p < 0.001 vs. (Aβ25-35+V)-treated group; §p < 0.05, §§p < 0.01, §§§p < 0.001 vs. (Aβ25-35+2)-treated group; $ p < 0.05, $$ p < 0.01 vs. (Aβ25-35+1)-treated group; Dunnett's test.
Fig. 10
Fig. 10
Effect of the compounds on Aβ25-35-induced passive avoidance impairments in mice. Data shows median and interquartile range. Kruskal-Wallis ANOVA: H = 9.04, p < 0.1, n = 12 per group in (A); H = 15.0, p < 0.05, n = 12 in (B); H = 13.8, p < 0.05, n = 12 in (C); H = 12.0, p < 0.05, n = 12 in (D). *p < 0.05, **p < 0.01, ***p < 0.001 vs. (V + V)-treated group; Dunn's test.
Fig. 11
Fig. 11
Upper panel: development of the body weight; lower panel: average of weight gain from day 2–7. Data show mean (upper panel) or mean ± SEM (lower panel). Icv injection provoked a stress-induced acute weight loss, but animals recovered during the following days. ANOVA: F(4,51) = 1.73, p > 0.05, n = 12 in (B); F(4,51) = 1.25, p > 0.05, n = 12 in (D); F(4,51) = 1.20, p > 0.05, n = 12 in (F); F(4,51) = 0.73, p > 0.05, n = 12 in (H).

References

    1. World Alzheimer report 2018; Alzheimer's disease international. https://www.alz.co.uk/research/world-report-2018
    1. Doig A.J., Del Castillo-Frias M.P., Berthoumieu O., Tarus B., Nasica-Labouze J., Sterpone F., Nguyen P.H., Hooper N.M., Faller P., Derreumaux P. Why is research on amyloid-beta failing to give new drugs for Alzheimer’s disease? ACS Chem. Neurosci. 2017;8(7):1435–1437. - PubMed
    1. Agostinho P., Cunha R.A., Oliveira C.N. Oxidative stress and the pathogenesis of Alzheimer’s disease. Curr. Pharmaceut. Des. 2010;16(25):2766–2778. - PubMed
    1. Pohl F., Kong Thoo Lin P. The potential use of plant natural products and plant extracts with antioxidant properties for the prevention/treatment of neurodegenerative diseases: in vitro, in vivo and clinical trials. Molecules. 2018;23(12):3283–3313. - PMC - PubMed
    1. Currais A., Chiruta C., Goujon-Svrzic M., Costa G., Santos T., Batista M.T., Paiva J., do Ceu Madureira M., Maher P. Screening and identification of neuroprotective compounds relevant to alzheimers disease from medicinal plants of S. Tomé e Príncipe. J. Ethnopharmacol. 2014;155(1):830–840. - PubMed

Publication types