

The Genetics of the Mood Disorder Spectrum: Genome-wide Association Analyses of More Than 185,000 Cases and 439,000 Controls
- PMID: 31926635
- PMCID: PMC8136147
- DOI: 10.1016/j.biopsych.2019.10.015
The Genetics of the Mood Disorder Spectrum: Genome-wide Association Analyses of More Than 185,000 Cases and 439,000 Controls
Abstract
Background: Mood disorders (including major depressive disorder and bipolar disorder) affect 10% to 20% of the population. They range from brief, mild episodes to severe, incapacitating conditions that markedly impact lives. Multiple approaches have shown considerable sharing of risk factors across mood disorders despite their diagnostic distinction.
Methods: To clarify the shared molecular genetic basis of major depressive disorder and bipolar disorder and to highlight disorder-specific associations, we meta-analyzed data from the latest Psychiatric Genomics Consortium genome-wide association studies of major depression (including data from 23andMe) and bipolar disorder, and an additional major depressive disorder cohort from UK Biobank (total: 185,285 cases, 439,741 controls; nonoverlapping N = 609,424).
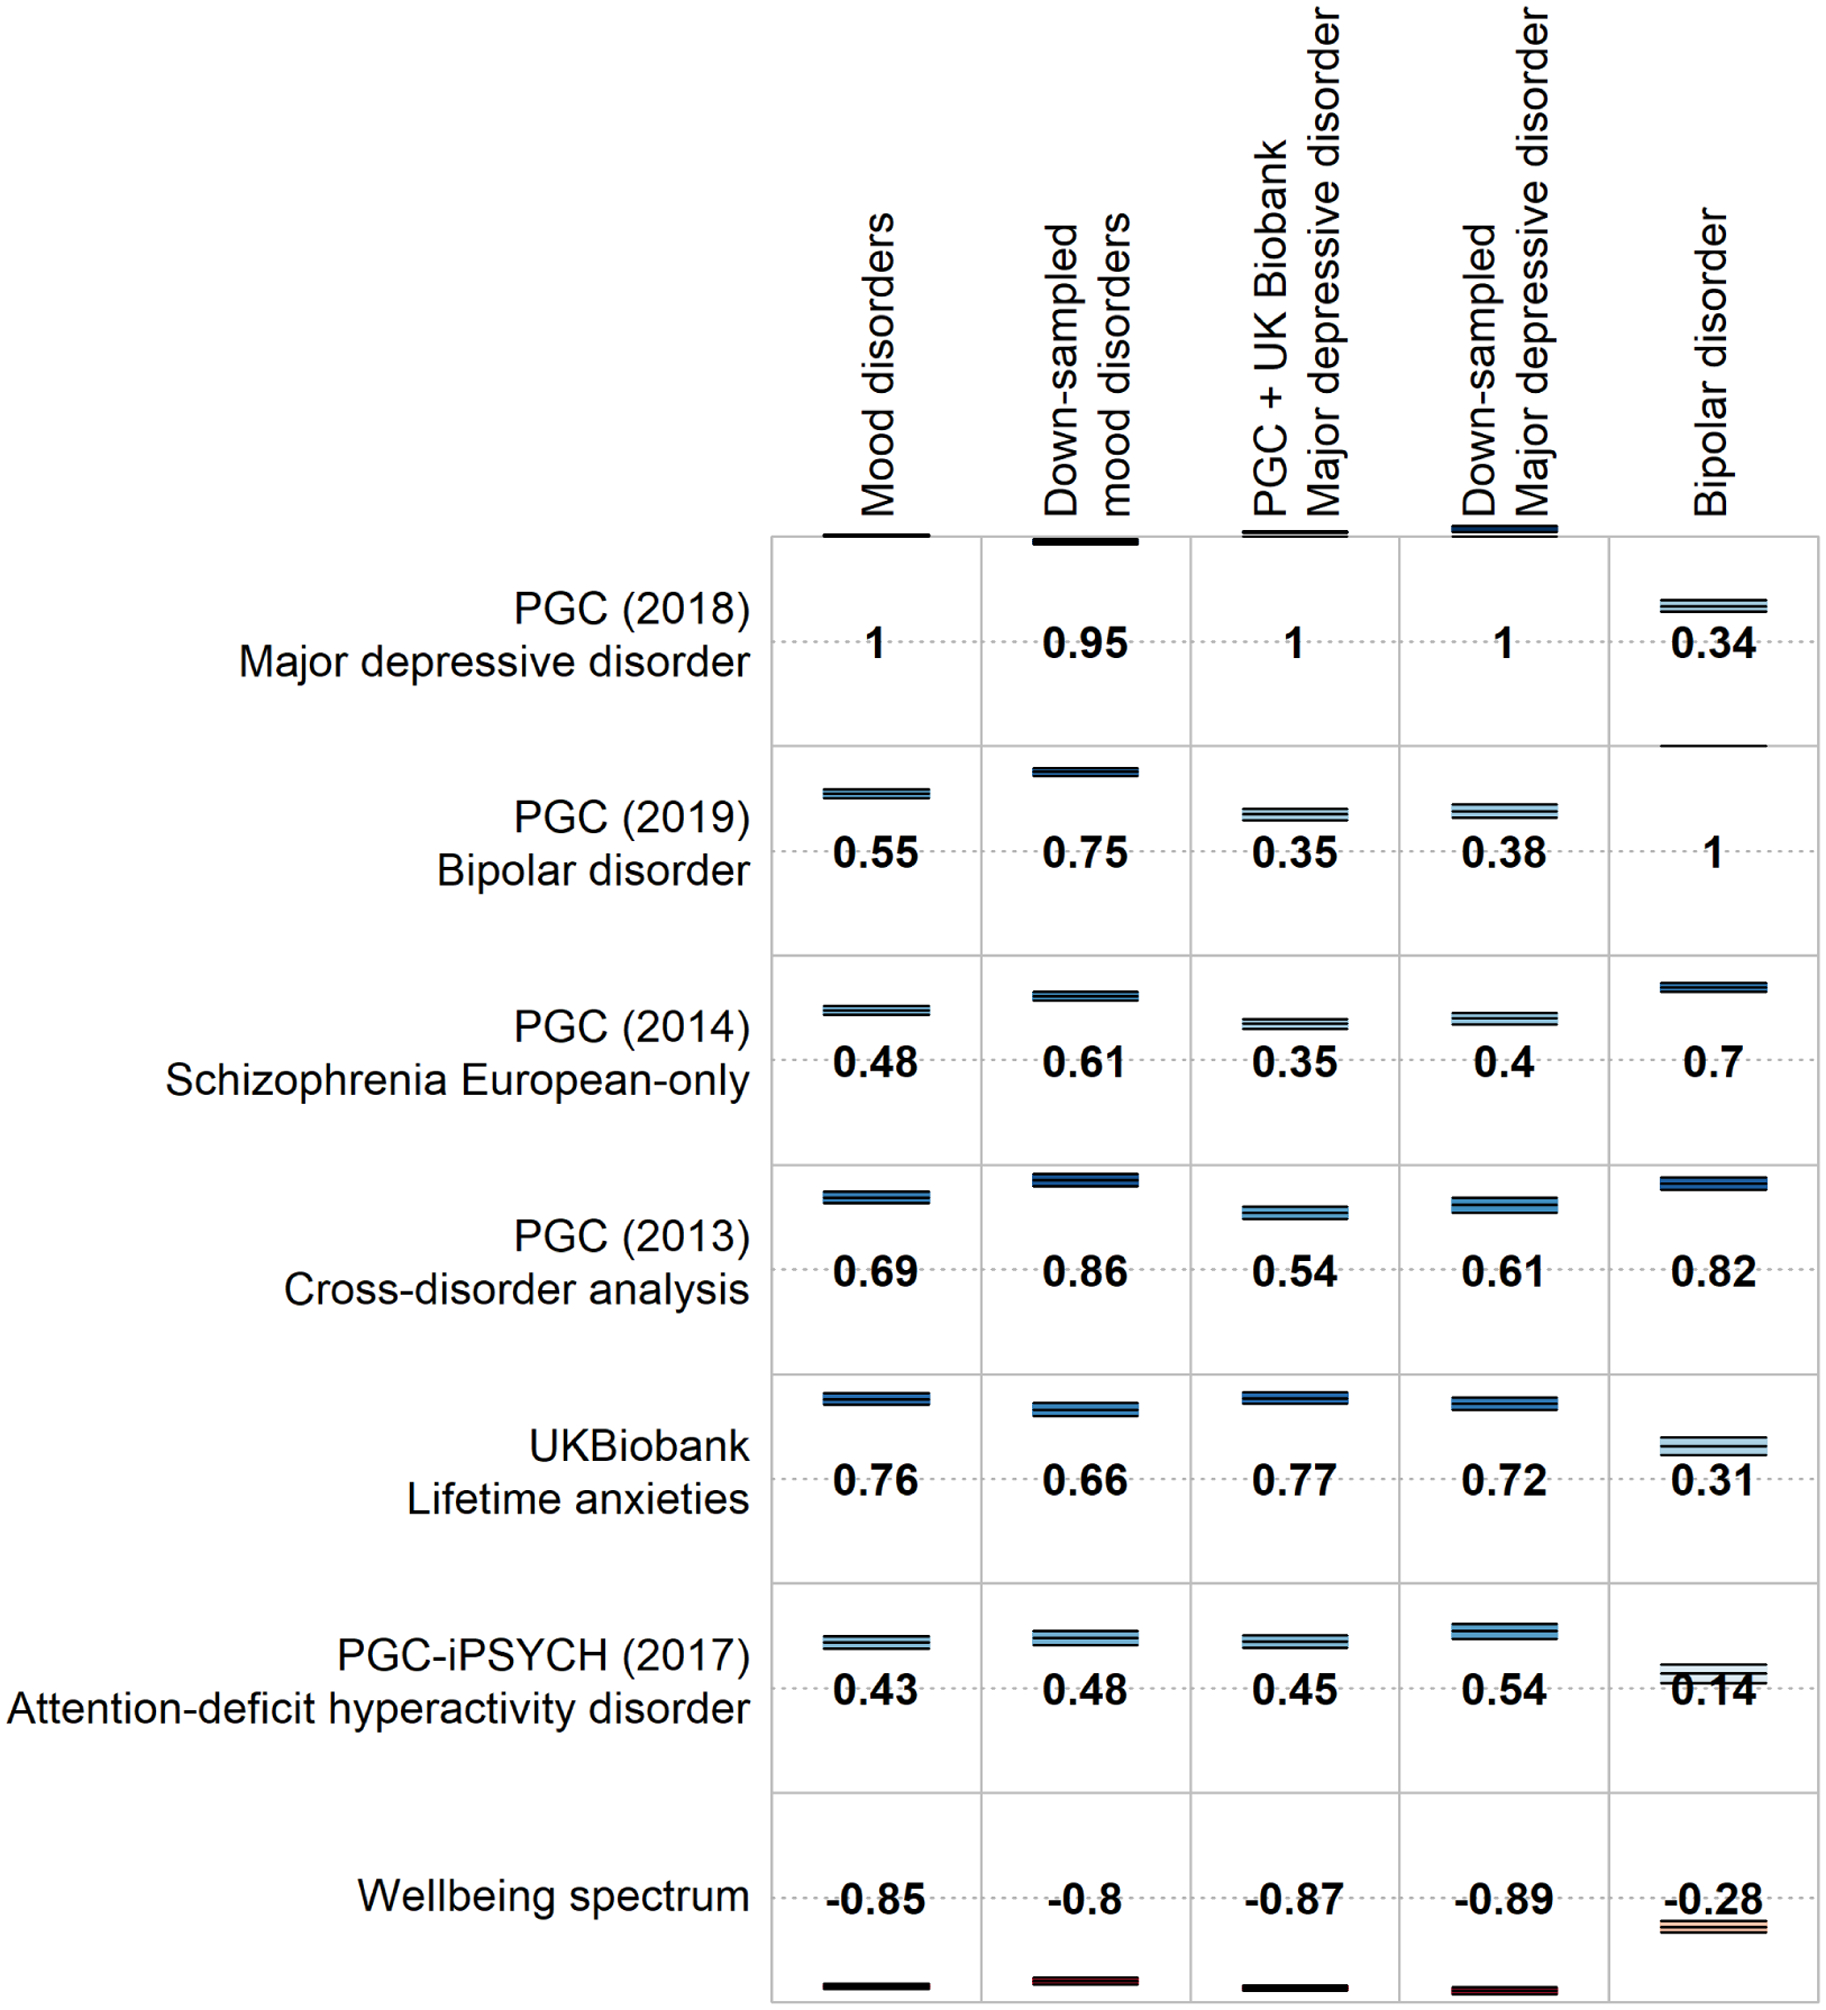
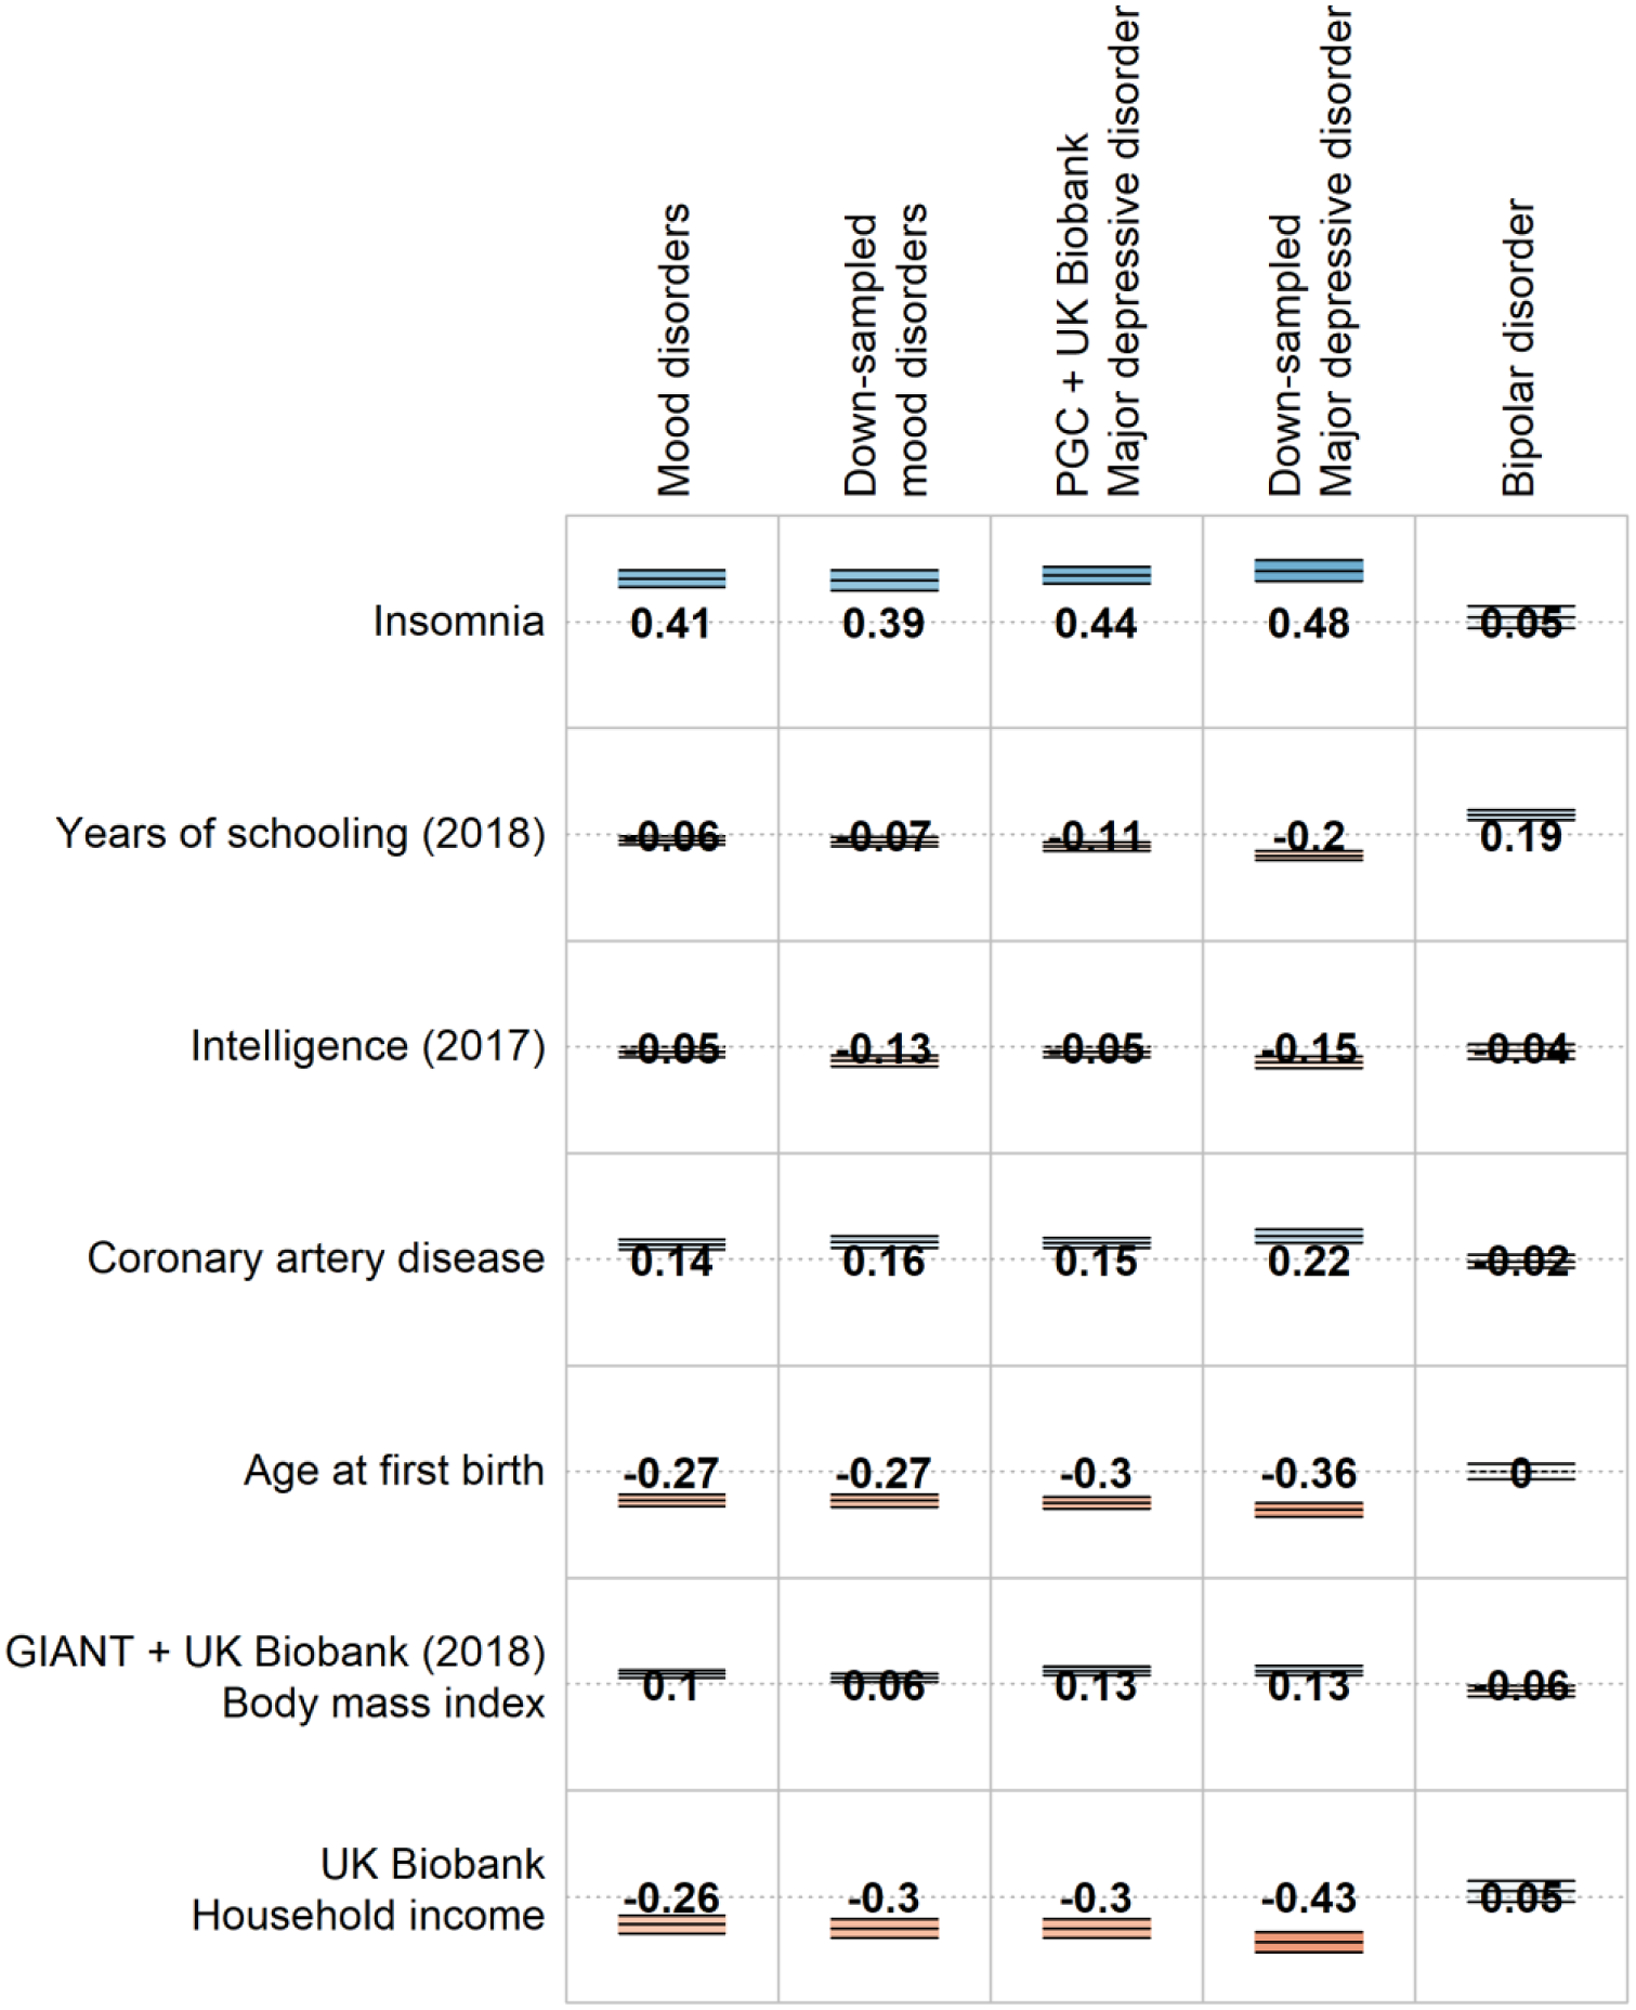
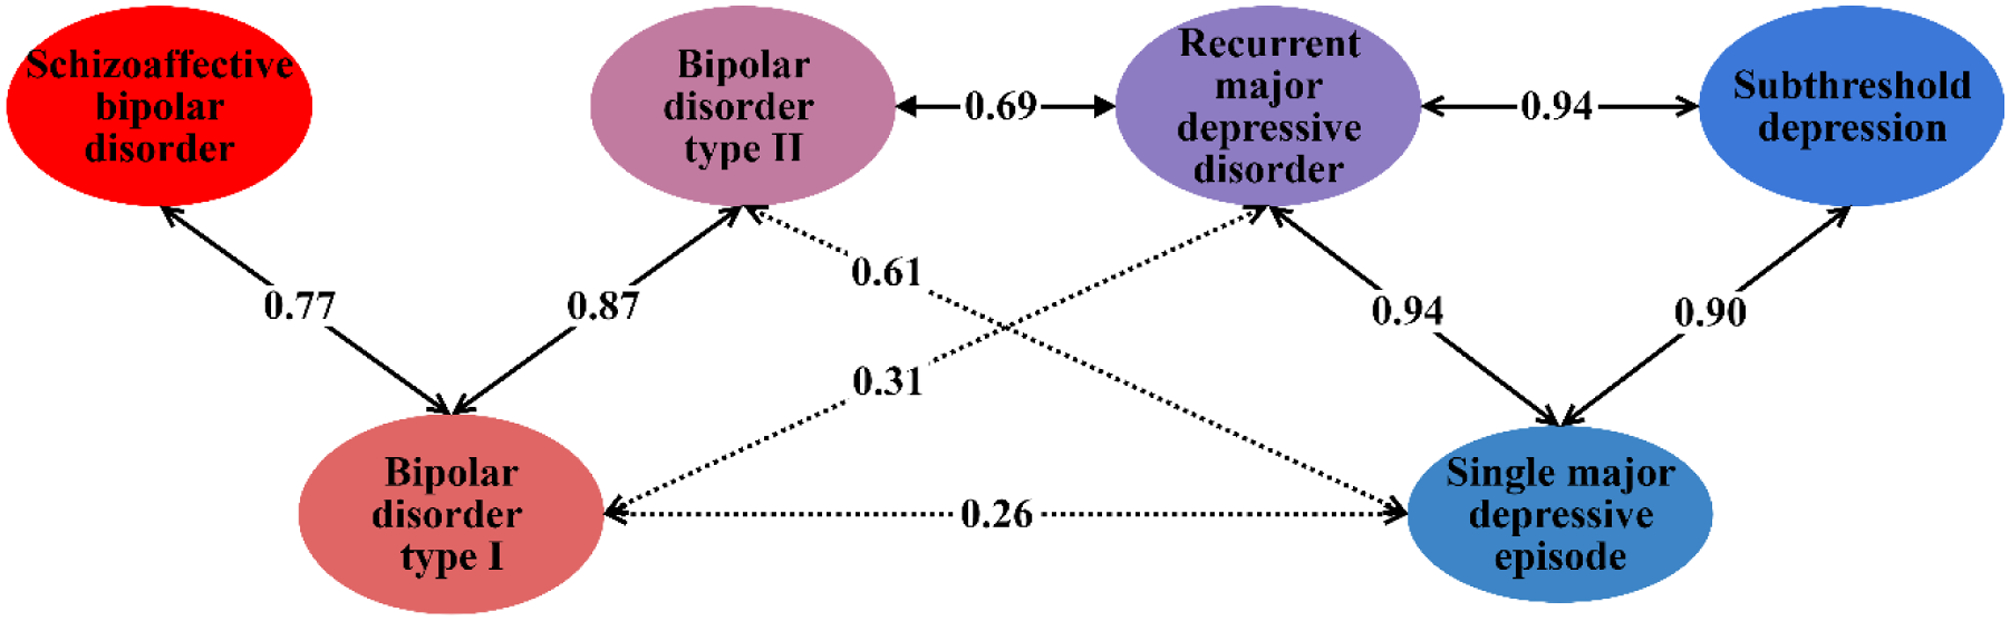
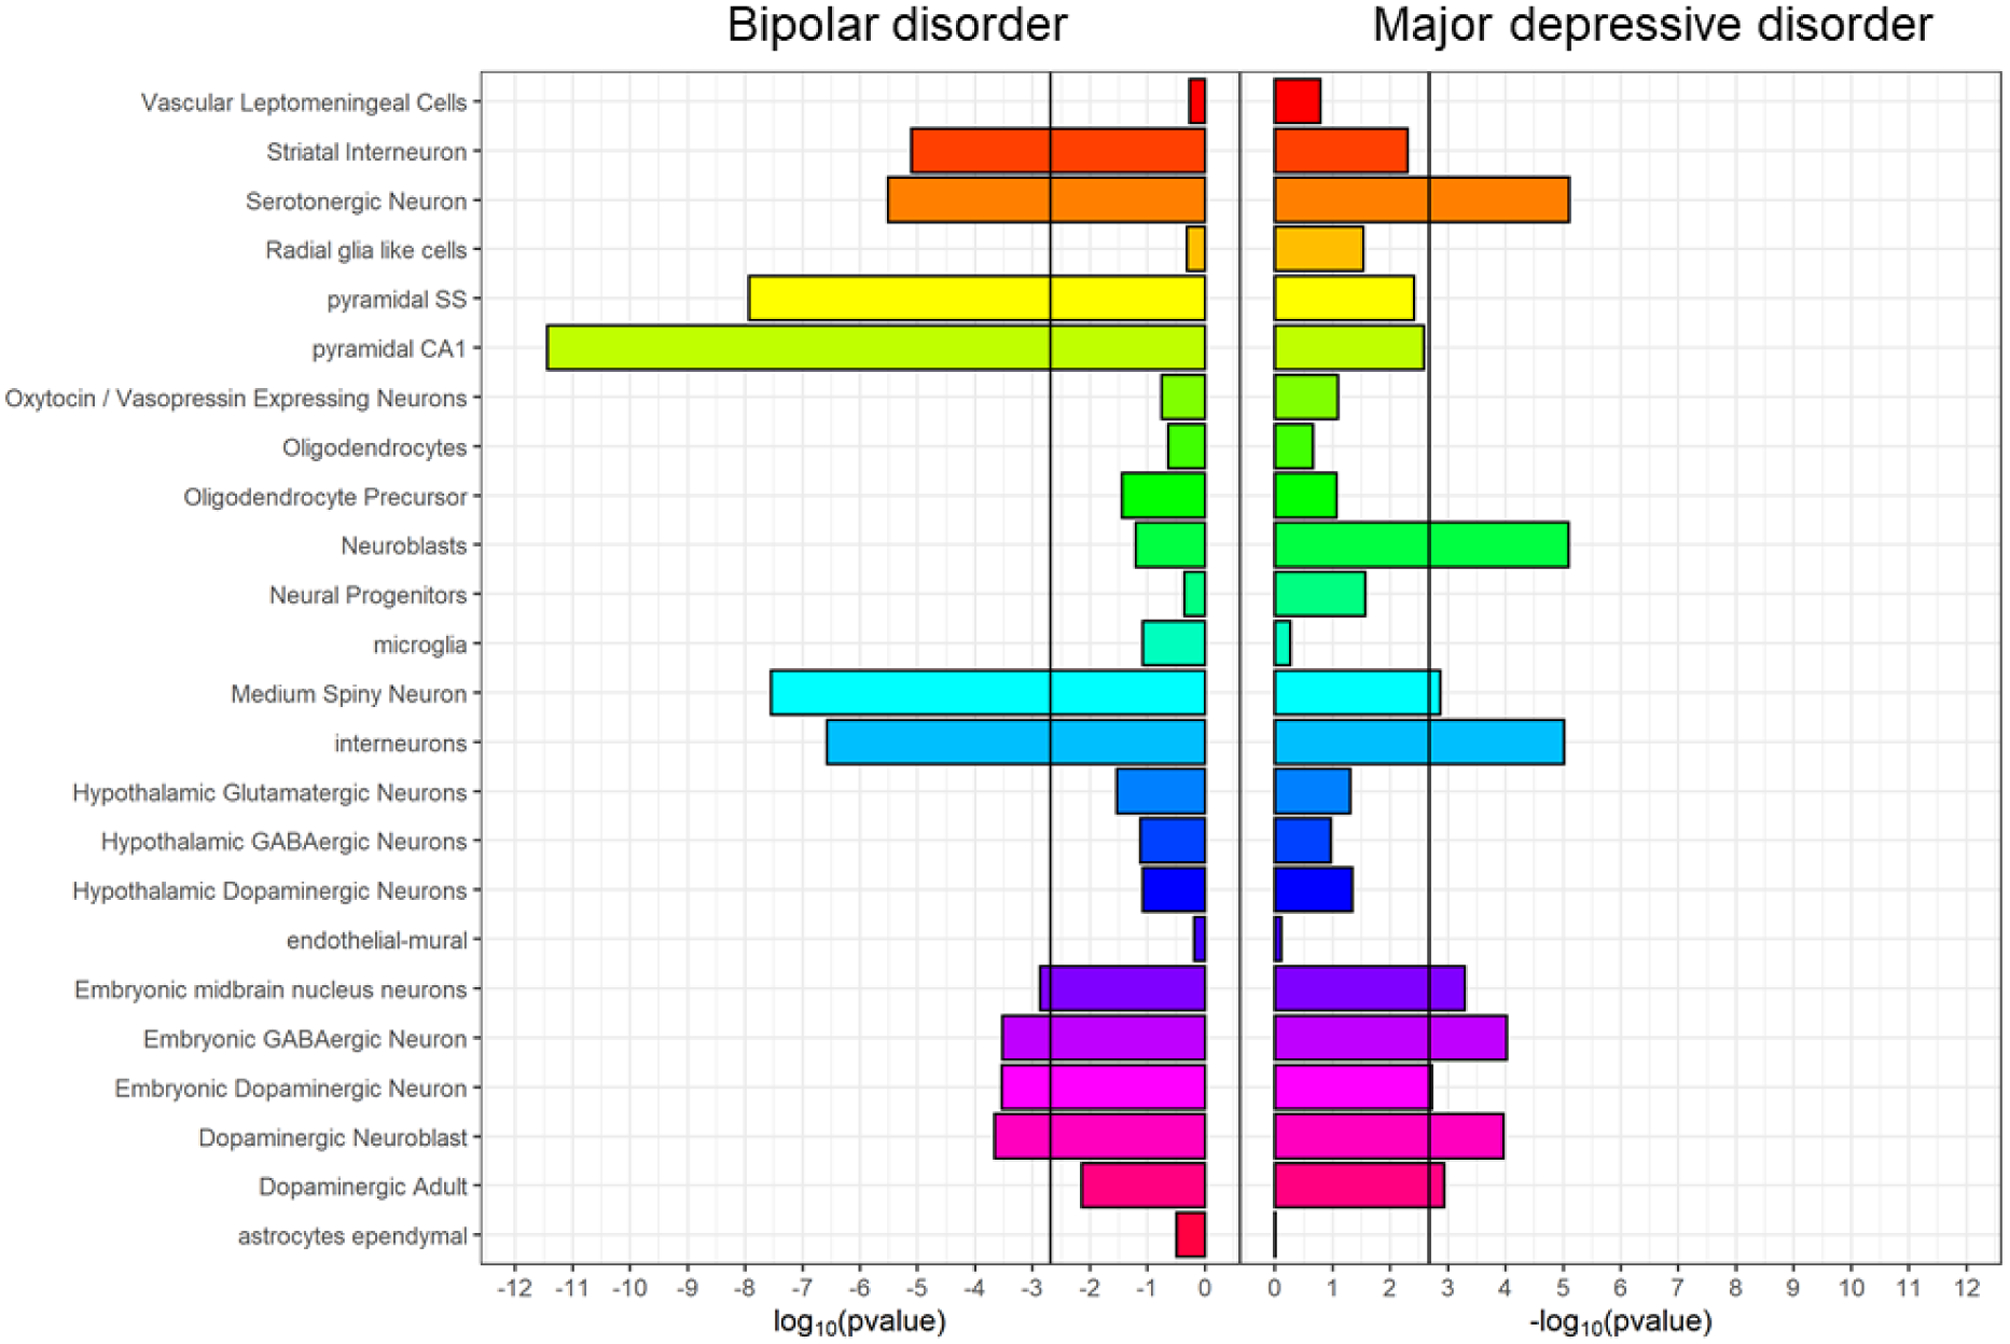
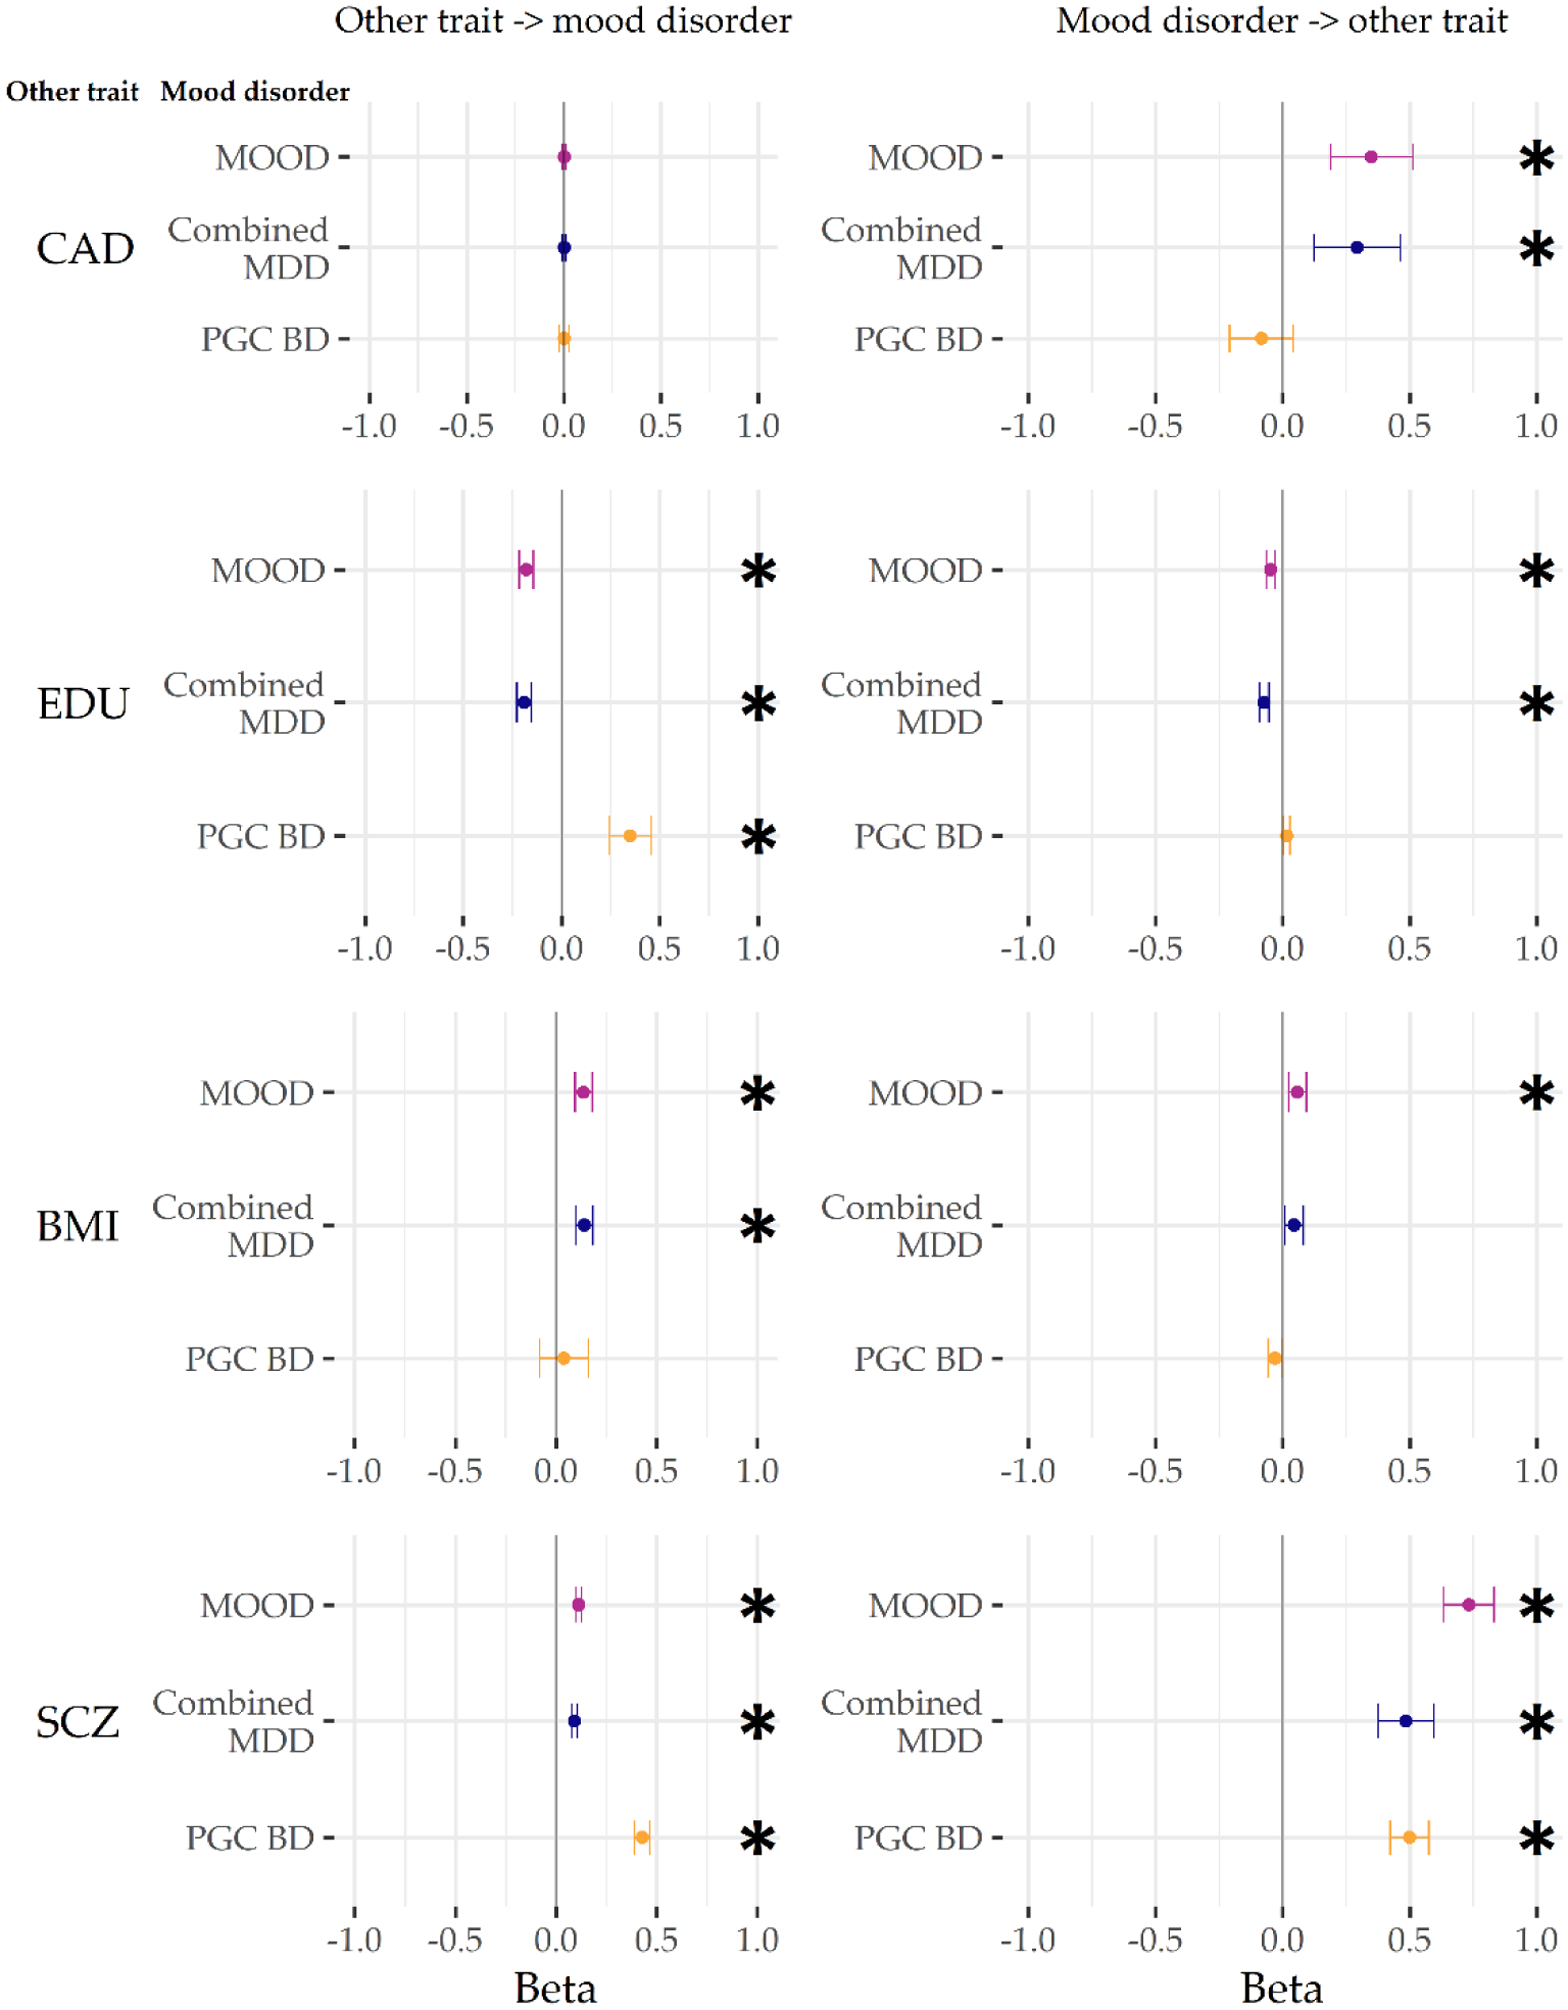
Results: Seventy-three loci reached genome-wide significance in the meta-analysis, including 15 that are novel for mood disorders. More loci from the Psychiatric Genomics Consortium analysis of major depression than from that for bipolar disorder reached genome-wide significance. Genetic correlations revealed that type 2 bipolar disorder correlates strongly with recurrent and single-episode major depressive disorder. Systems biology analyses highlight both similarities and differences between the mood disorders, particularly in the mouse brain cell types implicated by the expression patterns of associated genes. The mood disorders also differ in their genetic correlation with educational attainment-the relationship is positive in bipolar disorder but negative in major depressive disorder.
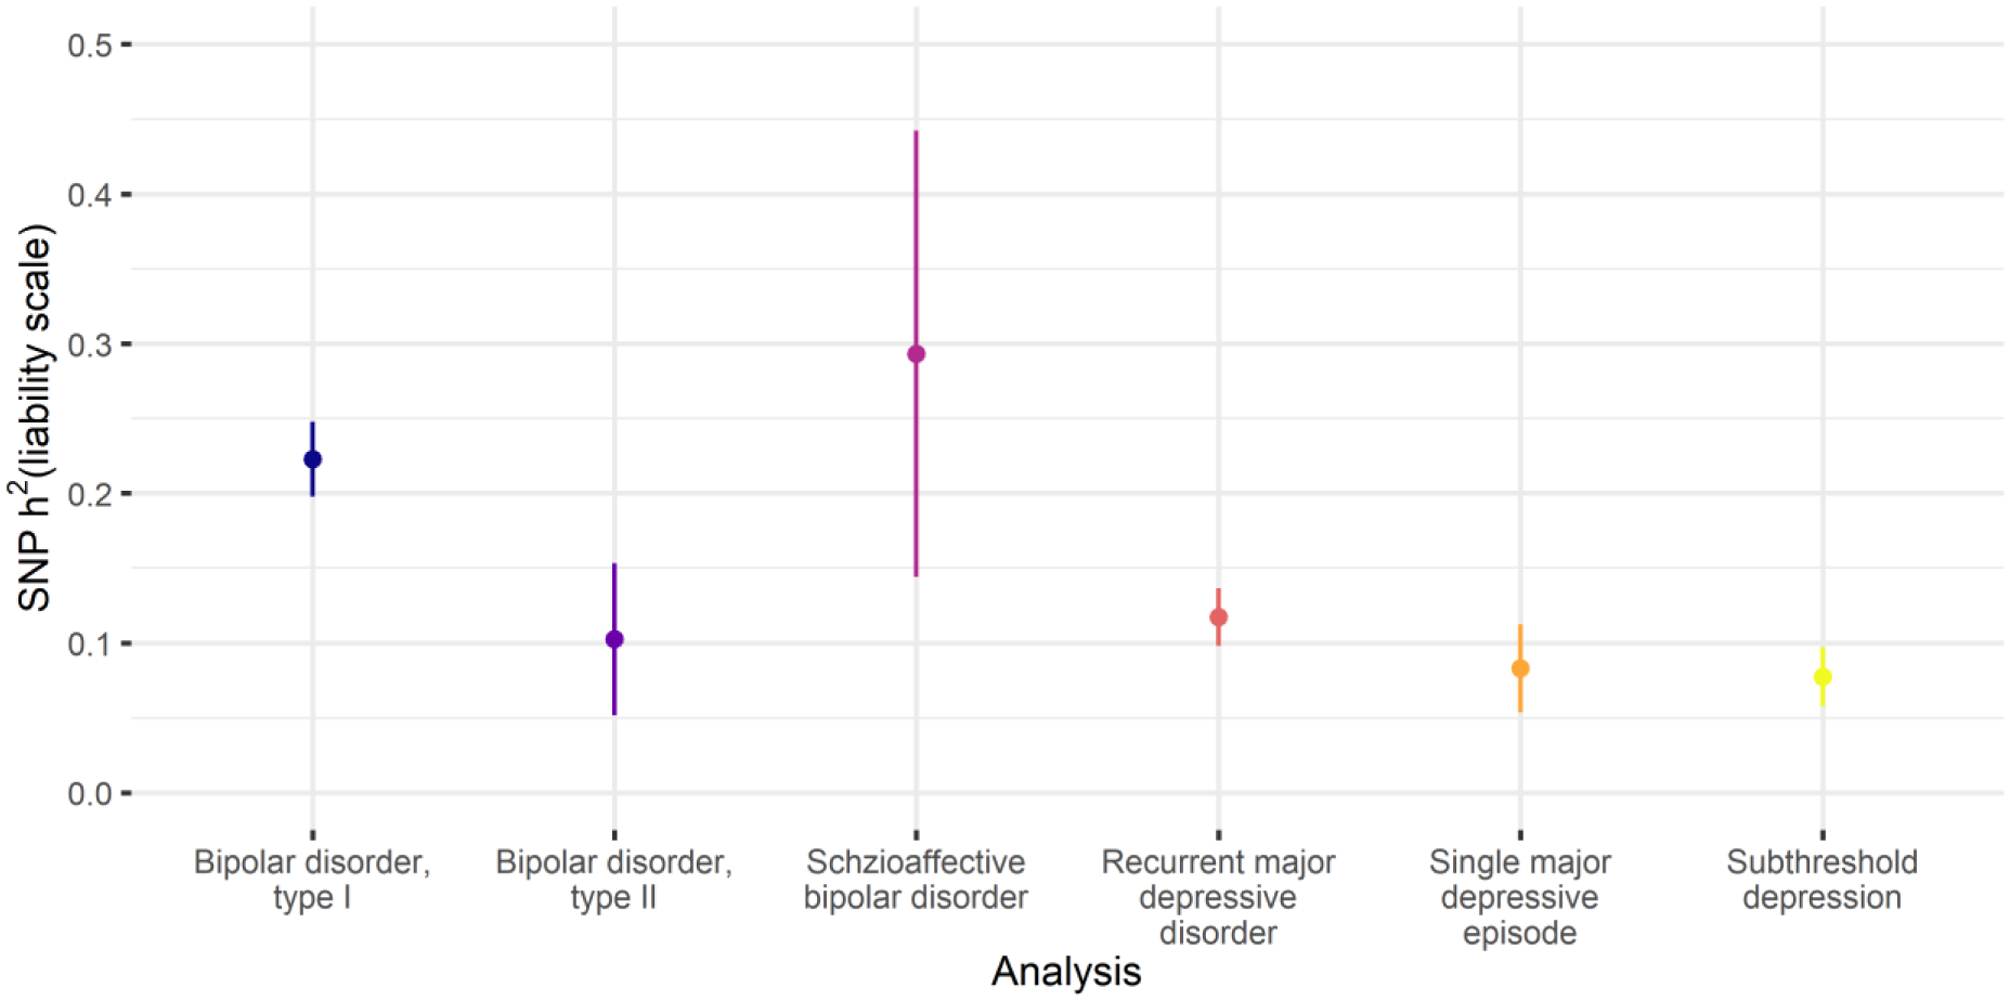
Conclusions: The mood disorders share several genetic associations, and genetic studies of major depressive disorder and bipolar disorder can be combined effectively to enable the discovery of variants not identified by studying either disorder alone. However, we demonstrate several differences between these disorders. Analyzing subtypes of major depressive disorder and bipolar disorder provides evidence for a genetic mood disorders spectrum.
Keywords: Affective disorders; Bipolar disorder; Genetic correlation; Genome-wide association study; Major depressive disorder; Mood disorders.
Copyright © 2019 Society of Biological Psychiatry. Published by Elsevier Inc. All rights reserved.
Conflict of interest statement
Disclosures
OA Andreassen has received speaker fees from Lundbeck. ATF Beekman is on speaker’s bureaus for Lundbeck and GlaxoSmithKline. G Breen reports consultancy and speaker fees from Eli Lilly, Otsuka and Illumina and grant funding from Eli Lilly. G Crawford is a cofounder of Element Genomics. E Domenici was formerly an employee of Hoffmann–La Roche and a consultant to Roche and Pierre-Fabre. J Nurnberger is an investigator for Janssen and was an investigator for Assurex. SA Paciga is an employee of Pfizer. JA Quiroz was formerly an employee of Hoffmann–La Roche. S Steinberg, H Stefansson, K Stefansson and TE Thorgeirsson are employed by deCODE Genetics/Amgen. PF Sullivan reports the following potentially competing financial interests. Current: Lundbeck (advisory committee, grant recipient). Past three years: Pfizer (scientific advisory board), Element Genomics (consultation fee), and Roche (speaker reimbursement). AH Young has given paid lectures and is on advisory boards for the following companies with drugs used in affective and related disorders: Astrazenaca, Eli Lilly, Janssen, Lundbeck, Sunovion, Servier, Livanova. AH Young is Lead Investigator for Embolden Study (Astrazenaca), BCI Neuroplasticity study and Aripiprazole Mania Study, which are investigator-initiated studies from Astrazenaca, Eli Lilly, Lundbeck, and Wyeth. All other authors declare no financial interests or potential conflicts of interest.
Figures
Comment in
-
Delineating the Shared Genetics Across the Mood Disorders Spectrum.Biol Psychiatry. 2020 Jul 15;88(2):134-135. doi: 10.1016/j.biopsych.2020.04.017. Biol Psychiatry. 2020. PMID: 32616199 No abstract available.
References
-
- Kessler RC, Berglund P, Demler O, Jin R, Merikangas KR, Walters EE (2005): Lifetime prevalence and age-of-onset distributions of DSM-IV disorders in the National Comorbidity Survey Replication. Arch Gen Psychiatry. 62: 593–602. - PubMed
-
- Weissman MM, Bland RC, Canino GJ, Faravelli C, Greenwald S, Hwu HG, et al. (1996): Cross-national epidemiology of major depression and bipolar disorder. JAMA. 276: 293–299. - PubMed
-
- Spitzer RL, Md KK, Williams JBW (1980): Diagnostic and Statistical Manual of Mental Disorders, Third Edition. AMERICAN PSYCHIATRIC ASSOCIATION. .
Publication types
MeSH terms
Grants and funding
- MR/N01104X/2/MRC_/Medical Research Council/United Kingdom
- WT083573/Z/07/Z/WT_/Wellcome Trust/United Kingdom
- U01 MH105653/MH/NIMH NIH HHS/United States
- G0901245/MRC_/Medical Research Council/United Kingdom
- R01 MH086026/MH/NIMH NIH HHS/United States
- R01 MH063480/MH/NIMH NIH HHS/United States
- R37 AA007728/AA/NIAAA NIH HHS/United States
- U01 MH109528/MH/NIMH NIH HHS/United States
- R01 MH085542/MH/NIMH NIH HHS/United States
- R01 MH090553/MH/NIMH NIH HHS/United States
- G1001799/MRC_/Medical Research Council/United Kingdom
- R01 MH078151/MH/NIMH NIH HHS/United States
- 04036/Z/14/Z/WT_/Wellcome Trust/United Kingdom
- R01 AA007535/AA/NIAAA NIH HHS/United States
- RC2 AG036607/AG/NIA NIH HHS/United States
- R01 MH072802/MH/NIMH NIH HHS/United States
- MR/N015746/1/MRC_/Medical Research Council/United Kingdom
- R01 MH103368/MH/NIMH NIH HHS/United States
- R01 MH100549/MH/NIMH NIH HHS/United States
- G0801418/MRC_/Medical Research Council/United Kingdom
- R01 DA017932/DA/NIDA NIH HHS/United States
- G1000708/MRC_/Medical Research Council/United Kingdom
- R01 MH077139/MH/NIMH NIH HHS/United States
- ZIA MH002843/ImNIH/Intramural NIH HHS/United States
- R01 AA007728/AA/NIAAA NIH HHS/United States
- R01 MH059567/MH/NIMH NIH HHS/United States
- R01 DA034076/DA/NIDA NIH HHS/United States
- MR/N01104X/1/MRC_/Medical Research Council/United Kingdom
- G0200243/MRC_/Medical Research Council/United Kingdom
- EP-C-15-001/EPA/EPA/United States
- WT090532/Z/09/Z/WT_/Wellcome Trust/United Kingdom
- R01 MH081804/MH/NIMH NIH HHS/United States
- G19/2/MRC_/Medical Research Council/United Kingdom
- U01 MH109536/MH/NIMH NIH HHS/United States
- WT089269/Z/09/Z/WT_/Wellcome Trust/United Kingdom
- U01 MH109514/MH/NIMH NIH HHS/United States
- R01 MH061613/MH/NIMH NIH HHS/United States
- R01 MH085548/MH/NIMH NIH HHS/United States
- G0701420/MRC_/Medical Research Council/United Kingdom
- R01 AA010249/AA/NIAAA NIH HHS/United States
- R01 MH123451/MH/NIMH NIH HHS/United States
- R01 MH106531/MH/NIMH NIH HHS/United States
- U01 MH109532/MH/NIMH NIH HHS/United States
- 104036/Z/14/Z/WT_/Wellcome Trust/United Kingdom
- U01 MH105578/MH/NIMH NIH HHS/United States
- WT_/Wellcome Trust/United Kingdom
- G0800509/MRC_/Medical Research Council/United Kingdom
